Finite size melting of spherical solid-liquid aluminium interfaces
Abstract
We have investigated the melting of nano-sized cone shaped aluminium needles coated with amorphous carbon using transmission electron microscopy. The interface between solid and liquid aluminium was found to have spherical topology. For needles with fixed apex angle, the depressed melting temperature of this spherical interface, with radius , was found to scale linearly with the inverse radius . However, by varying the apex angle of the needles we show that the proportionality constant between the depressed melting temperature and the inverse radius changes significantly. This lead us to the conclusion that the depressed melting temperature is not controlled solely by the inverse radius . Instead we found a direct relation between the depressed melting temperature and the ratio between the solid-liquid interface area and the molten volume.
pacs:
61.46.-w, 64.70.Dv, 68.37.LpI Introduction
Thermodynamic properties of a material with reduced dimensionality can be markedly different from the bulk properties.RPP ; RMP The melting temperature of materials confined to nano-meter size can, for example, be significantly different from the bulk melting temperature . Since the first experimental evidence,Takagi (1954) melting of nano-scale metal clusters has been a case study Buffat and Borel (1976); Berman and Curzon (1974); allen1986 ; Peters et al. (1998, 1997); Dippel et al. (2001); Lai et al. (1996, 1998); Zhang et al. (2000); Breaux et al. (2005); Saka et al. (1988); Gråbaek et al. (1990); Zhang and Cantor (1991); Ohashi et al. (1992); Unruh et al. (1993), involving a number of experimental techniques such as transmission electron microscopy (TEM),Buffat and Borel (1976); Berman and Curzon (1974); allen1986 X-ray diffraction, Peters et al. (1998, 1997) scanning tunneling microscopy (STM),Dippel et al. (2001) and calorimetric methods.Lai et al. (1996, 1998); Zhang et al. (2000); Breaux et al. (2005) For a recent review on size dependent melting see Ref. mei2007, . For free standing particles a depressed melting temperature proportional to the inverse radius is typically observed. However, a number of new investigations have reported a possibility of a non-linear relationship between and when the particles are sufficiently small.allen1986 ; Nanda (1998); Dippel et al. (2001) These contradictory results give rise to the fundamental question: what is really controlling the depressed melting temperature? Several phenomenological models address the question of size dependent melting temperature.pawlow ; hanszen ; Chang and Johnson (2005); Sun et al. (2002); sunREV ; delogu The problem is complicated by the fact that different crystal faces have different surface energies and by the occurrence of surface premelting lipowsky ; pluis ; Kofman et al. (1993, 1999) that depends on the surface energies. In this paper we present an experimental sample geometry that, as we will see, avoids these complications.
We use transmission electron microscopy (TEM) to investigate the size dependent melting point of nano-sized cone shaped aluminium needles as a function of the apex angle. The interface between solid and liquid aluminium was found to have a spherical topology thus the problem of crystal facets is eliminated. For a needle with fixed apex angle we find a linear relation between the depressed melting temperature and the inverse radius of the spherical solid-liquid interface similar to the observations for spherical particles where in which case is a size-independent constant. However, by varying the apex angle we show that the proportionality constant changes significantly. This implies that the depressed melting is not solely controlled by the inverse radius. Instead, we argue that the depressed melting is determined by the ratio between the solid-liquid interface area and the molten volume.
II Methods
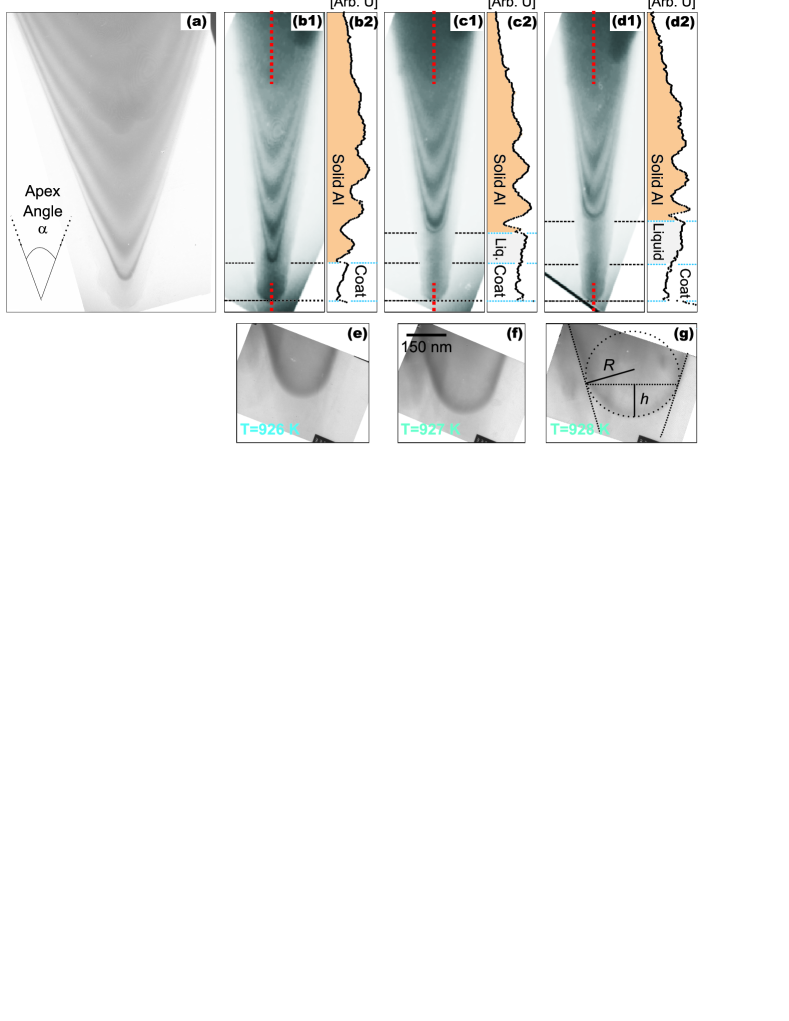
Samples with cone shaped aluminium needles were fabricated, from 99.99 pure aluminium, using the so-called ion digging method.Kawasaki et al. (1999) A suspension of fine diamond powder was dispersed on the vertical edge of a 0.1mm thin Al semi-disk (3mm diameter). The samples were mounted in an ion milling machine equipped with a nitrogen cooled stage. Sputtering with argon ions in the disk plane results in formation of thin needles at areas initially protected by diamond particles that were eventually sputtered completely away. With this technique cone shaped Al needles with apex angles of 20-50 degrees and diameters at the needle point around 20-30 nm could be fabricated, see Fig. 1(a) and (b1). A schematic illustration of this lithographic mask technique together with some preliminary results on Sn needles were given in Ref. Chang et al., 2005.
In order to avoid evaporation, of aluminium, during the in situ heating experiment the whole surface of the needle samples were coated with a 50-80 nm thick amorphous carbon layer in a plasma coating apparatus.Kato et al. (2000) In addition to protecting the needles, the carbon coating also helps to maintain the cone shape of the liquid phase during the in situ experiment. All samples were examined in a JEOL 200CX transmission electron microscope (TEM) using an operating voltage of 200kV and the in situ melting experiment was performed by making use of a side-entry heating holder. The temperature was recorded with a thermocouple (Pt-PtRh 13) placed in contact with the specimen cartridge. The errors that could occur in the temperature measurements, due to for example electron irradiation, are systematically small and do not disturb the real physical tendencies.Senda et al. (2004); Chang et al. (2005) Conventional bright-field and dark-field imaging techniques were used to observe the solid-liquid interface.
III Results
In this paper, we are going to study the melting process of four Al needles with apex angles 26, 29, 36 and 42 degrees. However, we start by inspecting the TEM micrographs of needles with and recorded at K before the melting initiates at , see Fig. 1(a) and (b1). Both needles display a high degree of symmetry which is further supported by the symmetry of the thickness fringes. These TEM images therefore demonstrate that the needles have an almost perfect conical shape. To inspect the images more carefully it is useful to plot the intensity profile along the central axis of the needle as indicated by the vertical dashed lines in Fig. 1(b1). Moving from the thick part of the needle (top of Fig. 1(b1)) towards the needle tip, the intensity displays a period oscillatory behavior (Fig. 1(b2)) that stems from the thickness that varies along the needle. Eventually the intensity displays a discontinuity at the point between the needle tip and the carbon coat as indicated by the top horizontal dashed line in Fig. 1(b1) and (b2). Finally, the intensity varies slowly without any oscillations along the carbon coat due to its amorphous structure, see Fig. 1(b2).
Now we turn to discuss the finite size melting of the needles in the temperature range . In Fig. 1(c1) and (d1) we show the same needle as in Fig. 1(b1) but recorded at K and K, respectively. In both cases the tip of the needle is molten. This fact is also visualized by the intensity profiles in Fig. 1(c2) and (d2). The discontinuity between the needle tip and the carbon coat is no longer visible and another discontinuity appears at a thicker part of the needle, see Fig. 1(c2) and (d2). We interpret this in terms of a melting process where the top part of the needle is molten and the discontinuity of the intensity profile now marks the interface between solid and liquid aluminium. As neither the liquid aluminium nor the amorphous carbon coat have any crystal structure we can not easily distinguish these two elements from our bright-field images. This explains why the discontinuity that appears at the needle tip for disappears for .
Next, we are going to discuss the topology of the solid-liquid interface. A careful inspection of the image shown in Fig. 1(c) reveals that the first dark fringe, in contrast to the other dark thickness fringes, has a circular shape. This fringe indicates the position of the solid-liquid interface and it strongly suggests that it has a spherical topology. This was further confirmed by bright-field images taken with six times higher magnification shown in Fig. 1(e)-(g). As the temperature increases from K in Fig. 1(e) to K in Fig. 1(g), the solid-liquid interface area becomes larger as the melting front moves towards the thicker part of the needle. However, the solid-liquid interface remains spherical at all the observed temperatures. Finally we emphasize that during alternating heating and cooling cycles no hysteresis was observed between melting and solidification – indicating that the system is in a true equilibrium at all temperatures. Furthermore, the system does not seem to favor surface premelting since no precursor of the melting could be detected.
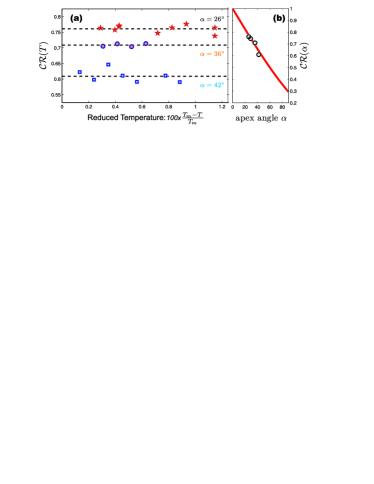
We are now going to describe the interface between the solid and liquid phases in greater detail. Since the solid-liquid interface forms a spherical cap at each temperature , one can extract a cap height and a spherical radius directly from the TEM micrographs as shown in Fig. 1(g). In Fig. 2(a) we show the cap ratio as a function of the reduced temperature for the needles with , and 42∘. This reveals the following important facts: (i) the cap ratio is essentially temperature independent for each of the needles and (ii) the cap ratio decreases systematically with increasing apex angle . This implies that the cap geometry remains unchanged as the melting front moves towards the thicker part of a needle with fixed . However, the cap ratio varies systematically as a function of apex angle . For each of the needles was extracted by constant fits to the data, see dashed lines in Fig. 2(a). The values of , given in table 1, are shown in Fig. 2(b).
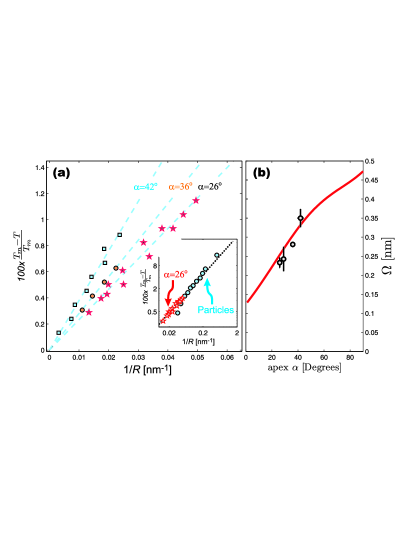
We are now going to describe the size dependent melting of the aluminium needles on a more quantitative level. Once the melting process is initiated for a spherical solid-liquid interface with a radius is formed. Increasing (decreasing) the temperature leads to a corresponding increase (decrease) in the radius of the spherical interface. Thus the temperature associated with is in fact the melting temperature of the spherical solid-liquid interface. By controlling the temperature and measuring on the TEM micrographs, it is possible to track the size dependent melting temperature as a function of . Figure 3 displays the reduced melting temperature as a function of the inverse radius . As for spherical metal particles there seems to be a linear relation between the depressed melting temperature and the inverse radius , i.e.,
| (1) |
where is a constant that depends on the apex angle . For a comparison, the inset of Fig. 3(a) shows the depressed melting temperature of aluminium particles supported by a substrateLai et al. (1998) and the needle shown in Fig. 1(b1). The shared linearity might however be a coincidence since the proportionality constant seems to depend strongly on the apex angle . By linear fits to the data, see dashed lines in Fig.3(a), was extracted for all the studied needles. The result of these fits, shown in Fig. 3(b) and table 1, reveals that increases significantly when the apex angle is increased from 26∘ to 42∘. This implies that for a given radius the reduced melting temperature may vary dramatically. Thus the melting of the spherical interface is not controlled by the local thickness of the needle. This conclusion is further supported directly from the TEM images since the melting front does not follow the contours of the thickness fringes.
IV Discussion
We now turn to discuss the melting process from simple geometric considerations assuming that the needles have a perfect conical shape. The cap ratio relates, in this case, to the apex angle by
| (2) |
where is the contact angle between the carbon coat and the solid-liquid interface. The fact that the cap ratio is approximately temperature independent for a fixed apex angle implies that remains constant as the melting front moves towards the thicker part of the needle. Assuming that we know with a reasonable degree of precision () one can thus derive the contact angle from a constant fit to the data as shown by dashed lines in Fig. 2. We find that is systematically small () for all the studied needles, see table 1. In fact is smaller or comparable to the estimated error of , it is therefore reasonable to assume that . The solid line in Fig. 2(b) shows calculated from Eq. 2 with .
Next we are going to discuss the ratio between the molten volume and the solid-liquid interface area. For a given temperature we observed a spherical solid-liquid interface with radius . Now, if the temperature increases to , a part of the solid volume is going to melt. This leads to a larger solid-liquid interface with radius . The molten volume therefore increases to where
| (3) |
Naturally, the solid-liquid interface area increases as well to with
| (4) |
and the liquid-coat area increases with
| (5) |
We are now going to assume that the condition for melting is that the energy gained upon melting a solid volume has to be balanced with the increased interface area . Hence
| (6) |
where is the latent heat per unit volume, is the latent heat of fusion, and (, ) is the solid-liquid (solid-coat, liquid-coat) interface energy.
Now since the contact angle between the carbon coat and the solid-liquid interface is approximately zero we can assume, via Young’s relation (), that .
From Eqs. (3), (4), (5), and (6) we now have
| (7) |
where is the surface area to molten volume ratio and
| (8) |
is a geometrical factor depending only on the apex angle . In table 1, is evaluated for each of the needles.
The depressed melting temperature for a needle with fixed apex angle is therefore, in this simple model, proportional to the inverse radius as observed by the experiment. Furthermore the model predicts that the proportionality constant where MJ/m3 (Ref. Lide, 1997-1998). To compare the model with the data, the only adjustable parameter is the solid-liquid interface energy . The solid line in Fig. 3(b) shows as predicted by the model with mJ/m2.
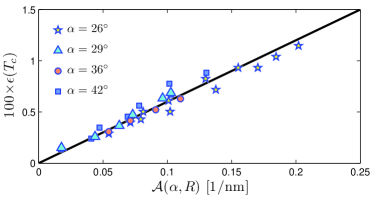
The reasonable agreement between the model and the data indicates that the -dependence of the proportionality constant should be understood directly from the surface area to molten volume ratio . To visualize this point, we show in Fig. 4 the depressed melting temperature as a function of for all the studied needles. Now all the data points collapse onto a single line with the slope . Our results therefore strongly suggest that the melting process is governed by the surface area to molten volume ratio and not by the local size of the system. Notice that while this might seem as an obvious conclusion from a theoretical point of view it is not trivial to demonstrate it experimentally.
| 26∘ | 29∘ | 36∘ | 42∘ | |
|---|---|---|---|---|
| 0.761(4) | 0.745(7) | 0.709(3) | 0.609(8) | |
| [nm] | 0.23(1) | 0.24(3) | 0.281(7) | 0.35(2) |
| 0.032 | 0.019 | -0.030 | 0.048 | |
| 4.08 | 4.34 | 4.91 | 5.36 |
By varying the apex angle we succeeded to change the surface area to molten volume ratio in a systematic fashion. This is shown in Fig. 2 – as the apex angle increases the cap ratio decreases, which in turn leads to a corresponding increase of the surface area to molten volume ratio , see table 1. Thus we managed to vary without necessarily to change the radius as opposed to the case of spherical particles. The advantage of the needle system is therefore that we could show that the depressed melting temperature scales directly with the surface area to molten volume ratio by varying both and .
We now return to the discussion of the finite size melting of metal particles on a substrate. The literature contains examples of both linear Buffat and Borel (1976); Lai et al. (1996) and non-linear Dippel et al. (2001) relationships between the depressed melting temperature and the inverse radius. Our results suggest that a linear relation is observed only if the surface area to molten volume ratio scales with . This is of course the case for free standing spherical particles. However, for particles deposited on a substrate, that might not always be the case. Recently J. Murai et al. murai showed that the contact angle of Sn and Bi particles, supported by a substrate, is size dependent for nm. This indicates a more complicated surface area to molten volume ratio.
We close the discussion by commenting on the extracted value of the solid-liquid interface energy mJ/m2 of aluminium. Previous experiments on aluminium particles deposited on a substrate suggested values of that is a factor of two larger. Turnbull (1950); Falkenhagen and Hoffman (1957); Lai et al. (1998) These values should, however, be compared cautiously because (i) different models have been used and (ii) the shape of metal particles on a substrate may not be perfectly spherical due to the presence of the substrate i.e. the exact surface area to molten volume ratio is typically not specified. Finally, (iii) we stress that in our model we assumed that . However, if we instead assume , i.e. , the model would capture the data equally well albeit mJ/m2. The exact value of therefore rely strongly on the relatively unknown interface energies of the carbon coat.
V Conclusion
In summary, we have reported on the melting of aluminium when confined to nano-sized needles. The melting initiates at the needle tip and an equilibrium solid-liquid interface could be followed as the melting front moves towards the thicker part of the needle with increasing temperatures. The solid-liquid interface has a spherical topology i.e. the interface forms a spherical cap. For a needle with fixed apex angle the melting is found to be proportional to the inverse radius of the spherical cap. However, by varying the apex angle we showed that the proportionality constant depends on the ratio between the solid-liquid interface area and the molten volume. This lead us to conclude that the finite size melting of aluminium is controlled merely by the surface area to molten volume ratio rather than the actual local size of the system.
VI Acknowledgments
This work was financially supported by the Japan Society for the Promotion of Science under Grants-in-Aid for Scientific Research CA (Contact N∘ 14205092), and the Danish Natural Science Research Council. J. C. would like to thank the Association of International Education Japan (AIEJ), Julie Marie Vinter Hansens Fond, Nordea Danmark Fond, Julie Damms Fond and Vordingborg Gynmasium’s fond for financial support during this work.
References
- (1) Philip Moriarty, Rep. Prog. Phys. 64, 297 (2001)
- (2) Francesca Baletto and Riccardo Ferrando, Rev. Mod. Phys. 77, 371 (2005)
- Takagi (1954) M. Takagi, J. Phys. Soc. Jpn. 9, 359 (1954).
- Buffat and Borel (1976) P. Buffat and J. Borel, Phys. Rev. A 13, 2287 (1976).
- Berman and Curzon (1974) R.P. Berman and A.E. Curzon, Can. J. Phys. 52, 923 (1974).
- (6) G.L. Allen, R.A. Bayles, W.W. Gile, and W.A. Jesser, Thin Solid Films 144, 297 (1986).
- Peters et al. (1998) K.F. Peters, J.B. Cohen, and Yip-Wah Chung, Phys. Rev. B 57, 13430 (1998).
- Peters et al. (1997) K.F. Peters, Y.-W. Chung, and J.B. Cohen, Appl. Phys. Lett. 71, 2391 (1997).
- Dippel et al. (2001) M. Dippel, A. Maier, V. Gimple, H. Wider, W.E. Evenson, R.L. Rasera, and G. Schatz, Phys. Rev. Lett. 87, 95505 (2001).
- Lai et al. (1996) S.L. Lai, J.Y. Guo, V. Petrova, G. Ramanath, and L.H. Allen, Phys. Rev. Lett. 77, 99 (1996).
- Lai et al. (1998) S.L. Lai, J. Carlson, and L.H. Allen, Appl. Phys. Lett. 72, 1098 (1998).
- Zhang et al. (2000) M. Zhang, M.Y. Efremov, F. Schiettekatte, E.A. Olson, A.T. Kwan, S.L. Lai, T. Wisleder, J.E. Greene,and L.H. Allen, Phys. Rev. B 62, 10548 (2000).
- Breaux et al. (2005) G.A. Breaux, C.M. Neal, B Cao, and M.F. Jarrold, Phys. Rev. Lett. 94, 173401 (2005).
- Saka et al. (1988) H. Saka, Y. Nishikawa, and T. Imura, Phil. Mag. A 57, 895 (1988).
- Gråbaek et al. (1990) L. Gråbaek, J. Bohr, E. Johnson, A. Johansen, L. Sarholt-Kristensen, and H.H. Andersen, Phys. Rev. Lett. 64, 934 (1990).
- Zhang and Cantor (1991) D. Zhang and B. Cantor, Acta Metall. Mater. 39, 1595 (1991).
- Ohashi et al. (1992) T. Ohashi, K. Kuroda, and H. Saka, Phil. Mag. B 65, 1041 (1992).
- Unruh et al. (1993) K.M. Unruh, T.E. Huber, and C.A Huber, Phys. Rev. B 48, 9021 (1993).
- (19) Q.S. Mei and K. Lu, Progress in materials science 52, 1175 (2007).
- Nanda (1998) K.K. Nanda, Eur. J. Phys. 19, 471 (1998).
- (21) P. Pawlow, Z. Phys. Chem. 65, 545 (1909)
- (22) K.-J. Hanszen, Z. Phys. 157, 523 (1960)
- Chang and Johnson (2005) J. Chang and E. Johnson, Phil. Mag. 85, 3617 (2005).
- Sun et al. (2002) Chang Q. Sun, Y. Wang, B.K. Tay, S. Li, H. Huang, and Y.B. Zhang, J. Phys. Chem. B 106, 10701 (2002).
- (25) Chang Q. Sun, Progress in solid state chemistry 35, 1-159 (2007).
- (26) F. Delugo, J. Mater. Sci. 43, 2611 (2008)
- Kofman et al. (1993) R. Kofman, P. Cheyssac, A. Aouaj, Y. Lereah, G. Deutsher, T. Ben-David, J.M. Penisson, and A. Bourret, Surf. Sci. 303, 231 (1993).
- Kofman et al. (1999) R. Kofman, P. Cheyssac, Y. Lereah, and A. Stella, Eur. Phys. J. D 9, 441 (1999).
- (29) R. Lipowsky, Phys. Rev. Lett. 49, 1575 (1982)
- (30) B. Pluis, A.W.D. Van der Gon, J.F. Van der Veen, and A.J. Riemersma, Surface Science 239, 282 (1990)
- Kawasaki et al. (1999) M. Kawasaki, T. Yoshioka, and M. Shiojiri, J. of Electron Microscopy 48, 131 (1999).
- Chang et al. (2005) J. Chang, T. Sakai, and H. Saka, Phil. Mag. Lett. 85, 247 (2005).
- Kato et al. (2000) T. Kato, K. Nunome, Y. Morimoto, K. Nishimura, and H. Saka, Phil. Mag. Lett. 80, 187 (2000).
- Senda et al. (2004) Y. Senda, K. Sasaki, and H. Saka, Phil. Mag. 84, 2635 (2004).
- (35) J. Murai et al., J. Mater. Sci. 41, 2723 (2006).
- Lide (1997-1998) D. R. Lide, ed., Handbook of Chemistry and Physics (CRC Press, Boca Raton, New York, 1997-1998), 78th ed.
- Turnbull (1950) D. Turnbull, J. Chem. Phys. 18, 768 (1950).
- Falkenhagen and Hoffman (1957) G. Falkenhagen and W. Hoffman, Z. Metallkd. 43, 69 (1957).