The clustering of barred galaxies in the local Universe
Abstract
We study the clustering properties of barred galaxies using data from the Sloan Digital Sky Survey (SDSS). We compute projected redshift-space two-point cross-correlation functions for a sample of nearly 1000 galaxies for which we have performed detailed structural decompositions using the methods described in Gadotti (2009). The sample includes 286 barred galaxies. The clustering of barred and unbarred galaxies of similar stellar mass is indistinguishable over all the scales probed (20 kpc–30 Mpc). This result also holds even if the sample is restricted to bars with bluer colours (and hence younger ages). Our result also does not change if we split our sample of barred galaxies according to bar-to-total luminosity ratio, bar boxyness, effective surface brightness, length, or the shape of the surface density profile within the bar. There is a hint that red, elliptical bars are more strongly clustered than red and less elliptical bars, on scales Mpc, although the statistical significance is not high. We conclude that there is no significant evidence that bars are a product of mergers or interactions. We tentatively interpret the stronger clustering of the more elliptical bars as evidence that they are located in older galaxies, which reside in more massive haloes.
keywords:
galaxies: clustering - galaxies: distances and redshifts - large-scale structure of Universe - cosmology: theory - dark matter1 Introduction
It has long been known that stellar bars are very common in spiral galaxies. In the local Universe, about of disc galaxies have strong bars; this fraction increases to if weak bars are included (e.g. de Vaucouleurs 1963; Knapen et al. 2000; Marinova & Jogee 2007). The bar is believed to play an important role in triggering the secular evolution of the galaxy (see e.g. Sellwood & Wilkinson 1993; Kormendy & Kennicutt 2004 for a review) and regulating star formation (e.g. Wang et al. 2006).
The redshift evolution of the bar fraction is still somewhat controversial. Several early studies of the bar fraction at in the Hubble Deep Fields (HDFs) found a dramatic paucity of barred galaxies (Abraham et al., 1996, 1999; van den Bergh et al., 1996), although this result has been disputed by others (Sheth et al. 2003; Elmegreen et al. 2004; Jogee et al. 2004; Zheng et al. 2005). An analysis by Sheth et al. (2008), which used a much larger sample, concludes that the bar fraction indeed decreases with redshift, with the effect being stronger for low-mass galaxies.
Two mechanisms are thought to contribute to the formation of bars. Bars can form through the mode global instability in cold, rotationally supported discs. This has been demonstrated by numerous numerical simulations (e.g. Hohl 1971; Ostriker & Peebles 1973; Sellwood 1981; Athanassoula & Sellwood 1986). The other formation mechanism is through tidal perturbations by neighbouring galaxies. This has also been demonstrated using numerical simulations (Byrd et al. 1986; Noguchi 1987a, 1988, 1996; Gerin et al. 1990a; Miwa & Noguchi 1998). The effects induced by merging galaxies are quite complex. Simulations of the secular evolution of disc galaxies by Debattista et al. (2006) showed that interactions can speed up bar formation in direct encounters, but have little effect in retrograde ones (Toomre & Toomre, 1972; Noguchi, 1987b; Gerin et al., 1990b; Steinmetz & Navarro, 2002; Aguerri & González-García, 2009). Furthermore, it is possible for mergers to destroy or severely weaken the bar, without destroying the disk (Berentzen et al., 2003). It is thus not entirely clear what the combined effect of interactions and mergers is. Observationally, examples of tidally triggered bars are known (e.g. Debattista et al., 2002; Peirani et al., 2009). In addition, Elmegreen et al. (1990) found an excess of binary companions in barred galaxies.
There is little doubt that both internally-driven and externally-driven mechanisms can trigger the formation of bars. We would like to determine empirically the relative importance of the two mechanisms, and also investigate whether we can differentiate bars formed through these two mechanisms. Miwa & Noguchi (1998) studied the difference between tidally induced bars and those induced by internal processes, and concluded that the tidal effects produce slowly rotating bars while those arising from internal processes rotate much faster. Clearly these theoretical predictions need to be tested observationally.
In this paper, we select carefully a sample of nearby () face-on galaxies from the Sloan Digital Sky Survey (SDSS; York et al., 2000), determine their structural properties with sophisticated imaging fitting, and perform cross-correlation of barred galaxies with other galaxies in order to assess the importance of tidal interactions for the bar formation. The outline of the paper is as follows. In §2, we describe how our barred galaxies are selected and how their properties are measured. In §3 we present the method of our cross-correlation analysis. The main results are presented in §4. In §5 we briefly summarise our results and discuss their implications. Throughout this paper, we use a cosmology with a density parameter of , and cosmological constant and the Hubble constant is written as .
2 Data
The sample used for the classification of galaxies into barred and unbarred subclasses was drawn from a volume-limited sample in SDSS data release 2 (DR2; Abazajian et al., 2004), with . To ease the identification of bars, the sample is restricted to galaxies very close to a face-on projection, i.e. with an axial ratio , where and are, respectively, the semi-major and semi-minor axes of the galaxy. We excluded all galaxies with stellar masses below , since dwarf galaxies are not object of our study. Galaxy stellar masses were obtained from Kauffmann et al. (2003). These criteria resulted in a sample of 3375 objects. The images of each of these galaxies were individually inspected to remove from the sample galaxies which are either not truly face-on, morphologically disturbed, too faint or irregular, too close to the border of the CCD frame, as well as duplicate entries and images where the presence of a bright star hinders the decomposition. We also rejected galaxies with apparent size smaller than 20 pixels across ( 8 arcsec), deemed too small for parametric image decomposition. The resulting sample contains 930 galaxies. We have verified that this sample is a fair representation of the galaxy population in this mass range in the local Universe (see Gadotti, 2009).
To verify whether a galaxy is barred, we inspected the galaxy image, isophotal contours and a pixel-by-pixel radial intensity profile. We looked for typical bar signatures, i.e. an elongated structure with constant position angle and a flat ledge in the profile (see e.g. Gadotti et al., 2007). It should be noted that due to the limited spatial resolution of SDSS images, we miss most bars with semi-major axis shorter than kpc, which are found mainly in very late-type spirals (later than Sc – Elmegreen & Elmegreen 1985). These faint bars lie typically within seeing elements and do not produce clear signatures. The results presented here thus pertain to the typical, bonafide bars seen in early-type spirals and lenticulars. For each bar in our sample, we have measured a variety of properties through parametric image fitting. These include absolute magnitudes in , and bands, optical colours defined by the three bands, effective surface brightness, effective radius, Sersic index, ellipticity, semi-major axis, boxyness, and bar-to-total luminosity ratio. Details can be found in Gadotti (2009).
In this paper we classify all the galaxies into three types according to their bulge-to-total luminosity ratio and bar-to-total luminosity ratio . A galaxy is elliptical if ; otherwise it is a spiral galaxy. In the latter case, the galaxy is further classified as either barred if or unbarred if . This results in 255 ellipticals, 389 unbarred and 286 barred spirals. We will use the last two samples when comparing barred and un-barred galaxies, and will use the barred sample on its own for investigating whether bar properties are sensitive to the environments of their host galaxies.
3 Methods
We probe the clustering properties of our galaxies using the projected redshift-space two-point cross-correlation function (2PCCF), . We calculate the cross-correlation between the sample of galaxies for which we have detailed structural information from image decompositions and a reference sample of galaxies selected from the Main spectroscopic sample of the fourth data release (DR4; Adelman-McCarthy et al., 2006) of the SDSS. A random sample is constructed so as to have the same selection effects as the reference sample. The reference and random samples are cross-correlated with the same set of galaxies in our sample, and as a function of the projected separation is defined by the ratio of the two pair counts minus one. Details about our methodology for computing the correlation functions and for constructing the reference and random samples can be found in Li et al. (2006). For consistency, we restrict our reference galaxies to the same redshift range as our sample with structural information, that is, .
The amplitude of 2PCCF on scales larger than a few Mpc provides a direct measure of the mass of the dark matter haloes that host the galaxies through the halo mass-bias relation. As shown in Li et al. (2008a, b), the amplitude of the correlation function on scales kpc can serve as a probe of physical processes such as mergers and interactions. On intermediate scales, the correlation probes the so-called “1-halo” term where the pair counts are dominated by galaxy pairs in the same halo.
4 Results
4.1 Comparison between barred and unbarred galaxies
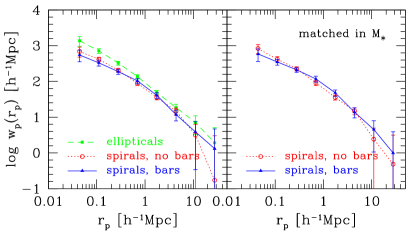

In the left-hand panel of Fig. 1, we compare projected redshift-space 2PCCF for our samples of ellipticals, and spirals with and without bars. Results for the three samples are plotted as squares, triangles and circles, respectively, connected by the dashed, solid and dotted lines. This panel shows that elliptical galaxies are more strongly clustered than the other two types of galaxies, which is not surprising. This panel also shows that barred and unbarred spirals cluster in the same way. The right-hand panel shows the results for the two spiral samples again, but now the samples are closely matched in stellar mass . Because clustering is known to depend on it is important to control for this effect when investigating the dependence on other galaxy properties. There are still no significant differences between the two samples.
We tentatively conclude that the presence of a bar is not related to galaxy environment. In order to test whether the same conclusion holds for bars that have formed more recently, we thus split the barred spirals into two equal-size subsamples according to the colour of the bar. Gadotti & de Souza (2006, and references therein) suggest that bar colour can be used as a proxy for its dynamical age (but see Pérez, Sánchez-Blázquez, & Zurita, 2009). The results are shown in Fig. 2, where we compare for galaxies with red (left panel) or blue (right panel) bars, together with the result for unbarred spirals. In each panel, the two samples are matched in stellar mass. We conclude that the colour of the bar has no effect on our main result.

We would also like to test whether our result is independent of the morphological type of the galaxy. For instance, Giuricin et al. (1993) found that the spirals in high density environments tend to be barred only if they are early-type. We have split the barred sample by and by , and the results are shown in Fig. 3. We have also checked the results for our subsamples of red and blue bars. In any case we see no dependence in clustering. We thus conclude that environment has no influence on whether or not bars are present in galaxies.
4.2 Dependence on bar properties

In this section we focus on the barred galaxies and study the dependence of clustering on the properties of the bars. As in the previous section, we split the galaxies into two subsamples at the median value of the given property. We also trim the two samples so that they each have the same distribution in stellar mass.
The results are shown in Fig. 4, where we plot in each panel the ratio of the measurement of for barred galaxies with higher and lower values of the given bar property. The left-hand panels show results for all the bars in our sample, while the following two panels are for red and blue bars. The bar properties we consider are (from top to bottom) bar-to-total luminosity ratio, ellipticity, boxyness, effective surface brightness, length of the semi-major axis, and Sersic index (see § 2 for detailed description on these quantities).
From Figure 4 we see some indications of dependence of bar properties on clustering, however, they are not very significant due to the large errors in the measurements resulting from small sample sizes. These include the bar ellipticity, bar-to-total luminosity ratio, and Sersic index for red bars.
Interestingly there is a hint of bar ellipticity dependence on clustering. For the sample as a whole, the difference in clustering occurs on scales greater than . High-ellipticity bars are more strongly clustered than low-ellipticity bars on large scales. When the bars are divided into red and blue subsamples, the (weak) effect persists for the red bars but largely vanishes for the blue bars.
One possible explanation for these trends (if confirmed with larger samples) is that more elliptical bars occur in older, more evolved galaxies. The age of a galaxy of fixed stellar mass will be larger in more massive haloes than less massive ones, so one would expect to see clustering differences of the kind that we observe. The dependence of bar ellipticity on age is predicted both from N-body simulations and analytical work (see for example Athanassoula & Misiriotis, 2002; Athanassoula, 2003). It would be interesting to examine the ellipticity dependence on clustering with larger samples in the future.
4.3 Dependence on local environment

The power of the statistic is that it encapsulates information about how galaxy properties depend on environment over a wide range of physical scales, including both the regime of galaxy-galaxy interactions at scales below 100 kpc and the regime of local environment at larger scales. There have also been a number of studies directly examining the correlations between the fractions and properties of bars in galaxies and their local environment (e.g. Aguerri, Méndez-Abreu, & Corsini, 2009). The local environment is usually expressed in terms of overdensities in galaxy number that are estimated in a fixed sphere/aperture centred on the galaxies being studied. The radius of the sphere/aperture is chosen to be less than a few Mpc so as to probe the physical processes occurring inside dark matter haloes.
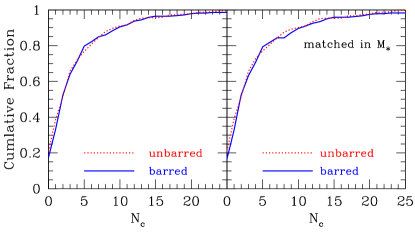
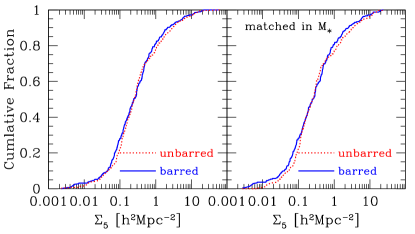
In order to make comparisons with such studies as well as to understand the real environments of our galaxies, we have calculated local density using two different quantities that have been commonly adopted in previous studies. We first follow Kauffmann et al. (2004) and compute the number of galaxies in the reference sample within 2 in projected radius and km s-1 in velocity difference from the galaxy being studied. We also follow Balogh et al. 2004 (see also Aguerri, Méndez-Abreu, & Corsini 2009) and estimate a projected local density of each galaxy in our sample using the projected distance to its fifth nearest neighbour galaxy within km s-1. For both quantities we only consider neighbouring galaxies that are brighter than and not closer than 50 kpc. The bright limit gives us a uniform density estimate that is applicable to our magnitude-limited sample over the full redshift range probed. The lower limit for projected distance is chosen such that the galaxy itself is not included in the density estimate and, more importantly, the density estimate is not biased by SDSS fibre collisions. It is important to note that, for these density calculations, we have constructed a new reference sample using the SDSS data release 7 (DR7; Abazajian & Sloan Digital Sky Survey, 2008) which covers much larger area on the sky than do our samples of barred/unbarred galaxies. By this way we have avoided for most of our galaxies the potential bias in the estimated densities due to edges and holes in the survey.
Figure 5 shows the cumulative fraction of barred and unbarred galaxies in our sample as a function of (upper panels) and (lower panels). Results are shown in the left-hand panels for the original samples, and in the right-hand panels after the two samples have been matched in stellar mass. Overall, only 20 per cent of our galaxies have no neighbours and around half have two or more neighbours. These numbers are in good agreement with those quoted in Kauffmann et al. (2004) (see their Fig. 1). Our estimates of also agree well with that of Aguerri, Méndez-Abreu, & Corsini (2009) (see their Fig. 10). Around 80 per cent of the galaxies are located in underdense regions with Mpc-2. The median value of is 0.24 for the galaxies as a whole.
Figure 5 shows that there is no significant correlation between the presence of a bar in the galaxies and their local densities. This is true no matter how the density is quantified and whether or not the two comparison samples are matched in stellar mass. Our results again are well consistent with Aguerri, Méndez-Abreu, & Corsini (2009), although they have treated the edge effect in a more careful way. After excluding galaxies at less than 7 Mpc from the nearest edge of SDSS, the authors still did not find any difference between the environment of barred and unbarred galaxies.
In Figure 6 we compare the projected 2PCCF for barred and unbarred samples, matched in stellar mass but with different local densities. For this we divide all the galaxies into two subsamples according to whether they are located in regions with higher or lower than 0.24 Mpc-2, the median value of the whole sample. For each subsample, we then compute for the barred and unbarred galaxies separately. Again we have trimmed the barred and unbarred samples so that they show similar stellar mass distributions. As can be seen from the figure there is still no difference between the clustering of barred and unbarred galaxies on all scales where we have measurements.
In the last two columns in Figure 4 we show the results for bars with different properties, but for those located in high and low densities separately. There is no significant effect anywhere.
5 Summary and Discussion
We have used a sample of nearly 1000 galaxies (including 255 ellipticals, 389 unbarred and 286 barred spirals) from the Sloan Digital Sky Survey (SDSS) with well-determined structural parameters to study the clustering properties of galaxies with bars in the low-redshift Universe. For the first time this is quantified by the projected redshift-space two-point correlation function , which is computed over a range of scales from kpc to a Mpc. In practice, we cross-correlate the sample of galaxies with well-determined structural parameters with a large reference sample of galaxies drawn from full DR4 spectroscopic sample. The statistical errors on our results are acceptable due to the large size of the reference sample.
The measurement of on all scales does not depend on the presence or absence of a bar. This is true when the bars are divided into subsamples according to their optical colours, a crude indicator of mean stellar age and possibly bar dynamical age, or when the host galaxies are divided according to stellar mass or bulge-to-total luminosity ratio. We have also examined the dependence of clustering on the properties of bars. These include the bar-to-total luminosity ratio, bar morphology measured by ellipticity and boxyness, and the surface brightness profile characterised by the effective surface brightness, length and Sersic index. In addition, we checked the clustering dependence on global galaxy properties such as size and mean stellar surface density. We find a stronger hint that the clustering depends only on ellipticity. Bars with high ellipticities appear to be more strongly clustered than those with low ellipticities on scales between 1 and 10 Mpc, and this is true only for red bars.
On scales larger than a few Mpc, the amplitude of directly measures the mass of the dark matter haloes that host the galaxies (e.g. Jing et al., 1998). Our results thus suggest that the formation and evolution of bars are independent of the mass of dark matter haloes in which their host galaxies are found. The amplitude of on scales kpc probes physical processes such as mergers and interactions (e.g. Li et al., 2008a, b). Thus our results also suggest that the formation of bars is not dominated by external processes such as interactions with close companions.
Our results provide support that bars in the local Universe may be predominantly produced by global gravitational instability (Toomre 1981; Sellwood & Wilkinson 1993). Numerical simulations indicate that bars can form spontaneously in galactic discs, usually on relatively short timescales. There is a hint of environmental effects on bar properties, for example the ellipticity of red bars which may be a consequence of the fact that bar ellipticity tends to increase with the age of the galaxy.
We now list a number of important caveats. First, our sample of bars, while larger than most previous studies, is still relatively small and the errors on our correlation function measurements are larger than we would like. Our sample is also biased towards strong (thus possibly old) bars and high-luminosity galaxies, and so our conclusions must also be limited to these galaxies. The blue bars in our sample, which are presumably “young” (Gadotti & de Souza, 2005, 2006), may be already old enough and we might have missed the connection with close companions due to this bias. Finally, galaxies associated with ongoing major mergers were excluded from our (visually selected) sample and so our measurements are probably biased low at very small separations. The effect of this can be seen from the small scale correlation functions. In all of our figures, we don’t have measurements at below 40 kpc, indicating that we have been only able to probe galaxy-galaxy interactions with projected separations larger than this scale and have lost all closer systems.
Our results are consistent with van den Bergh (2002) who used the Palomar Sky Survey to classify 930 galaxies into field, group and cluster environments, and found that , , and of galaxies were barred (i.e. there was no significant trend with environment). Our results are also consistent with Aguerri, Méndez-Abreu, & Corsini (2009) who examined the relationship between bar properties and local galaxy density using 2106 disc galaxies from the SDSS and also concluded that the properties of bars do not depend on the local environment. Barazza et al. (2009) have recently compared the properties of bars in field and clusters using a sample of 925 galaxies at redshifts –, and found that bars in clusters are slightly longer than that in field galaxies. However, given the different redshift ranges, the small sample sizes, and the different sample selections, this discrepancy should not be overemphasised and needs to be revisited in the future with larger samples.
With the large number of galaxies in the SDSS, a much larger sample of barred galaxies can be constructed using more objective criteria (see e.g. Barazza et al. 2008), including fainter galaxies and weaker bars. When such a sample becomes available, it will be possible to have better statistics and more reliable results. We intend to return to this topic in our future work.
Acknowledgments
We thank Lia Athanassoula for useful discussions and the referee for helpful comments. CL is supported by the Joint Postdoctoral Programme in Astrophysical Cosmology of Max Planck Institute for Astrophysics and Shanghai Astronomical Observatory, by NSFC (10533030, 10633020), by 973 Program (No.2007CB815402) and by the Knowledge Innovation Program of CAS (No.KJCX2-YW-T05). DAG is supported by the Deutsche Forschungsgemeinschaft priority program 1177 (“Witnesses of Cosmic History: Formation and evolution of galaxies, black holes and their environment”), and the Max Planck Society. SM thanks the Humboldt Foundation for travel support and the Max-Planck Institute for Astrophysics for hospitality.
Funding for the SDSS and SDSS-II has been provided by the Alfred P. Sloan Foundation, the Participating Institutions, the National Science Foundation, the U.S. Department of Energy, the National Aeronautics and Space Administration, the Japanese Monbukagakusho, the Max Planck Society, and the Higher Education Funding Council for England. The SDSS Web Site is http://www.sdss.org/.
The SDSS is managed by the Astrophysical Research Consortium for the Participating Institutions. The Participating Institutions are the American Museum of Natural History, Astrophysical Institute Potsdam, University of Basel, University of Cambridge, Case Western Reserve University, University of Chicago, Drexel University, Fermilab, the Institute for Advanced Study, the Japan Participation Group, Johns Hopkins University, the Joint Institute for Nuclear Astrophysics, the Kavli Institute for Particle Astrophysics and Cosmology, the Korean Scientist Group, the Chinese Academy of Sciences (LAMOST), Los Alamos National Laboratory, the Max-Planck-Institute for Astronomy (MPIA), the Max-Planck-Institute for Astrophysics (MPA), New Mexico State University, Ohio State University, University of Pittsburgh, University of Portsmouth, Princeton University, the United States Naval Observatory, and the University of Washington.
References
- Abazajian et al. (2004) Abazajian K., Adelman-McCarthy J. K., Agüeros M. A., Allam S. S., Anderson K., Anderson S. F., Annis J., Bahcall N. A., et al.,, 2004, AJ, 128, 502
- Abazajian & Sloan Digital Sky Survey (2008) Abazajian K., Sloan Digital Sky Survey f. t., 2008, arXiv, arXiv:0812.0649
- Abraham et al. (1999) Abraham R. G., Merrifield M. R., Ellis R. S., Tanvir N. R., Brinchmann J., 1999, MNRAS, 308, 569
- Abraham et al. (1996) Abraham R. G., Tanvir N. R., Santiago B. X., Ellis R. S., Glazebrook K., van den Bergh S., 1996, MNRAS, 279, L47
- Adelman-McCarthy et al. (2006) Adelman-McCarthy J. K., Agüeros M. A., Allam S. S., Anderson K. S. J., Anderson S. F., Annis J., Bahcall N. A., Baldry I. K., et al.,, 2006, ApJS, 162, 38
- Aguerri, Méndez-Abreu, & Corsini (2009) Aguerri J. A. L., Méndez-Abreu J., Corsini E. M., 2009, A&A, 495, 491
- Aguerri & González-García (2009) Aguerri J. A. L., González-García A. C., 2009, A&A, 494, 891
- Athanassoula (2003) Athanassoula E., 2003, MNRAS, 341, 1179
- Athanassoula & Misiriotis (2002) Athanassoula E., Misiriotis A., 2002, MNRAS, 330, 35
- Athanassoula & Sellwood (1986) Athanassoula E., Sellwood J. A., 1986, MNRAS, 221, 213
- Balogh et al. (2004) Balogh M., et al., 2004, MNRAS, 348, 1355
- Barazza et al. (2008) Barazza F. D., Jogee S., Marinova I., 2008, ApJ, 675, 1194
- Barazza et al. (2009) Barazza F. D., et al., 2009, A&A, 497, 713
- Berentzen et al. (2003) Berentzen I., Athanassoula E., Heller C. H., Fricke K. J., 2003, MNRAS, 341, 343
- Byrd et al. (1986) Byrd G. G., Valtonen M. J., Valtaoja L., Sundelius B., 1986, A&A, 166, 75
- de Vaucouleurs (1963) de Vaucouleurs G., 1963, ApJS, 8, 31
- Debattista et al. (2002) Debattista V. P., Corsini E. M., Aguerri J. A. L., 2002, MNRAS, 332, 65
- Debattista et al. (2006) Debattista V. P., Mayer L., Carollo C. M., Moore B., Wadsley J., Quinn T., 2006, ApJ, 645, 209
- Elmegreen & Elmegreen (1985) Elmegreen B. G., Elmegreen D. M., 1985, ApJ, 288, 438
- Elmegreen et al. (2004) Elmegreen B. G., Elmegreen D. M., Hirst A. C., 2004, ApJ, 612, 191
- Elmegreen et al. (1990) Elmegreen D. M., Elmegreen B. G., Bellin A. D., 1990, ApJ, 364, 415
- Gadotti et al. (2007) Gadotti D. A., Athanassoula E., Carrasco L., Bosma A., de Souza R. E., Recillas E., 2007, MNRAS, 381, 943
- Gadotti & de Souza (2005) Gadotti D. A., de Souza R. E., 2005, ApJ, 629, 797
- Gadotti & de Souza (2006) —, 2006, ApJS, 163, 270
- Gadotti (2009) Gadotti D. A., 2009, MNRAS, 393, 1531
- Gerin et al. (1990a) Gerin M., Combes F., Athanassoula E., 1990a, A&A, 230, 37
- Gerin et al. (1990b) —, 1990b, A&A, 230, 37
- Giuricin et al. (1993) Giuricin G., Mardirossian F., Mezzetti M., Monaco P., 1993, ApJ, 407, 22
- Hohl (1971) Hohl F., 1971, ApJ, 168, 343
- Jing et al. (1998) Jing Y. P., Mo H. J., Boerner G., 1998, ApJ, 494, 1
- Jogee et al. (2004) Jogee S., Barazza F. D., Rix H.-W., Shlosman I., Barden M., Wolf C., Davies J., Heyer I., et al.,, 2004, ApJL, 615, L105
- Kauffmann et al. (2003) Kauffmann G., Heckman T. M., White S. D. M., Charlot S., Tremonti C., Brinchmann J., Bruzual G., Peng E. W., Seibert M., Bernardi M., Blanton M., Brinkmann J., Castander F., Csábai I., Fukugita M., Ivezic Z., Munn J. A., Nichol R. C., Padmanabhan N., Thakar A. R., Weinberg D. H., York D., 2003, MNRAS, 341, 33
- Kauffmann et al. (2004) Kauffmann G., White S. D. M., Heckman T. M., Ménard B., Brinchmann J., Charlot S., Tremonti C., Brinkmann J., 2004, MNRAS, 353, 713
- Knapen et al. (2000) Knapen J. H., Shlosman I., Peletier R. F., 2000, ApJ, 529, 93
- Kormendy & Kennicutt (2004) Kormendy J., Kennicutt Jr. R. C., 2004, ARA&A, 42, 603
- Li et al. (2008a) Li C., Kauffmann G., Heckman T. M., Jing Y. P., White S. D. M., 2008a, MNRAS, 385, 1903
- Li et al. (2008b) Li C., Kauffmann G., Heckman T. M., White S. D. M., Jing Y. P., 2008b, MNRAS, 385, 1915
- Li et al. (2006) Li C., Kauffmann G., Wang L., White S. D. M., Heckman T. M., Jing Y. P., 2006, MNRAS, 373, 457
- Marinova & Jogee (2007) Marinova I., Jogee S., 2007, ApJ, 659, 1176
- Miwa & Noguchi (1998) Miwa T., Noguchi M., 1998, ApJ, 499, 149
- Noguchi (1987a) Noguchi M., 1987a, MNRAS, 228, 635
- Noguchi (1987b) —, 1987b, MNRAS, 228, 635
- Noguchi (1988) —, 1988, A&A, 203, 259
- Noguchi (1996) —, 1996, ApJ, 469, 605
- Ostriker & Peebles (1973) Ostriker J. P., Peebles P. J. E., 1973, ApJ, 186, 467
- Peirani et al. (2009) Peirani S., Hammer F., Flores H., Yang Y., Athanassoula E., 2009, A&A, 496, 51
- Pérez, Sánchez-Blázquez, & Zurita (2009) Pérez I., Sánchez-Blázquez P., Zurita A., 2009, A&A, 495, 775
- Sellwood (1981) Sellwood J. A., 1981, A&A, 99, 362
- Sellwood & Wilkinson (1993) Sellwood J. A., Wilkinson A., 1993, Reports on Progress in Physics, 56, 173
- Sheth et al. (2008) Sheth K., Elmegreen D. M., Elmegreen B. G., Capak P., Abraham R. G., Athanassoula E., Ellis R. S., Mobasher B., et al.,, 2008, ApJ, 675, 1141
- Sheth et al. (2003) Sheth K., Regan M. W., Scoville N. Z., Strubbe L. E., 2003, ApJL, 592, L13
- Steinmetz & Navarro (2002) Steinmetz M., Navarro J. F., 2002, New Astronomy, 7, 155
- Toomre (1981) Toomre A., 1981, in Structure and Evolution of Normal Galaxies, Fall S. M., Lynden-Bell D., eds., pp. 111–136
- Toomre & Toomre (1972) Toomre A., Toomre J., 1972, ApJ, 178, 623
- van den Bergh (2002) van den Bergh S., 2002, AJ, 124, 782
- van den Bergh et al. (1996) van den Bergh S., Abraham R. G., Ellis R. S., Tanvir N. R., Santiago B. X., Glazebrook K. G., 1996, AJ, 112, 359
- Wang et al. (2006) Wang J. L., Xia X. Y., Mao S., Cao C., Wu H., Deng Z. G., 2006, ApJ, 649, 722
- York et al. (2000) York D. G., Adelman J., Anderson Jr. J. E., Anderson S. F., Annis J., Bahcall N. A., Bakken J. A., Barkhouser R., et al.,, 2000, AJ, 120, 1579
- Zheng et al. (2005) Zheng X. Z., Hammer F., Flores H., Assémat F., Rawat A., 2005, A&A, 435, 507