Dynamic effects on the loss of control in template-directed nucleation
Abstract
Full nucleation control for deposited functional molecules on pre-patterned surfaces is of major technological relevance. To understand the nucleation behavior we combine the numerical solution for the evolution of the adatom concentration with standard nucleation theory. From the qualitative change in nucleation behavior upon variation of the pattern spacing and coverage we show why the quality of nucleation control can vary significantly in different parameter regimes. In some limits analytical expressions can be formulated for the nucleation control. Our analysis provides a theoretical explanation for previous experimental observations [Wang et al, PRL 98, 225504 (2007)].
pacs:
81.65.CfThe controlled fabrication of nano-structures is a technologically highly demanding and interesting topic. In this context techniques based on lithography and etching have become very sophisticated over the past decades. However, with the advent of functional organic molecules in micro-electronics, one faces the problem that this technique is often not applicable to this class of substances. At this point the concept of template-directed growth becomes interesting: in this technique the areas of desired accretion are marked in some fashion to favor the adsorption of the functional substance, which is subsequently deposited. There exists a number of methods to generate these preferred sites; see, e.g., Refs. Bardotti et al. (2002); Preuss et al. (1995); Chou et al. (2002); Hyon et al. (1999); Cortes Rosa et al. (1998); Briseno et al. (2006); Lehnert et al. (2007); Wang et al. (2007).
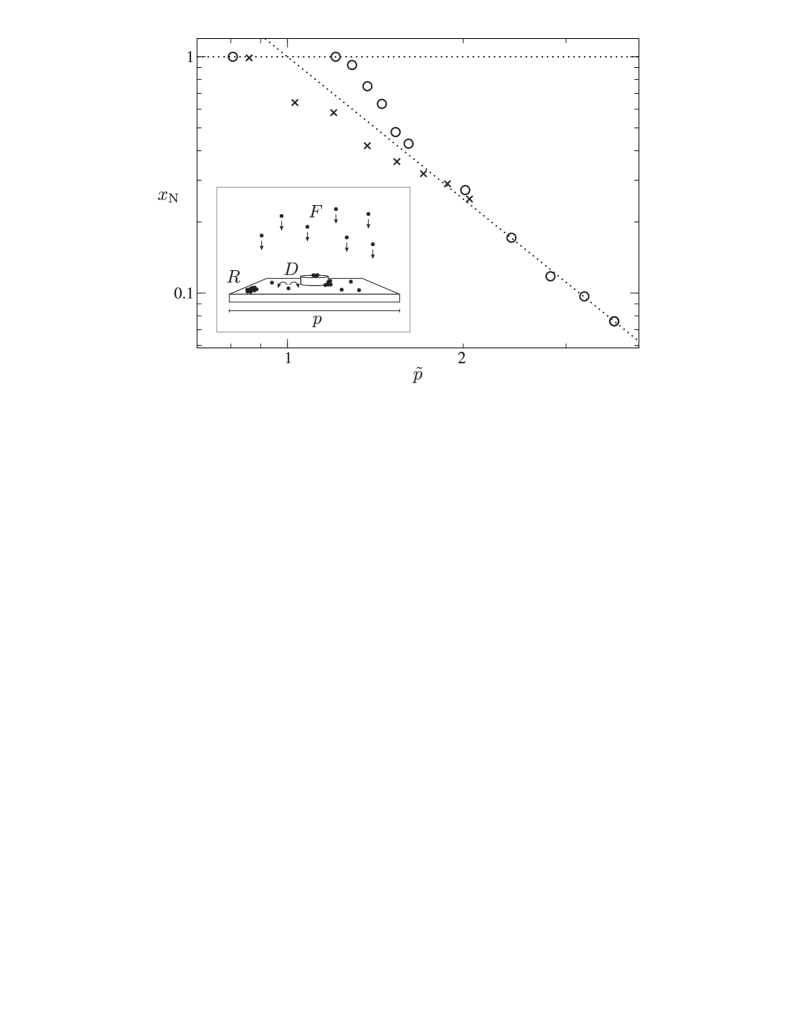
From a technical point of view one is interested in exclusive accretion of the deposited substance at the predefined sites and no additional nucleation. The predefined sites display a regular quadratic arrangement (size of unit-cell: ; see inset of Fig. 1). To provide a quantitative means of evaluation, the nucleation control can be expressed by
| (1) |
with representing the number of additional nucleated clusters per unit-cell. Additionally, to be able to relate theory and experiment the length scales are renormalized by
| (2) |
where represents the overall island density of an unpatterned substrate. For the influence of the predefined sites on the nucleation processes can be neglected so that the nucleation properties just follow the standard nucleation theory; see, e.g.,Venables (1973); Harding et al. (1998); Venables and Harding (2000); Michely and Krug (2004); Evans et al. (2006). In contrast, for dense patterns with all nucleation occurs at the predefined sites () Bardotti et al. (2002); Kalischewski et al. (2008).
The transition regime is of particular interest. First, from an experimental/technological view one needs to understand how far the range of complete nucleation control extends to large pattern sizes. Second, from a theoretical perspective new phenomena come into play as compared to standard nucleation theory because of the interplay of the nucleation tendency and the drainage of the adatoms by the predefined sinks. The complexity of this regime is also highlighted in Fig. 1 where the results of previous computer simulations Wang et al. (2007); Kalischewski et al. (2008) and experiments are displayed Wang et al. (2007). Whereas the simulations display nucleation control in the regime the experiments show a loss of nucleation control at pattern spacings significantly below (i.e. ). What is the interpretation of these differences?
In this paper we present the theoretical basis of nucleation control and in particular reveal the influence of the experimental deposition time scale. For a clear identification of the physical mechanisms we employ a minimum model which considers particle deposition at flux and subsequent surface diffusion with diffusion constant . Adatoms are either included by the predefined sites, acting as perfect sinks, or, if the distance between the sites is too large or is too small, start to form additional nuclei () aside of these locations. Since we are interested in the key mechanisms, we neglect possible desorption processes.
To evaluate the temporal evolution of the nucleation behavior on a pre-patterned substrate a simulation technique similar to the level-set methods of Refs. Ratsch et al. (2002); Gyure et al. (1998); Vardavas et al. (2004); Chen et al. (2001) was applied. This algorithm is far more efficient as compared to the previous atomistic Monte Carlo simulations Wang et al. (2007); Kalischewski et al. (2008). It is based on the numerical solution of the adatom diffusion equation
| (3) |
by discretization in time and space. The generation of new nuclei follows the concepts of standard nucleation theory Venables (1973); Michely and Krug (2004); Evans et al. (2006). The local rate and hence also the chance of nucleation on the grid point at time with the next time step is given by
| (4) |
where represents the number of adatoms in the first stable two-dimensional nucleus and and are parameters which characterize the nucleation probability. The parameters dat were adjusted such that we obtained a typical distance of about 50 grid points between nuclei in the steady state regime of the unpatterned case. For the definition of a length scale in our simulations we have introduced the lengthscale , where describes the distance of two adjacent grid points. Eq. (3) is supplemented by the boundary condition at the positions of nuclei.
Commonly (see e.g. Vardavas et al. (2004); Gyure et al. (1998); Ratsch et al. (2002)), a new nucleus is generated when , defined via exceeds an integer value. However, the deterministic nature of the first nucleation event introduces a bias during a critical phase of this simulation Kalischewski (2008). Thus, we apply the following Monte Carlo like algorithm: at every time step, is spatially integrated and in combination with sufficiently small provides . This chance is then compared to a random number resulting in nucleation for . In a successful event the new nucleus is placed stochastically according to the individual .
A simulation run consists of one quadratic unit-cell of the surface pattern with length as shown in the inset of Fig. 1, using periodic boundary conditions. We have checked that the vs. -plot does not display any finite-size effects. The finite-size effects, reported in literature Schroeder and Wolf (1995), occur in a regime where in the present case . Each data point results from averages over 200 independent simulations. All systems are subject to the same flux and a value of Kalischewski et al. (2008). Similar to Refs. Bartelt and Evans (1996); Bartelt and Evans (1992) we represent the predefined sites as a single grid point on our discretized simulation lattice, acting as a perfect sink. The same holds for newly generated nuclei. In this way a predefined or generated nucleus possesses an effective area . As we are not interested in the temporal evolution of the individual nuclei, but in the averaged properties of the surface, the sinks remain to be confined to their initial position and do not expand any further. Experimentally, the area occupied by an adatom is, of course, much smaller than that of the pattern. Consequently, the ratio is orders of magnitude smaller than unity and the resulting values for the coverage , which are given below in units of , hence correspond to sub-monolayer growth.
For good nucleation control the nucleus density of the pre-patterned surface has to be lower than that of the unpatterned counter part . In what follows we compare the temporal evolution of these densities for several patterned systems of different complemented by an unpatterned reference system; see Fig. 2. The unpatterned system (solid line) possesses the characteristic shape expected from standard nucleation theory Michely and Krug (2004): The beginning shows a transient time regime of rapid nucleation, dominated by local supersaturation. However, as the surface becomes saturated with nuclei, the overall concentration decreases and the system enters the regime of steady state nucleation. Mechanistically, the comparatively slow nucleation rate of this regime can be attributed to statistical fluctuations in the adatom concentration.
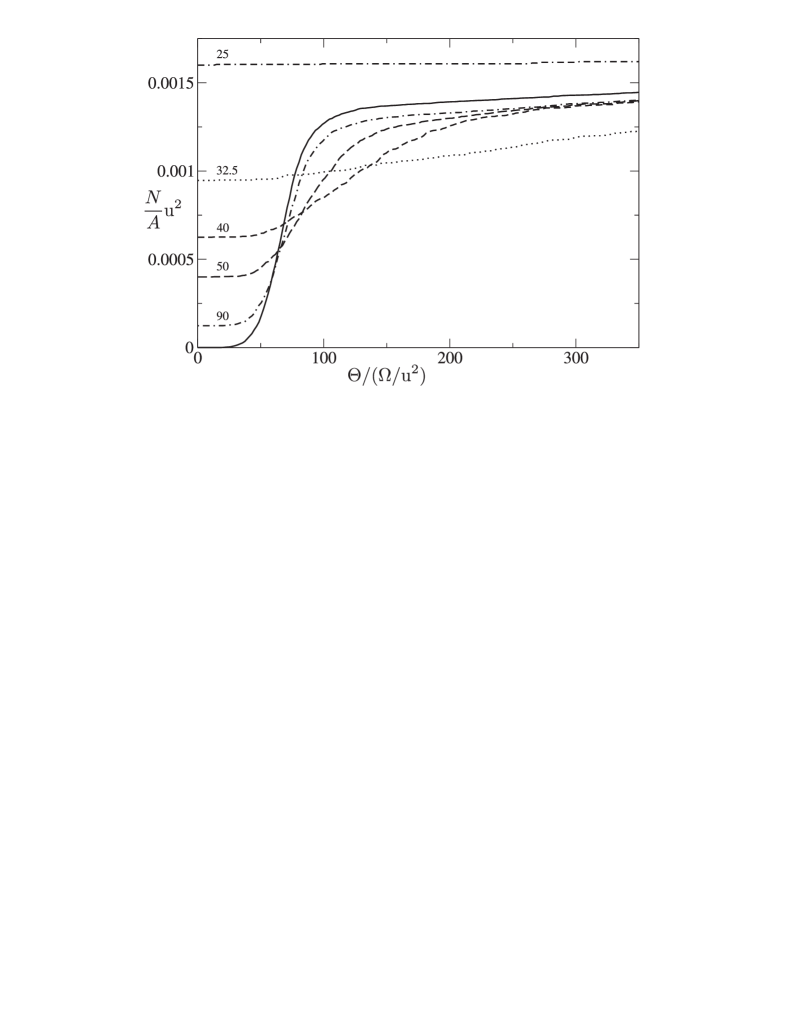
With respect to the patterned surfaces Fig. 2 allows the following observations: (a) For comparably large (see, e.g, ) the behavior of the patterned systems resembles that of the unpatterned counter part, but as by construction there already exists one dot at the beginning of the simulation, (b) the systems start off at a density of . As growth commences, however, the permanent adatom depletion by the pattern leads to an effectively smaller nucleation rate such that (c) the patterned surfaces approach the unpatterned long time behavior from below. (d) Furthermore, as becomes smaller () the s-shaped part of the curve is stretched in time corresponding to a slower transition through the rapid nucleation regime. This effect increases to the point that (e) at sufficiently low pattern spacing, e.g. , the s-shape becomes unrecognizable and remains significantly below within the considered time scale. (f) Finally, can be decreased to the point where becomes so large that the unpatterned long time behavior is approached from above.
Returning to the question of nucleation control, Eq. (1) can, with the help of Eq. (2), be rewritten as
| (5) |
A surface can hence only lie above and show retained nucleation control if . Specifically this means that because of (b) the nucleation control at the beginning of the experiment is always very low, but due to (c) and (d) this changes with increasing time for all patterns up to (f).
The corresponding nucleation control can be found in Fig. 3: at low coverage () the unpatterned surface does not yet show significant nucleation and hence the vast majority of patterned systems exhibits a higher nucleus density, which in turn results in an early loss of nucleation control, indicated by a curve in the lower left segment of the figure. As time increases, however, and the regime of rapid nucleation begins around , the unpatterned nucleation density commences to exceed its patterned counterparts leading to an increasing number of systems under nucleation control and hence to a crossing of the diagonal closer to . As the unpatterned surface reaches the beginning of the steady state nucleation regime, nucleation control becomes most pronounced which can be seen from the curve corresponding to . Past this point the slow convergence of all patterned nucleus densities to that of the unpatterned surface results again in a decrease of nucleation control. All this effects together mean that at fixed one has a non-monotonous dependence of on . Note that upon changing the coverage the onset of nucleation control can vary as much as a factor of two with respect to the critical pattern density (relative to the respective value of ).
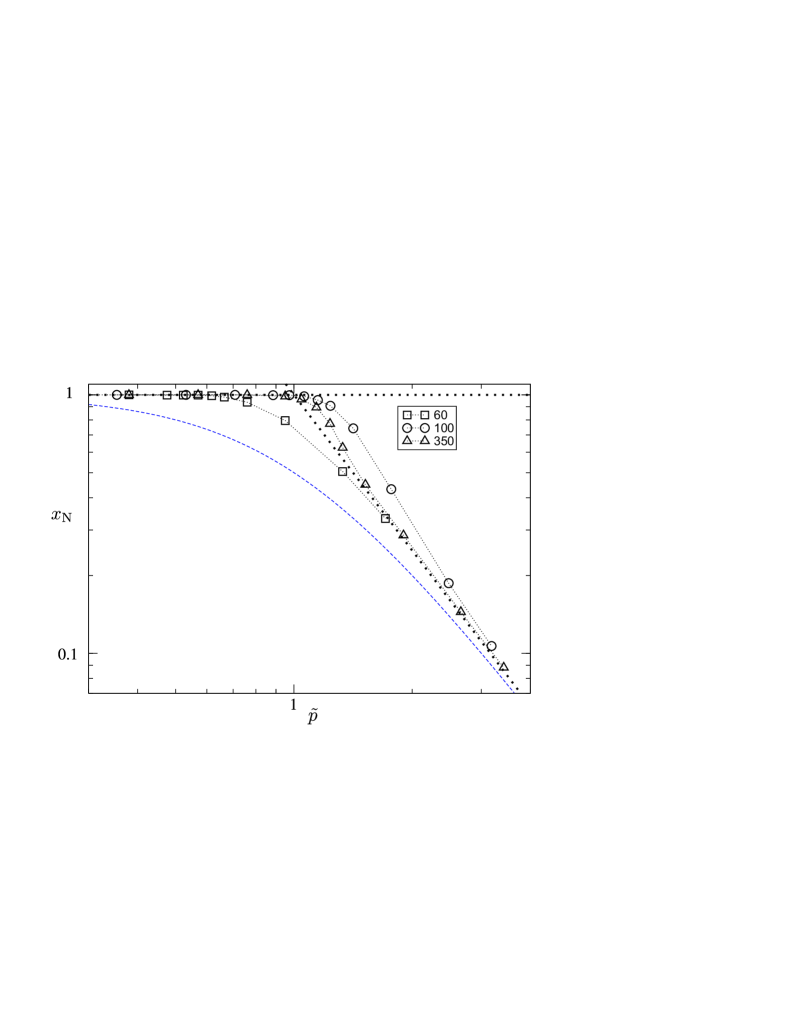
Two limits can be treated more quantitatively. First, in the limit of low coverage and large () the growth of additional nuclei is not influenced by the gold dot. Thus one has , which yields . This limit is included in Fig. 3.
Second, further analysis is possible when the first nucleus is formed from a stationary concentration profile. As shown in Ref. Kalischewski et al. (2008) for fixed parameters one can find a critical time scale such that for the stationary concentration profile is reached. For this condition to be applicable it is important that nucleation can be neglected for times smaller than or, equivalently, at time . The time scale scales like Kalischewski et al. (2008). In this scenario one can derive the relation
| (6) |
where can be calculated from knowledge of the stationary concentration field, which was done numerically in Ref. Kalischewski et al. (2008).
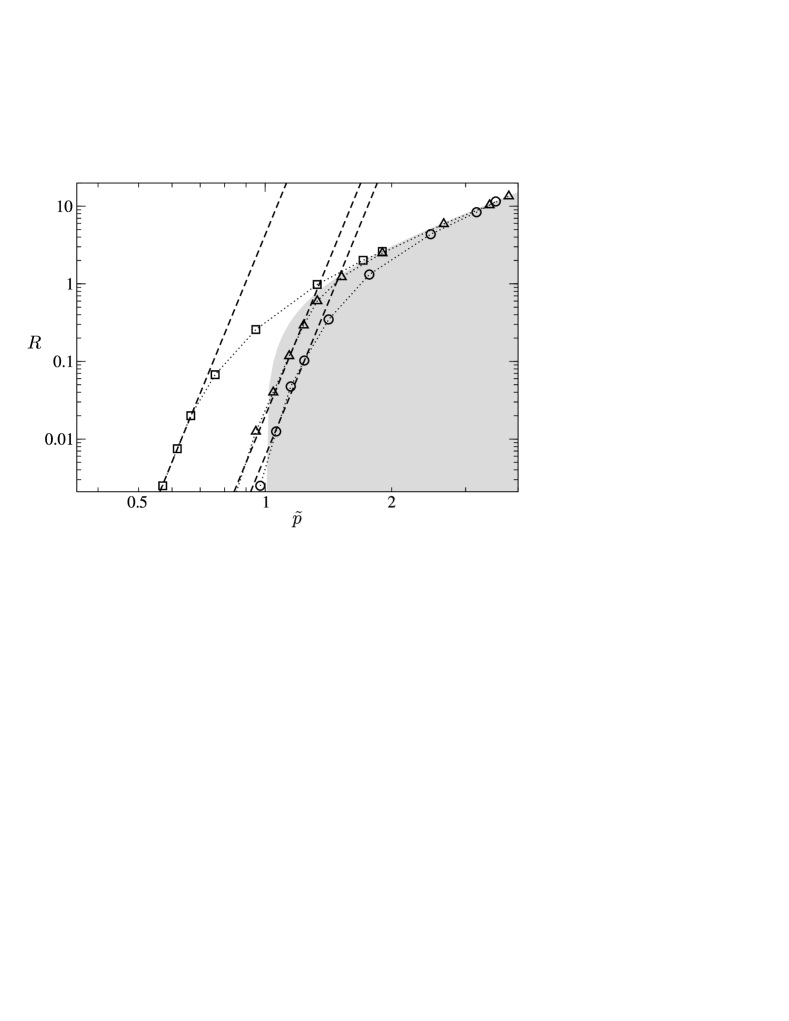
In Figure 4 we have replotted as . In this representation one can clearly see that Eq.6 is recovered for small values of . This is to be expected because for a given time scale of the experiment the stationarity condition is always fulfilled in the limit of small and correspondingly small . Furthermore the linearity with respect to is reflected in the linear increase of for small in Fig. 2. Interestingly, the applicability range of this power law strongly depends on the coverage: while at the relation only holds for values less than , for larger coverage the power law nearly holds up to the theoretical limit of . This can be easily understood from analyzing at the time scale , introduced above. Joining together Eq. (6) and the relation one obtains . Indeed, one observes a dramatic increase of the range of applicability of Eq. (6) upon increasing the coverage. Of course, at the latest the power law scaling has to break down when approaches 1.
Based on these considerations we can conclude the following: the experimentally observed early loss of nucleation control as depicted in Fig. 1 does not disagree with the general understanding of the mechanisms governing template-directed growth, and can be attributed to dynamic effects. In particular, this effect is caused by a different temporal evolution of the nucleus density on the patterned and unpatterned substrates: unpatterned substrates or patterns of very large show a distinct separation between the transient and the steady state regime, which mechanistically corresponds to nucleation by supersaturation or by statistical aggregation, respectively. With decreasing pattern spacing, however, the transient regime becomes dilated until it is phenomenologically as well as mechanistically indiscernible from steady state nucleation. In the commonly used representation, which is normalized by an unpatterned surface, this leads to the effect that initially the majority of patterned systems exhibits an early loss of nucleation control. This changes, however, as the unpatterned surface approaches the end of the transient regime which leads to maximal nucleation control close to the beginning of steady state nucleation. Thus, a consistent picture of the influence of the distance of the patterns as well as the experimental time scale on nucleation control can be formulated. This is of particular relevance for the understanding of the formation of nanostructure on surfaces. Evidently, also more complex situations such as non-circular patterns can be analyzed within the present model approach.
We acknowledge very helpful discussions with L.F. Chi and her group as well as with S. Hopp and T. Mues. F. K. thanks the Fonds der Chemischen Industrie and the NRW Graduate School of Chemistry for financial support.
References
- Bardotti et al. (2002) L. Bardotti, B. Prével, P. Jensen, M. Treilleux, P. Mélinon, A. Perez, J. Gierak, G. Faini, and D. Mailly, Applied Surface Science 191, 205 (2002).
- Preuss et al. (1995) S. Preuss, A. Demchuk, and M. Stuke, Appl. Phys. A 61, 33 (1995).
- Chou et al. (2002) S. Y. Chou, C. Keimel, and J. Gu, Nature 417, 835 (2002).
- Hyon et al. (1999) C. K. Hyon, S. C. Choi, S. W. Hwang, D. Ahn, Y. Kim, and E. K. Kim, Applied Physics Letters 75, 292 (1999).
- Cortes Rosa et al. (1998) J. Cortes Rosa, M. Wendel, H. Lorenz, J. P. Kotthaus, M. Thomas, and H. Kroemer, Appl. Phys. Lett. 73, 2684 (1998).
- Briseno et al. (2006) A. L. Briseno, S. C. B. Mannsfeld, M. M. Ling, S. Liu, R. J. Tseng, C. Reese, M. E. Roberts, Y. Yang, F. Wudl, and Z. Bao, Nature 444, 913 (2006).
- Lehnert et al. (2007) S. Lehnert, P. Sun, Y. Wang, H. Fuchs, and C. A. Mirkin, small 3, 71 (2007).
- Wang et al. (2007) W. C. Wang, D. Y. Zhong, J. Zhu, F. Kalischewski, R. F. Dou, K. Wedeking, Y. Wang, A. Heuer, H. Fuchs, and L. F. Chi, Phys. Rev. Lett. 98, 225504 (2007).
- Venables (1973) J. A. Venables, Phil. Mag. 27, 697 (1973).
- Michely and Krug (2004) T. Michely and J. Krug, Islands, Mounds and Atoms (Springer, 2004).
- Evans et al. (2006) J. W. Evans, P. A. Thiel, and M. C. Bartelt, Surface Science Reports 61, 1 (2006).
- Harding et al. (1998) J. H. Harding, A. M. Stoneham, and J. A. Venables, Phys. Rev. B 57, 6715 (1998).
- Venables and Harding (2000) J. A. Venables and J. H. Harding, J. Non-Cryst. Solids 211, 27 (2000).
- Kalischewski et al. (2008) F. Kalischewski, J. Zhu, and A. Heuer, Phys. Rev. B (2008), accepted.
- Ratsch et al. (2002) C. Ratsch, M. F. Gyure, R. E. Caflisch, F. Gibou, M. Petersen, M. Kang, J. Garcia, and D. D. Vvedensky, Phys. Rev. B 65, 195403 (2002).
- Gyure et al. (1998) M. F. Gyure, C. Ratsch, B. Merriman, R. E. Caflisch, S. Osher, J. J. Zinck, and D. D. Vvedensky, Phys. Rev. E 58, R6927 (1998).
- Vardavas et al. (2004) R. Vardavas, C. Ratsch, and R. E. Caflisch, Surface Science 569, 185 (2004).
- Chen et al. (2001) S. Chen, B. Merriman, M. Kang, R. E. Caflisch, C. Ratsch, L.-T. Cheng, M. Gyure, R. P. Fedkiw, C. Anderson, and S. Osher, J. Comp. Phys. 167, 475 (2001).
- (19) We have used the parameters , and .
- Kalischewski (2008) F. Kalischewski, Ph.D. thesis, Westfälische Wilhelms-Universität Münster (2008).
- Schroeder and Wolf (1995) M. Schroeder and D. E. Wolf, Phys. Rev. Lett. 74, 2062 (1995).
- Bartelt and Evans (1996) M. C. Bartelt and J. W. Evans, Phys. Rev. B 54, R17359 (1996).
- Bartelt and Evans (1992) M. C. Bartelt and J. W. Evans, Phys. Rev. B 46, 12675 (1992).