Temperature dependence of antiferromagnetic susceptibility in ferritin
Abstract
We show that antiferromagnetic susceptibility in ferritin increases with temperature between 4.2 K and 180 K (i. e. below the Néel temperature) when taken as the derivative of the magnetization at high fields ( Oe). This behavior contrasts with the decrease in temperature previously found, where the susceptibility was determined at lower fields ( Oe). At high fields (up to Oe) the temperature dependence of the antiferromagnetic susceptibility in ferritin nanoparticles approaches the normal behavior of bulk antiferromagnets and nanoparticles considering superantiferromagnetism, this latter leading to a better agreement at high field and low temperature. The contrast with the previous results is due to the insufficient field range used ( Oe), not enough to saturate the ferritin uncompensated moment.
pacs:
75.30.Cr, 75.50.Ee, 75.60.Ej, 75.50.TtI Introduction
Antiferromagnetic (AF) nanoparticles have rich magnetic behavior that can be quite different from their bulk counterparts. This behavior is often termed “anomalous” and “unexpected”, and includes enhanced magnetic moment and coercivity,Berkowitz et al. (1999) exchange bias,Makhlouf et al. (1997); Berkowitz et al. (1999) increase of magnetic moment with temperature,Seehra et al. (2000); Silva et al. (2004); Mørup and Frandsen (2004) and decrease of AF susceptibility () with temperature below the order temperature and its enhancement compared to bulk Makhlouf et al. (1997); Seehra et al. (2000); Punnoose et al. (2004); Gilles et al. (2000, 2002). This last issue is the subject of the present report.
The enhancement of below in nanoparticles compared to bulk was predicted by Néel,Néel (1961a) and estimated to decrease with temperature Néel (1961b, 1962). The extra susceptibility () is a finite size effect termed superantiferromagnetism. In a simple picture, superantiferromagnetism arises in particles in which the AF easy axis is perpendicular to the external field, where surface spins rotate more in the field direction than inner ones since they have less neighbors. This corresponds to a progressive rotation of the AF easy axis from surface to surface across the particle, in particles with even number of ferromagnetic spin planes. Néel also highlighted the first difficulty in finding experimental evidence of superantiferromagnetism: the need for magnetic particles with small sizes and controlled size distribution Néel (1962). Other difficulties became apparent later and are related to the fact that AF nanoparticles have an uncompensated magnetic moment superposed to . hinders the determination of based on low field and high field susceptibility measurements. In the case of low field measurements, the difficulty arises since has an important Curie-like contribution that is not straightforward to model, due to the fact that the temperature dependence of is not yet clear Mørup and Frandsen (2004); Silva et al. (2005a); Mørup and Frandsen (2005). In the case of high field measurements, the influence of is more subtle and is related to the non-saturation of the magnetization associated to () at the normally used high fields ( Oe) and temperatures of interest. Again, the absence of a reliable model of the field dependence of , nor even of its approach to saturation, makes the separation between the contribution of and to the total magnetization (and the subsequent determination of ) quite difficult.
Despite all these questions, some steps were made towards the determination of . In a first approach, was modelled with a Langevin law,Kilcoyne and Cywinski (1995); Makhlouf et al. (1997) which enabled the first report on Makhlouf et al. (1997). In Ref.Makhlouf et al. (1997) and in following ones,Seehra et al. (2000); Punnoose et al. (2004) was found to decrease with temperature, and this decrease was associated to superantiferromagnetism Makhlouf et al. (1997). Evidence of superantiferromagnetism based on a description of magnetization taken at 2 K up to Oe was later reported in Ref.Gilles et al. (2002). The model used for was further refined by the use of a distribution and an Ising-like function that takes into account the coupling between and the AF moments Gilles et al. (2000, 2002). Yet, these improvements did not change the observed decrease of . A method for the separation between the and components in the magnetization without the need of a model was also proposed;Silva et al. (2005b) however, this method does not take into account anisotropy effects, which are relevant in antiferromagnetic nanoparticles, as highlighted in Ref.Madsen et al. (2006). It also became clear in Ref. Madsen et al. (2006) that a spurious contribution to arises when modelling without considering anisotropy. This spurious contribution decreases with increasing temperature towards zero as anisotropy energy becomes small compared to and .
Given this scenario, a better insight on depends on measurements of the susceptibility at fields higher than those used up to now. With this aim, we present measurements taken up to different maximum fields and different techniques of measuring magnetization in ferritin, a model system for nanoparticles with AF interactions where many of the above cited studies where performed Makhlouf et al. (1997); Kilcoyne and Cywinski (1995); Gilles et al. (2000, 2002); Silva et al. (2005b). We study the dependence of the derived on the field at which it is considered and we discuss its origin. We compare estimated at the highest measured fields to that estimated from mean field and from mean field considering superantiferromagnetism. We also discuss the absence of a spin-flop transition in ferritin up to Oe in terms of the random local anisotropy model.
II Experimental
Ferritin consists of a hollow spherical shell composed of 24 protein subunits surrounding a ferrihydrite-like core. The diameter of the cavity is of the order of 7-8 nm and average size of the core of horse spleen ferritin is 5 nm Mann (1996). Horse spleen ferritin samples used in these experiments were obtained from Sigma Chemical Company and prepared in powder samples by evaporation of the solvent at room temperature. The iron content (14.25 % in weight) was determined by inductively coupled plasma spectrometry. Ac susceptibility was determined as a function of temperature after cooling in the absence of field, at selected frequencies (33, 476 and 1379 Hz) and a field amplitude of 4 Oe, using a MPMS-XL Quantum Design system. Magnetization was determined as a function of field i) up to Oe at different temperatures using a PPMS system (Quantum Design) with a vibrating sample magnetometer (VSM) option, ii) up to Oe at different temperatures using an extraction magnetometer in a Bitter magnet (HFML facility, Nijmegen), and iii) up to Oe at 4.2 K using pick up coils and a pulsed field (LNCMP facility, Toulouse). Magnetization curves obtained in ii) and iii) were scaled with respect to those obtained in i). Concerning curves obtained in ii), scaling constitutes a small correction () and all analysis and conclusions here presented do not depend on this scaling.
III Results and discussion
III.1 Magnetization and high field susceptibility
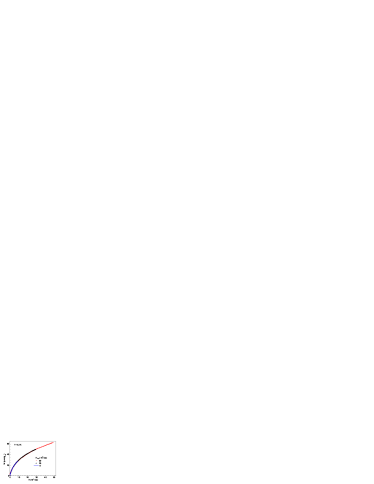
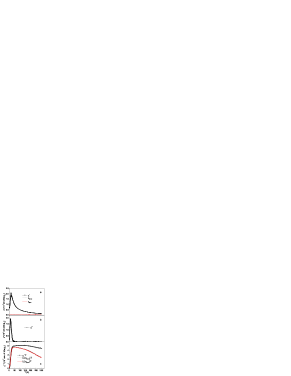
The scaled magnetization curves taken up to , , and Oe at 4.2 K are shown in Fig. 1 (in emu per grams of iron). The magnetization curve and its derivative (see Fig. 3) have no signs of a spin-flop transition. On the contrary, after the initial fast saturation that occurs up to Oe, the magnetization undergoes a slow approach to saturation. Clearly, is not yet saturated (i. e., magnetization is not yet linear with field) at fields of the order of those often used to estimate ( Oe). Both the slow approach to saturation and the absence of a spin-flop are in accordance to the previous high field measurements performed in horse spleen ferritin at low temperature (at 2 K and up to Oe Gilles et al. (2002) and at 1.52 K and up to Oe Guertin et al. (2007)).
The slow approach to saturation is also observed in curves obtained at different temperatures (Fig. 2).
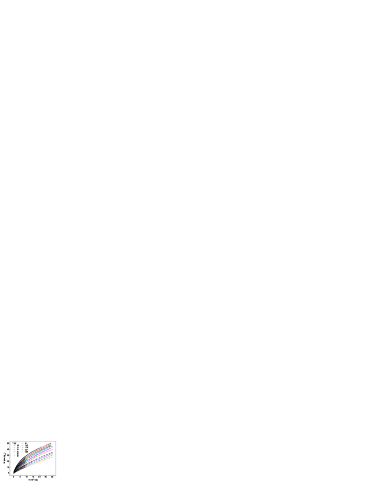
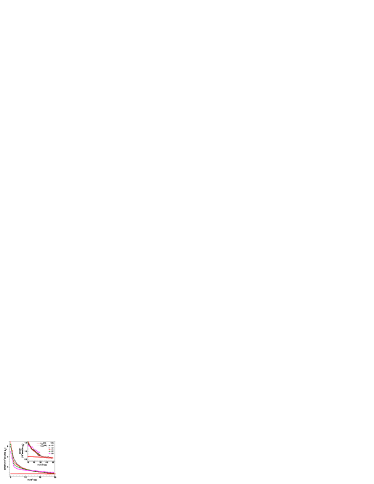
However, as temperature increases, the magnetization approaches a linear regime at lower fields, i. e., at higher temperatures, the derivative of magnetization with respect to the field approaches a nearly constant value for lower fields (Fig. 3).
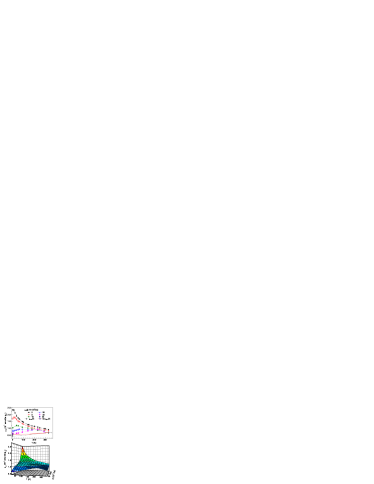
With the values of it is possible to study the different evolutions of with temperature, when is estimated at different field values. In order to distinguish between taken at a given field and the real obtained for complete saturation, we term the susceptibilities obtained at different (high) fields as high field susceptibility . In Fig. 4 it is possible to observe that decreases with temperature when taken at Oe, in accordance with previous results Makhlouf et al. (1997); Gilles et al. (2000, 2002); Silva et al. (2005b). When taken at Oe, has a non-monotonic behavior, increasing and then decreasing with temperature. For Oe, is reduced about 3 times compared to the values at Oe and increases with temperature from 4.2 to about 180 K. An even lower value of is obtained at 4.2 K and Oe. This clearly shows that the temperature dependence of the estimated depends on the field at which it is considered, with the trend to increase with temperature being more evident as the field increases. The “anomalous” behavior of decreasing with temperature for almost vanishes when considered at sufficiently high fields. This is in agreement with a recently published Monte Carlo simulation of AF nanoparticles with an even number of planes, where the simulated susceptibility increases with temperature Brown et al. (2005).
III.2 The absence of a spin-flop transition
As previously reported,Guertin et al. (2007) there is no evidence of a spin-flop transition up to Oe in ferritin. In Ref. Guertin et al. (2007), a spin-flop transition was more likely to occur than in the present case, since the temperature was lower and the field higher. From mean-field theory, at 0 K, the spin-flop field is (where is the exchange field and the anisotropy field), which in ferritin is about Oe accordingly to estimations of and of Ref.Gilles et al. (2002). As discussed in Ref.Guertin et al. (2007), the experimental evidence of the absence of a spin-flop up to Oe implies an enhancement of and/or compared to that expected. The absence of a spin-flop in this field range may also be due to the relatively large uncompensated moment of ferritin, as highlighted in Ref.Mørup et al. (2007), and both reasons are most probably related. In general is estimated from the anisotropy constant associated to the blocking process and from a saturation (or sublattice) magnetization as . is often estimated by dividing the activation energy by the average nanoparticle volume since in nanoparticles with intraparticle ferromagnetic interactions . Since K (see Sec.III.4) and the average ferritin core has Fe ions Mann (1996), the average anisotropy constant per Fe ion of the average core is erg/Fe. Taking the sublattice magnetization Fe (see Sec. III.3) the anisotropy field is Oe and so Oe (see estimation for in Sec. III.3) in accordance with previous estimations Gilles et al. (2002); Mørup et al. (2007). However, does not hold in AF nanoparticles, where in general , with . In fact, it was recently shown that in ferrihydrite the energy barrier is proportional to the square root of the total volume (i. e. ), corresponding to a random distribution of energy barriers and probably of uncompensated ions Silva et al. (2008). This means that in each particle, the effective value of is given by the fluctuation of the local anisotropy energy, such that the local anisotropy constant is higher than the average value calculated by , being higher by a factor of where is the number of Fe ions. In other words, the energy of a nanoparticle with Fe ions and the same local anisotropy energy of ferritin but without a random distribution of anisotropy barriers would be
| (1) |
is the barrier that each moment experiences and so we can associated it to the spin-flop process. By doing so, we can define a local anisotropy field and a local spin-flop field whose estimated value, Oe, is close to the maximum field here used. Therefore, the experimental absence of a spin-flop in the field range here used can be, at least, partially explained in the frame of the mean field considering that . We also emphasize that while the blocking is primarily probing the anisotropy energy experienced by the uncompensated moments in their process of crossing the energy barrier between easy directions, the flopping process is primarily associated to the anisotropy experienced by the AF coupled moments, and the anisotropy field associated to AF moments can be significantly different from that of the uncompensated moments.
III.3 Bulk antiferromagnetic and superantiferromagnetic susceptibilities
As one might expect, the study of the enhancement of in nanoparticles and of the temperature dependence of benefits from comparing to bulk results. This is not possible for ferritin, since ferrihydrite exists only in the form of nanoparticles Jambor and Dutrizac (1998). However a comparison to mean field estimations can be made. In the mean field context, the perpendicular AF susceptibility is
| (2) | |||
where and are the magnetic moment and magnetization of an AF sublattice at 0 K, respectively, and the inter-sublattice exchange field. At , estimated from mean field is equal to , and at K . Eq.2 disregards the anisotropy field, which is a good approximation for estimating of ferritin, since it is about 2 orders of magnitude lower than . Concerning the values to be used in Eq.2, there is a broad range of estimated for ferritin and ferrihydrite (typically from 300 to 500 K), depending on the used technique Seehra et al. (2000); Jansen et al. (2002); Makhlouf et al. (1997); Gilles et al. (2002); Silva et al. (2005b). Using magnetization measurements, is always obtained by extrapolation Makhlouf et al. (1997); Gilles et al. (2002); Silva et al. (2005b), and is higher than that obtained as a direct result with neutron diffraction for ferrihydrite ( K in Ref.Jansen et al. (2002) and K in Ref.Seehra et al. (2000)). Neutron diffraction also gives an estimation of the magnetic moment: (5 K)=3.2 Fe Jansen et al. (2002). This value is lower than that of isolated Fe ions (previously used in the estimation of Gilles et al. (2002)) but is reasonable for a compound where magnetic exchange interactions are influenced by a high degree of structural disorder Jansen et al. (2002). can be further obtained by extrapolation to 0 K using the mean field temperature dependence for the magnetic moment. Using the neutron diffraction results Oe and emu/Oe gFe. at 0 and thus estimated are plotted in Fig. 4.
Based on estimation it is also possible to further estimate the antiferromagnetic susceptibility expected when considering superantiferromagnetism (both temperature and field dependent). At zero field, and considering only first neighbor exchange, the perpendicular susceptibility of particles with even number of ferromagnetic spin planes is , and considering neighbor interactions would increase this estimation Néel (1962); Gilles et al. (2002). By increasing the field, approaches , being this approach dependent on a characteristic field given by . For low values the relation between and is
| (3) |
For around unity, can be obtained by solving an integral equation Néel (1962); Gilles et al. (2002), whose results are given in tables in Ref.Néel (1962). The perpendicular susceptibility of a set of nanoparticles with half of them having even can be written as
| (4) |
where the extra susceptibility is a function of and and can be expressed as . The susceptibility of a set of randomly orientated nanoparticles can then be estimated as
| (5) |
In the frame of mean field, considering two sublattices with negligible intralattice exchange interaction, the temperature dependence of is given by Lidiard (1954)
| (6) |
with
| (7) | |||
Considering of Fe3+, can be readily obtained (Fig. 4, upper panel). can be further calculated by estimating , which depends on (i. e. on and ) and on . Using ,Gilles et al. (2002) and calculating based on Eq.3 for , and on the tables presented in Néel (1962) for and , one can estimate , plotted as a function of field for K in Fig. 3 (using the average value of and its upper and lower limits) and as a function of temperature for Oe in Fig. 4 upper panel. It is clear from Fig. 3 that up to fields of the order of is higher than that expected from and , having thus contribution from mechanisms other than bulk antiferromagnetism and superantiferromagnetism. For Oe and at 4.2 K, approaches and , and bulk antiferromagnetism and superantiferromagnetism are the relevant contributions for (Fig. 3, inset). At Oe and 4.2 K, is of the order of and , being closer to than . Therefore, considering that at this temperature and field is already saturated the AF susceptibility has a contribution from superantiferromagnetism. Concerning the temperature dependence of the susceptibilities, (Fig. 4, upper panel), it is clear that for lower and higher temperatures at Oe is close to , while it deviates in the intermediate temperature region, this deviation being higher than the difference between and . It is also noteworthy that, while decreases with temperature, due to the approach of to at high fields, due to averaging particles with even and odd , averaging and , and due to the temperature increase of , at Oe estimated for ferritin is roughly constant up to K increasing then with temperature up to .
III.4 The role of anisotropy and small magnetic moments
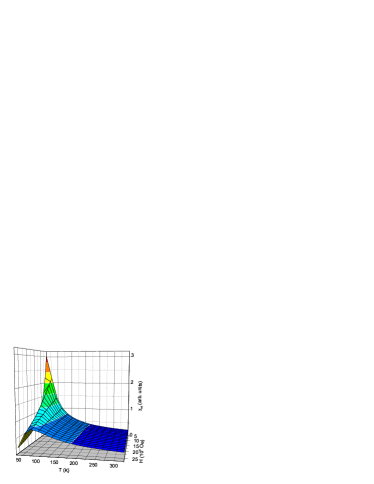
From the above discussion, it is clear that superantiferromagnetism is not the most relevant mechanism responsible for the fact that is larger than for neither for the decrease of with temperature below . It is therefore interesting to investigate the origin of this enhancement and decrease with temperature, which is expected to be related to the non-saturation of . In turn, this non-saturation is either due to small values or due to the role of anisotropy in the approach to saturation of . The existence of such small moments, in particular paramagnetic Fe3+ ions, is in fact expected from relaxometry results Brooks et al. (1998). These small moments may in fact be related to the non-monotonic behavior observed in the temperature dependence of . Simple calculations of an hypothetical contribution of small moments to based on with being given by the Langevin law show that increases and then decreases with temperature at a given field, with the temperature at which that maximum occurs increasing with the field (Fig. 5). This behavior is qualitatively similar to that observed in Fig. 4.
Concerning the role of anisotropy, although for fields of the order of Oe , for the typical average of ferritin ( ) and K, would be close to saturation accordingly to the Langevin law, anisotropy retards saturation to higher fields so that the typical average still gives an important contribution to in the above mentioned conditions. As temperature increases, the relevance of anisotropy energy decreases compared to , leading to a decrease of the contribution of to . Considering only the component and two temperatures , there is a cross-over field below which , so that gives a spurious contribution to the total that decreases with temperature. This cross-over field increases in comparison to the Langevin law when uniaxial anisotropy is considered. When surface anisotropy is further taken into account, the increase of this cross-over field is quite dramatic: accordingly to simulations shown in Ref.Kachkachi (2007), the cross-over field is of the order of Oe for Co nanoparticles (515 spins) and temperatures between and K.
The existence of a relevant anisotropy contribution to curves can be qualitatively evaluated combining information from in a scale and ac susceptibility, since anisotropy does not affect the equilibrium linear susceptibility ( above blocking), affecting at intermediate fields whenever relevant. The in phase () and out of phase () components of the ac susceptibility (Fig. 6) show characteristic features of ferritin superparamagnetic nanoparticles, namely frequency dependence below temperatures of the order of 40 K and a frequency dependent maximum at around 20 K Luis et al. (1999). From the frequency dependence of the maximum of it is possible to estimate an energy barrier associated to the blocking process as 255 K. The antiferromagnetic susceptibility and can be subtracted to , in order to study the temperature dependence of based on a susceptibility temperature product plot, since interparticle interactions are negligible Luis et al. (1999). corresponds also to the slope of in a scale at . Both and increase with temperature up to K, the temperature at which becomes zero, corresponding to an increase of the average due to the unblocking process (Fig. 6c). For K, and decrease with temperature due to the decrease of the sublattice magnetization when approaching ,Gilles et al. (2002); Silva et al. (2005b) being this decrease more pronounced for K. Due to the decrease of with temperature for K (above blocking), is not expected to scale in a plot, being expected lower values for in the curves taken at higher temperatures in all the range. In Fig. 7 it is clear that above blocking does not scale in for Oe/K. In particular, in the K range and Oe/K, (and the slope of ) is higher in the curves taken at higher temperatures (Fig. 7, inset), unlike that expected from the slightly decrease of . For K, in a scale is always lower in the curves taken at higher temperatures, as expected from the decrease of .
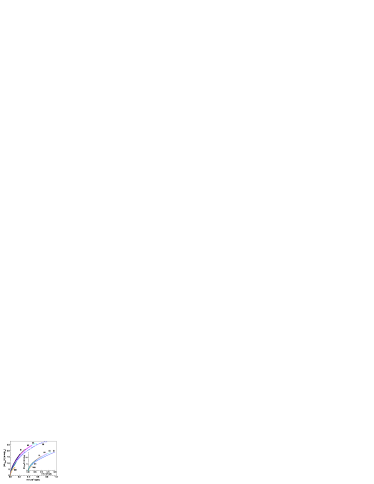
In other words, the non-scaling of in the K temperature range and intermediate values where has higher values for curves taken at higher temperatures cannot be explained from the behavior of . Since cannot account for the behavior of , since interparticle interactions in ferritin are negligible Luis et al. (1999) and a distribution of uncompensated moments for it self does not produce a non-scaling of (the sum of functions of is also a function of ), the only reason left for the behavior of in the K temperature range is anisotropy. In fact, the increase of for curves taken at higher temperatures and for a given value in a intermediate range and scaling (or decrease) in the low range is, in fact, a fingerprint of anisotropy, as found for instance in Co nanoparticles,Respaud (1999) and in simulations Kachkachi (2007); Madsen et al. (2006). Therefore anisotropy has a relevant contribution to the curves of ferritin, being one of the causes to the non-saturation of at the applied fields normally used.
IV Conclusions
We show that the derived depends critically on the maximum field at which it is determined. When it is determined at fields of the order of Oe, decreases with temperature, similarly to earlier studies Makhlouf et al. (1997); Gilles et al. (2000, 2002). This behavior is related to the influence of anisotropy in the approach to saturation of and probably due to the existence of small magnetic moments, that leads to the non saturation of at fields of the order of . On the contrary, when is determined as at Oe, it increases with temperature for K (i. e. below ) as in bulk AF. At fields of the order of Oe and at 4.2 K, determined as is in good agreement to estimated from mean field considering the effect of superantiferromagnetism, and of the order of estimated from mean field.
Acknowledgements.
The authors acknowledge A. Urtizberea for helping with the high field measurements and for fruitful discussions, and E. Lythgoe for critical reading the manuscript. Part of this work has been supported by EuroMagNET under the EU contract RII3-CT-2004-506239. The financial support from FCT, POCTI/CTM/46780/02, bilateral projects GRICES-CSIC, and Acción Integrada Luso-Española E-105/04 are gratefully recognized. The work in Zaragoza has been supported by the research grants MAT2007-61621 and CONSOLIDER-INGENIO 2010 Programme, grant CSD2007/0010 from the Ministry of Education. N. J. O. S. acknowledges CSIC for a I3P contract.References
- Berkowitz et al. (1999) A. E. Berkowitz, R. Kodama, S. A. Makhlouf, F. T. Parker, F. E. Spada, E. J. McNiff Jr., and S. Foner, J. Magn. Magn. Mater. 196-197, 591 (1999).
- Makhlouf et al. (1997) S. A. Makhlouf, F. T. Parker, and A. E. Berkowitz, Phys. Rev. B. 55, 14717(R) (1997).
- Seehra et al. (2000) M. S. Seehra, V. S. Babu, A. Manivannan, and J. W. Lynn, Phys. Rev. B. 61, 3513 (2000).
- Silva et al. (2004) N. J. O. Silva, V. S. Amaral, L. D. Carlos, and V. de Zea Bermudez, J. Magn. Magn. Mater. 455-456, 569 (2004).
- Mørup and Frandsen (2004) S. Mørup and C. Frandsen, Phys. Rev. Lett. 92, 217201 (2004).
- Punnoose et al. (2004) A. Punnoose, T. Phanthavady, M. S. Seehra, N. Shah, and G. P. Huffman, Phys. Rev. B. 69, 054425 (2004).
- Gilles et al. (2000) C. Gilles, P. Bonville, K. K. Wong, and S. Mann, Eur. Phys. J. B 17, 417 (2000).
- Gilles et al. (2002) C. Gilles, P. Bonville, H. Rakoto, J. M. Broto, K. K. Wong, and S. Mann, J. Magn. Magn. Mater. 241, 430 (2002).
- Néel (1961a) L. Néel, C. R. Hebd. Seances Acad. Sci. 253, 203 (1961a).
- Néel (1961b) L. Néel, C. R. Hebd. Seances Acad. Sci. 253, 1286 (1961b).
- Néel (1962) L. Néel, J. Phys. Soc. Japan 17 Sup. B 1, 676 (1962).
- Silva et al. (2005a) N. J. O. Silva, L. D. Carlos, and V. S. Amaral, Phys. Rev. Lett. 94, 039707 (2005a).
- Mørup and Frandsen (2005) S. Mørup and C. Frandsen, Phys. Rev. Lett. 94, 039708 (2005).
- Kilcoyne and Cywinski (1995) S. H. Kilcoyne and R. Cywinski, J. Magn. Magn. Mater. 140-144, 1466 (1995).
- Silva et al. (2005b) N. J. O. Silva, V. S. Amaral, and L. D. Carlos, Phys. Rev. B. 71, 184408 (2005b).
- Madsen et al. (2006) D. E. Madsen, S. Mørup, and M. F. Hansen, J. Magn. Magn. Mater. 305, 95 (2006).
- Mann (1996) S. Mann, Inorganic Materials (Willey and Sons, Chichester, 1996).
- Guertin et al. (2007) R. P. Guertin, N. Harrison, Z. Zhou, S. McCall, and F. Drymiotis, J. Magn. Magn. Mater. 308, 97 (2007).
- Brown et al. (2005) G. Brown, A. Janotti, M. Eisenbach, and G. M. Stocks, Phys. Rev. B. 72, 140405R (2005).
- Mørup et al. (2007) S. Mørup, D. E. Madsen, C. Frandsen, C. R. H. Bahl, and M. F. Hansen, J. Phys.: Condens. Matter 19, 213202 (2007).
- Silva et al. (2008) N. J. O. Silva, V. S. Amaral, L. D. Carlos, B. Rodríguez-González, L. M. Liz-Marzán, T. S. Berquó, S. K. Banerjee, V. de Zea Bermudez, A. Millán, , et al., Phys. Rev. B. 77, 134426 (2008).
- Jambor and Dutrizac (1998) J. L. Jambor and J. E. Dutrizac, Chem. Rev. 98, 2549 (1998).
- Jansen et al. (2002) E. Jansen, A. Kyek, W. Schafer, and U. Schwertmann, Appl. Phys. A: Mater. Sci. Process 74, S1004 (2002).
- Lidiard (1954) A. B. Lidiard, Rept. Prog. Phys. 17, 201 (1954).
- Brooks et al. (1998) R. A. Brooks, J. Vymazal, R. B. Goldfarb, J. W. M. Bulte, and P. Aisen, Magn. Reson. Med. 40, 227 (1998).
- Kachkachi (2007) H. Kachkachi, J. Magn. Magn. Mater. 316, 248 (2007).
- Luis et al. (1999) F. Luis, E. del Barco, J. M. Hernández, E. Remiro, J. Bartolomé, and J. Tejada, Phys. Rev. B. 59, 11837 (1999).
- Respaud (1999) M. Respaud, J. App. Phys. 86, 556 (1999).