33email: lise.deharveng@oamp.fr
Star formation around RCW 120,
the perfect
bubble ††thanks: Table 1 is available in electronic form at the CDS
via anonymous ftp to cdsarc.u-strasbg.fr (130.79.128.5) or via
http://cdsweb.u-strasbg.fr/cgi-bin/qcat?J/A+A/
Abstract
Context. This study deals with the star formation triggered by H ii regions.
Aims. We wish to take advantage of the very simple morphology of RCW 120 – a perfect bubble – to understand the mechanisms triggering star formation around an H ii region and to establish what kind of stars are formed there.
Methods. We present 870 m observations of RCW 120, obtained with the APEX-LABOCA camera. These show the distribution of cold dust, and thus of neutral material. We use Spitzer-MIPS observations at 24 m and 70 m to detect the young stellar objects present in this region and to estimate their evolutionary stages.
Results. A layer of dense neutral material surrounds the entire H ii region, having been swept up during the region’s expansion. This layer has a mass greater than and is fragmented, with massive fragments elongated along the ionization front (IF). We measured the 24 m flux of 138 sources. Of these, 39 are Class I or flat-spectrum young stellar objects (YSOs) observed in the direction of the collected layer. We show that several triggering mechanisms are acting simultaneously in the swept-up shell, where they form a second generation of stars. No massive YSOs are detected. However, a massive, compact 870 m core lies adjacent to the IF. A 70 m source with no 24 m counterpart is detected at the same position. This source is a likely candidate for a Class 0 YSO. Also at 24 m, we detect a chain of about ten regularly spaced Class I or flat spectrum sources, parallel to the IF, in the direction of the most massive fragment. We suggest that the formation of these YSOs is the result of Jeans gravitational instabilities in the collected layer. Finally, the 870 m emission, the 24 m emission, and the H emission show the existence of an extended and partially ionized photodissociation region around RCW 120. This demonstrates the long-distance influence of the H ii region upon its surrounding medium.
Key Words.:
Stars: formation – Stars: early-type – ISM: H ii regions – ISM: individual: RCW 1201 Introduction
RCW 120 is perhaps the most perfect of the many bubbles detected in the Galactic plane by Spitzer at 8.0 m (Churchwell chu06 (2006), bubble S7). This H ii region presents a simple morphology, with a well defined ionization front (IF) separating the ionized and the surrounding neutral material. This optical H ii region has the additional advantage of lying nearby, at a distance of 1.34 kpc, and being isolated. Its distance is reliable as the photometric and kinematic determinations are in good agreement (Zavagno et al. zav07 (2007); hereafter ZA07). The J2000 coordinates of its O8 central exciting star are , , , . This star is identified in ZA07’s fig. 1.
Star formation associated with RCW 120 has been studied by ZA07, mainly using observations obtained at 1.2 mm, supplemented by 2MASS and Spitzer-GLIMPSE data. ZA07 have shown the presence of a layer of collected neutral material surrounding the ionized gas. This layer is fragmented, with massive fragments adjacent to the ionized gas, and elongated along the IF. Many young stellar objects (YSOs) are present in the vicinity of the H ii region. However no massive object is observed, even in the direction of the most massive fragment. ZA07’s conclusion is that the collect & collapse process is taking place around RCW 120, but that this region is too young for massive-star formation to take place via gravitational instabilities along the collected layer.
Since then, new observations have become available, allowing us to progress in our understanding of star formation triggered by RCW 120. These observations are: i) a deep map of the dust emission at 870 m, obtained with the APEX-LABOCA camera during the science verification phase, giving improved knowledge of the cold dust distribution and hence of the neutral material associated with RCW 120; ii) Spitzer-MIPSGAL frames at 24 m and 70 m, allowing a better detection of the YSOs possibly associated with RCW 120, and a better determination of their evolutionary stages. The 870 m observation is presented in Sect. 2.1, and the 24 m and 70 m frames and their photometric reduction in Sect. 2.2. Sect 3 deals with the distribution of the neutral material around RCW120. The nature of the YSOs associated with RCW 120 is discussed in Sect. 4. In Sect. 5 we try to understand the interactions between the central H ii region and the surrounding material, and how these interactions influence the star formation in this region.
Additional details about RCW 120, and various composite colour images, can be found in Deharveng & Zavagno (deh08 (2008)).
2 New observations
2.1 APEX-LABOCA observations at 870 m
The APEX111This publication is based on data acquired with the Atacama Pathfinder EXperiment (APEX), in run 078.F-9005(A). APEX is a collaboration between the Max-Planck-Institut für Radioastronomie, the European Southern Observatory, and the Onsala Space Observatory. LABOCA camera was used at 870 m (345 GHz) to observe the continuum emission of the cold dust associated with RCW 120. The Large Apex BOlometer CAmera, commissioned in May 2007, is a 295-pixel bolometer array developed by the Max-Planck-Institut für Radioastronomie (Siringo et al. sir07 (2007)). The APEX beam size at 870 m is 192.
RCW 120 was observed in July 2007 as part of the science verification program. A map was obtained in the spiral raster mode. The on-source observing time was less than two hours. During these observations the amount of precipitable water vapour was mm.
The observations were reduced using the Bolometer array data Analysis package (BoA; Schuller et al. in preparation). The reduction steps involved in the processing of the data are: flux calibration and opacity correction, deduced from skydip measurements and observations of primary and secondary calibrators; flagging of bad bolometers; correlated noise removal; despiking; low-frequency filtering. As a result of the correction for correlated noise, uniformly extended emission (on scales larger than ), which mimics the variations of the sky emission (skynoise), is filtered out.
The calibration uncertainty in the final map is of the order of 15%. The pointing uncertainty is (0.025 pc at the distance of RCW 120). We estimate the rms noise of the final image to be 0.02 Jy/beam.
2.2 Spitzer-MIPS observations at 24 m and 70 m
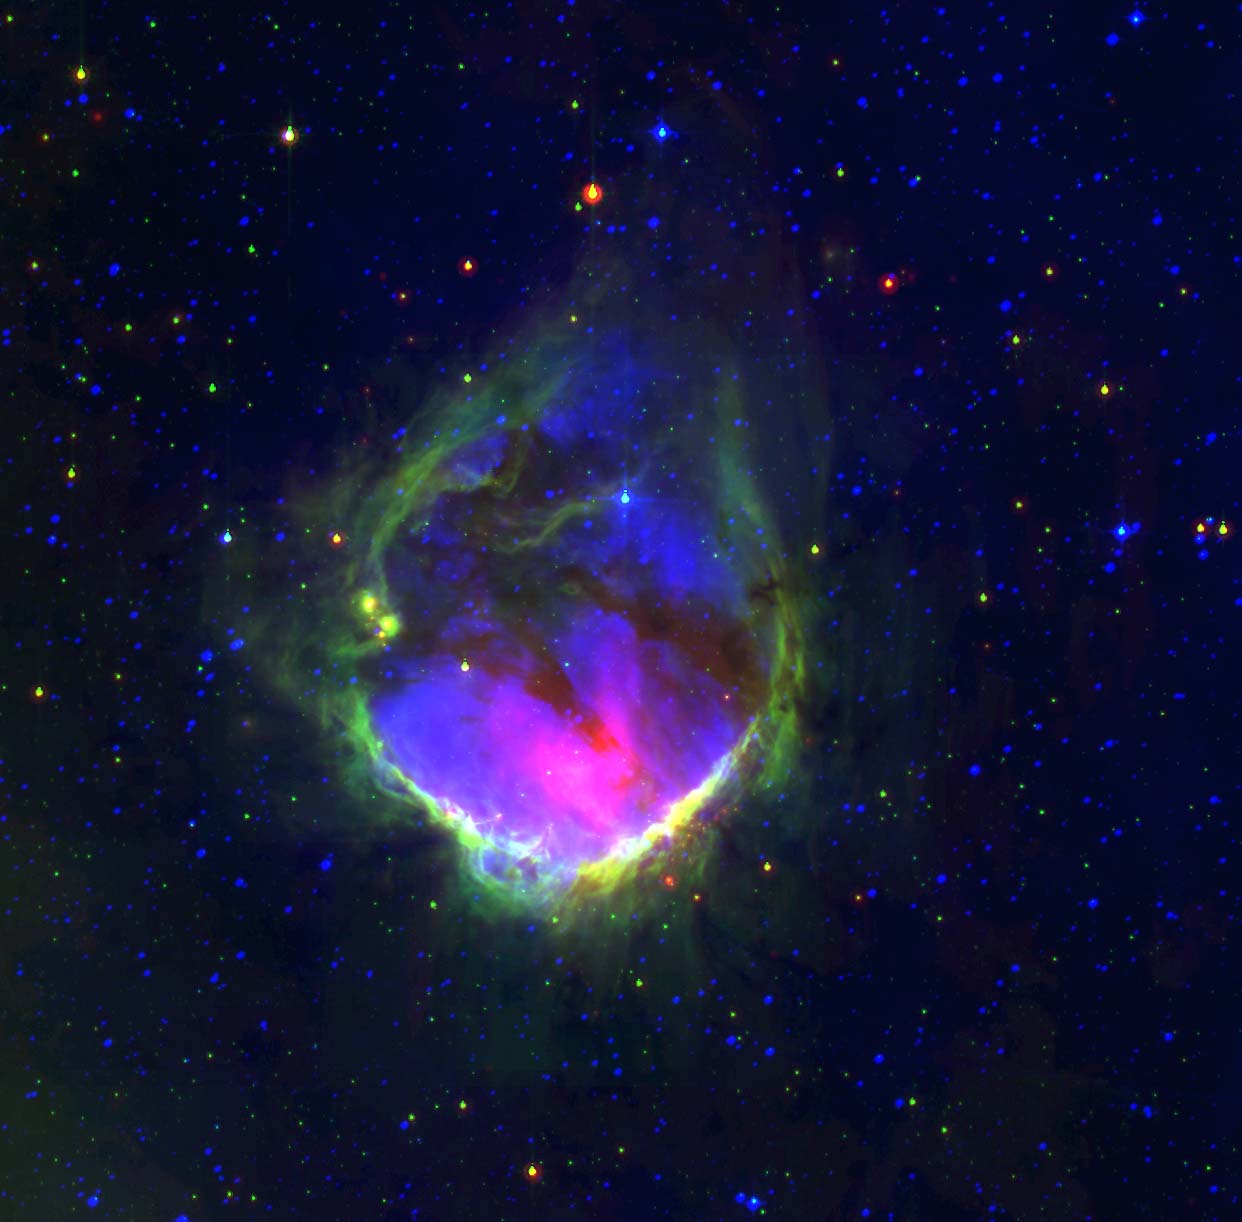
Fig. 1 is a composite colour image of RCW 120, from the optical to the mid-IR. Blue is the H emission of the ionized gas, from SuperCOSMOS (Parker et al. par05 (2005)). Green is the 8.0 m emission from Spitzer-GLIMPSE (Benjamin et al. ben03 (2003)). At this wavelength we mainly see the emission of polycyclic aromatic hydrocarbons (PAHs). These big molecules are destroyed inside the H ii region by the UV radiation of the exciting stars. They are excited in the photodissociation region (PDR) by the radiation leaking from the H ii region. Thus they are good tracers of ionization fronts. Red shows the emission at 24 m, from Spitzer-MIPSGAL (Carey et al. car05 (2005)). We see both the extended emission of the small dust grains present inside the ionized region and the PDR, and the emission of grains present in the envelopes of YSOs and evolved stars, hence the usefulness of the 24 m images for detecting YSOs. (The central 24 m extended emission is saturated.)
We have measured three Post BCD frames from the Spitzer-MIPSGAL survey at 24 m. These cover a zone going from to in right ascension and from to in declination, encompassing the zone of influence of RCW 120. We used the DAOPHOT stellar photometry package with PSF fitting (Stetson ste87 (1987)). The main difficulty to overcome is the measurement of faint stars superimposed on a bright and very irregular background. For this we used an iterative process. A first run of DAOPHOT, using the normal procedures, yields stellar positions and rough magnitudes. These stars are then subtracted from the original frame. The resulting image is smoothed with a median filter (window of 1111 pixels, larger than the size of a star) to remove any vestiges of the stars, and obtain an image of the background emission alone. This background image is then subtracted from the original frame. On the resulting image the stars lie on a low brightness and more uniform background (the only remaining structures are those smaller than the filter window). Further reduction is performed by the normal DAOPHOT procedures. This iterative process can be repeated several times until convergence is satisfactory. We check the result by eye; if the reduction is good no brightness peaks or holes should be seen at the positions of the stars after these stars have been subtracted from the original frame.
The 24 m frames overlap, providing us with double values of the magnitudes of 27 sources. This allows us to estimate the accuracy of the results: the rms magnitude difference for these 27 pairs is 0.11 mag. The DAOPHOT PSF magnitudes are then converted into aperture magnitudes, following the “Quick Point Source Photometric Measurement” procedure (http://ssc.spitzer.caltech.edu/archanaly/quickphot.html), and using isolated bright stars. The resulting 24 m magnitudes, obtained for 138 sources, are given in Table 1.
We have also reduced three 70 m Post BCD frames, from the Spitzer-MIPSGAL survey. Six sources have been measured manually, using aperture photometry. These measurements are also given in Table 1.
We have used the interactive software sky atlas Aladin222 http://aladin.u-strasbg.fr/ to superimpose the 2MASS catalogue on the GLIMPSE and 24 m images. In the few cases where several GLIMPSE or 2MASS sources were observed in the direction of a 24 m source, only the central one was considered.
Table 1, which is available in electronic form at the CDS, presents our measured 24 m magnitudes along with these objects’ 1.25 m to 8.0 m magnitudes taken from the 2MASS and Spitzer-GLIMPSE catalogues. Column 1 gives an identification number. Columns 2 and 3 are the coordinates according to the Spitzer-GLIMPSE catalogues. Columns 4 to 10 give the , , , [3.6], [4.5], [5.8], and [8.0] magnitudes. These are extracted from the (highly reliable) GLIMPSE I Spring ’07 Catalog. When necessary they have been supplemented with values from the (less reliable) GLIMPSE I Spring ’07 Archive, and by the 2MASS All-Sky Point Source Catalog (a colon indicates an uncertain measurement). Columns 11 and 12 give our 24 m and 70 m measurements. Five bright sources which have mag (as indicated by a colon) are clearly saturated at 24 m. Column 13 gives our conclusions concerning the evolutionary stages of the sources (see Sect. 4).
3 The distribution of neutral material around RCW 120
The distribution of the 1.2-mm dust emission was presented and discussed by ZA07 using SEST-SIMBA data (beam size 24, rms noise 0.02 Jy/beam, exposure time 10 hr). Here we present, in Fig. 2, the distribution of the 870 m dust emission, obtained with the APEX-LABOCA camera (beam size , rms noise 0.02 Jy/beam, exposure time hr).
Emission at 870 m is mainly the thermal continuum of cold dust. Contamination from the 12CO(3-2) line may occur, but this emission is expected to be faint (see the discussion in Schuller et al. in preparation).
The 870 m map clearly resembles the 1.2-mm map: a layer of cold dust surrounds the ionized region; this layer is fragmented, with condensations elongated along the ionization front, especially in the south. The higher resolution and higher signal-to-noise ratio at 870 m reveal new structures that were only barely visible in the 1.2-mm map. This is the case for the radial structures that are observed north-east of the ionized region, and for the filaments responsible for the absorption in the central parts of RCW 120 (the central absorbing filaments are conspicuous on Fig. 2, right, blue channel). Also, small faint condensations are now revealed, these often being associated with Class I sources detected thanks to the GLIMPSE and MIPSGAL surveys (Sect. 4).
3.1 Mass determination
Assuming that the 870 m emission is uniquely thermal dust emission, we can derive the mass of the emitting material. According to Hildebrand (hil83 (1983)) the total (gas+dust) mass of a condensation is related to its flux density by
where is the distance of the source, is the dust opacity per unit mass at 870 m, and is the Planck function for a temperature . We have assumed a gas-to-dust ratio of 100. The dust temperature is taken as 20 K or 30 K, as often assumed for protostellar condensations (cf. Motte et al. mot03 (2003), Johnstone et al. joh06 (2006)). Following Ossenkopf & Henning (oss94 (1994)) we adopt the value = 1.8 cm2 g-1. The dust opacity depends strongly on the dust grains’ coating (ice mantles), compactness, coagulation evolution and the ambient density (see their fig. 5a–c). This value agrees reasonably well with those adopted by various authors to derive masses from SCUBA 850 m emission maps (e.g. Kirk et al. kir06 (2006), Young et al. you03 (2003)).
Table LABEL:massemm lists the measured and derived properties obtained for several structures discussed in the text (Sect. 5). Column 1 gives the structure’s name. Condensations #1 to #8 are those identified in ZA07 (their fig. 4). Columns 2 and 3 give the emission peak coordinates and column 4 gives the emission peak level. Columns 5 and 6 give the intensity value used to define the integration boundary and hence the flux density. The choice of the levels used to delineate the structures and measure their flux densities is somewhat arbitrary; they have been chosen in order to separate the different structures. Finally column 7 gives the derived masses depending on the adopted temperature, 20 or 30 K; the lower mass corresponds to the higher dust temperature. The masses are highly uncertain. As shown by column 7, the dust temperature uncertainty alone results in a mass uncertainty of a factor two. But the dust opacity also is uncertain by a factor of two (Henning, Michel, & Stognienko hen95 (2005)), which implies an uncertainty of the same order for the mass.
| Number | Peak position | Boundary level | Mass range1 | |||
|---|---|---|---|---|---|---|
| (Jy/beam) | (Jy/beam) | (Jy) | () | |||
| Shell | 0.1 | 190 | 1920–1100 | |||
| Condensation 1 | 17h 12m 083 | 38 30 51 | 13.33 | 0.2 | 78.7 | 800–460 |
| Cond1 core | 17h 12m 083 | 38 30 51 | 13.33 | 2.5 | 24.5 | 250–143 |
| Cond1 b | 17h 12m 107 | 38 32 01 | 2.59 | 1.2 | 4.5 | 46–26 |
| Cond1 c | 17h 12m 080 | 38 32 25 | 1.35 | 0.7 | 3.0 | 31–18 |
| Condensation 2 | 17h 12m 339 | 38 30 49 | 1.92 | 0.2 | 18.8 | 192–110 |
| Cond2 bis | 17h 12m 259 | 38 31 50 | 0.73 | 0.2 | 5.4 | 55.5–32 |
| Condensation 3 | 17h 12m 438 | 38 29 42 | 0.75 | 0.2 | 6.6 | 63–38 |
| Condensation 4 | 17h 12m 423 | 38 26 59 | 0.99 | 0.2 | 8.6 | 88–50 |
| Cond 4 north | 17h 12m 460 | 38 25 25 | 0.46 | 0.2 | 0.9 | 9–5 |
| Condensation 5 | 17h 12m 330 | 38 20 00 | 0.77 | 0.1 | 22.1 | 226–130 |
| Cond5 a | 17h 12m 336 | 38 19 55 | 0.77 | 0.3 | 2.6 | 26.5–15 |
| Cond5 b1+b22 | 17h 12m 414 | 38 20 17 | 0.54 | 0.3 | 1.8 | 19–11 |
| Cond5 c | 17h 12m 433 | 38 23 31 | 0.58 | 0.3 | 1.0 | 11–6 |
| Condensation 6 | 17h 11m 495 | 38 19 59 | 1.07 | 0.1 | 8.8 | 90–52 |
| Condensation 72 | 0.2 | 2.8 | 28.5–16 | |||
| Cond7 a1 | 17h 11m 595 | 38 28 25 | 0.49 | |||
| Cond7 a2 | 17h 11m 569 | 38 29 09 | 0.57 | |||
| Condensation 8 | 17h 12m 200 | 38 34 05 | 0.56 | 0.2 | 3.8 | 38–22 |
| Condensation 9 | 17h 11m 542 | 38 16 53 | 0.50 | 0.2 | 4.2 | 42–24 |
1 Mass calculations performed with =30 and 20 K for the lower and higher values, respectively
2 The given flux density corresponds to the sum of the two substructures
The masses we estimate from the 870 m emission map are roughly twice those obtained by ZA07 from the 1.2-mm map. This discrepancy is partly due to the values adopted for the dust opacity, and mostly to the levels used to delineate the condensations. The new values are more reliable, as the 870 m map has a much better signal-to-noise ratio; also, the structures for which we estimate the masses are better defined in this paper.
In order to derive the mass contained in the annular structure that surrounds the ionized region (referred to as “Shell” in Table LABEL:massemm) we integrated the flux over the surface enclosed by the 5 level contour (corresponding to 0.1 Jy/beam; see Fig. 2). The result is a total mass for the shell in the range 1200 – 2100 .
Condensation 1 contains a very bright core (emission peak of 13.3 Jy/beam) superimposed on a bright elongated plateau at a level Jy/beam. This core is resolved, with a deconvolved size of (0.095 pc 0.05 pc; FWHM; see Sect. 5.3, condensation 1).
In addition to the condensations listed in ZA07, a few other structures were measured, most of them associated with Class I sources. They are identified in Figs 9 to 14.
3.2 Column density and extinction
We have calculated the H2 column density, , from the surface brightness , using the formula
where is expressed in Jy beam-1, in Jy, is per square centimetre, the hydrogen atom mass is in grams and the beam solid angle is in steradians.
Adopting sr corresponding to a beam of (FWHM), and assuming K, this gives
From the classical relations particles cm-2 mag-1 (Bohlin et al. boh78 (1978)) and , we obtain .
The bright core in condensation 1, with its emission peak of 13.3 Jy/beam, is responsible for a visual extinction of 225 mag (assuming a dust temperature of 20 K). Similarly, all the material enclosed by the 5 contour (Fig. 2, 0.1 Jy/beam level) corresponds to a visual extinction greater than 1.7 mag. Dust filaments – very conspicuous in front of the ionized region – are responsible for the absorption observed at optical wavelengths in the direction of the centre of RCW 120 (e.g. at H, in Fig. 2). The material observed at 870 m in the direction of the exciting star of the H ii region has a small column density, corresponding to a visual extinction mag. This is less than the extinction, mag, determined by Avedisova & Kondratenko (ave84 (1984)) for the exciting star. The relatively large beam of APEX-LABOCA smoothes out small-scale local features of the dust emission. Also, large-scale structures are removed during the reduction (Sect. 2). The visual extinction is probably larger than estimated using APEX data, by some 3 – 4 mag.
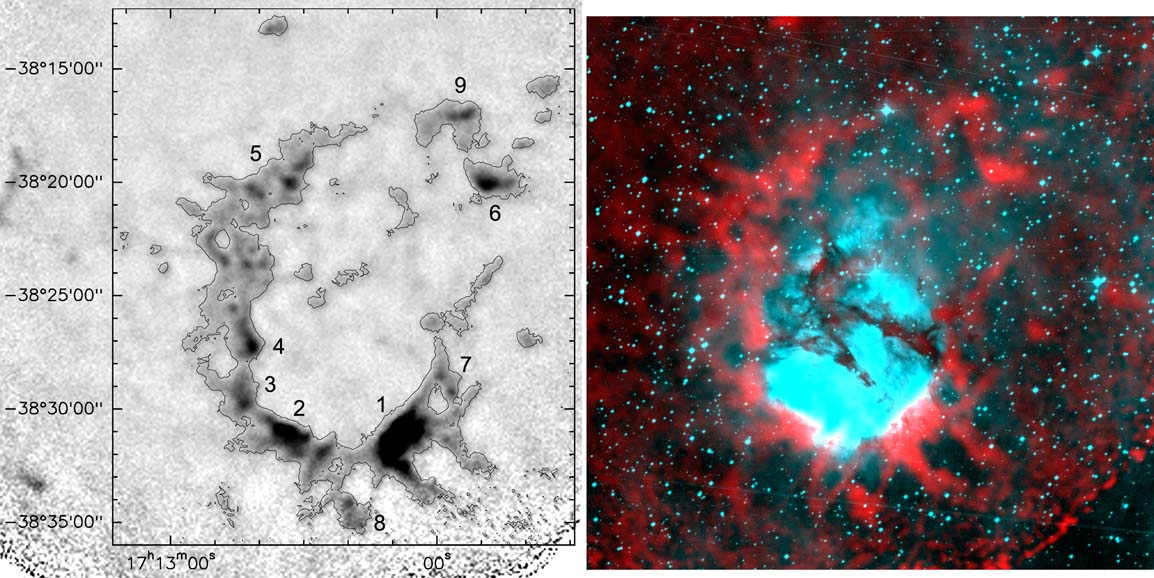
The Spitzer emission maps at 8.0 m and at 24 m show, in absorption, several infrared dark clouds (IRDCs) in the vicinity of RCW 120. When we compare these maps with the dust emission map at 870 m, Fig. 3, we see that most of the cold dust condensations in the north have IRDCs as counterparts, whereas in the south the brighter cold dust condensations have no IRDC counterparts. This gives an indication of the respective positions of the dust condensations and the ionized gas: in the north, the dust condensations are in front of the PDR, whereas they are slightly behind the ionization front in the south.
The visual extinction can be estimated from the 8.0 m absorption (cf. Vig et al. vig07 (2007)), and compared with that found from the 870 m emission. The Indebetouw et al. (ind05 (2005)) extinction law gives ; the Rieke & Lebofsky (rie85 (1985)) extinction law gives . Thus , with the optical depth at 8.0m. If and are the 8.0 m surface brightnesses, respectively in the direction of the absorbing cloud and in the direction of the surrounding background (assumed uniform), then . Of course, this method for deriving the extinction does not work if the absorbing structure has too great an optical thickness; an of 50 mag seems a reasonable maximum value.
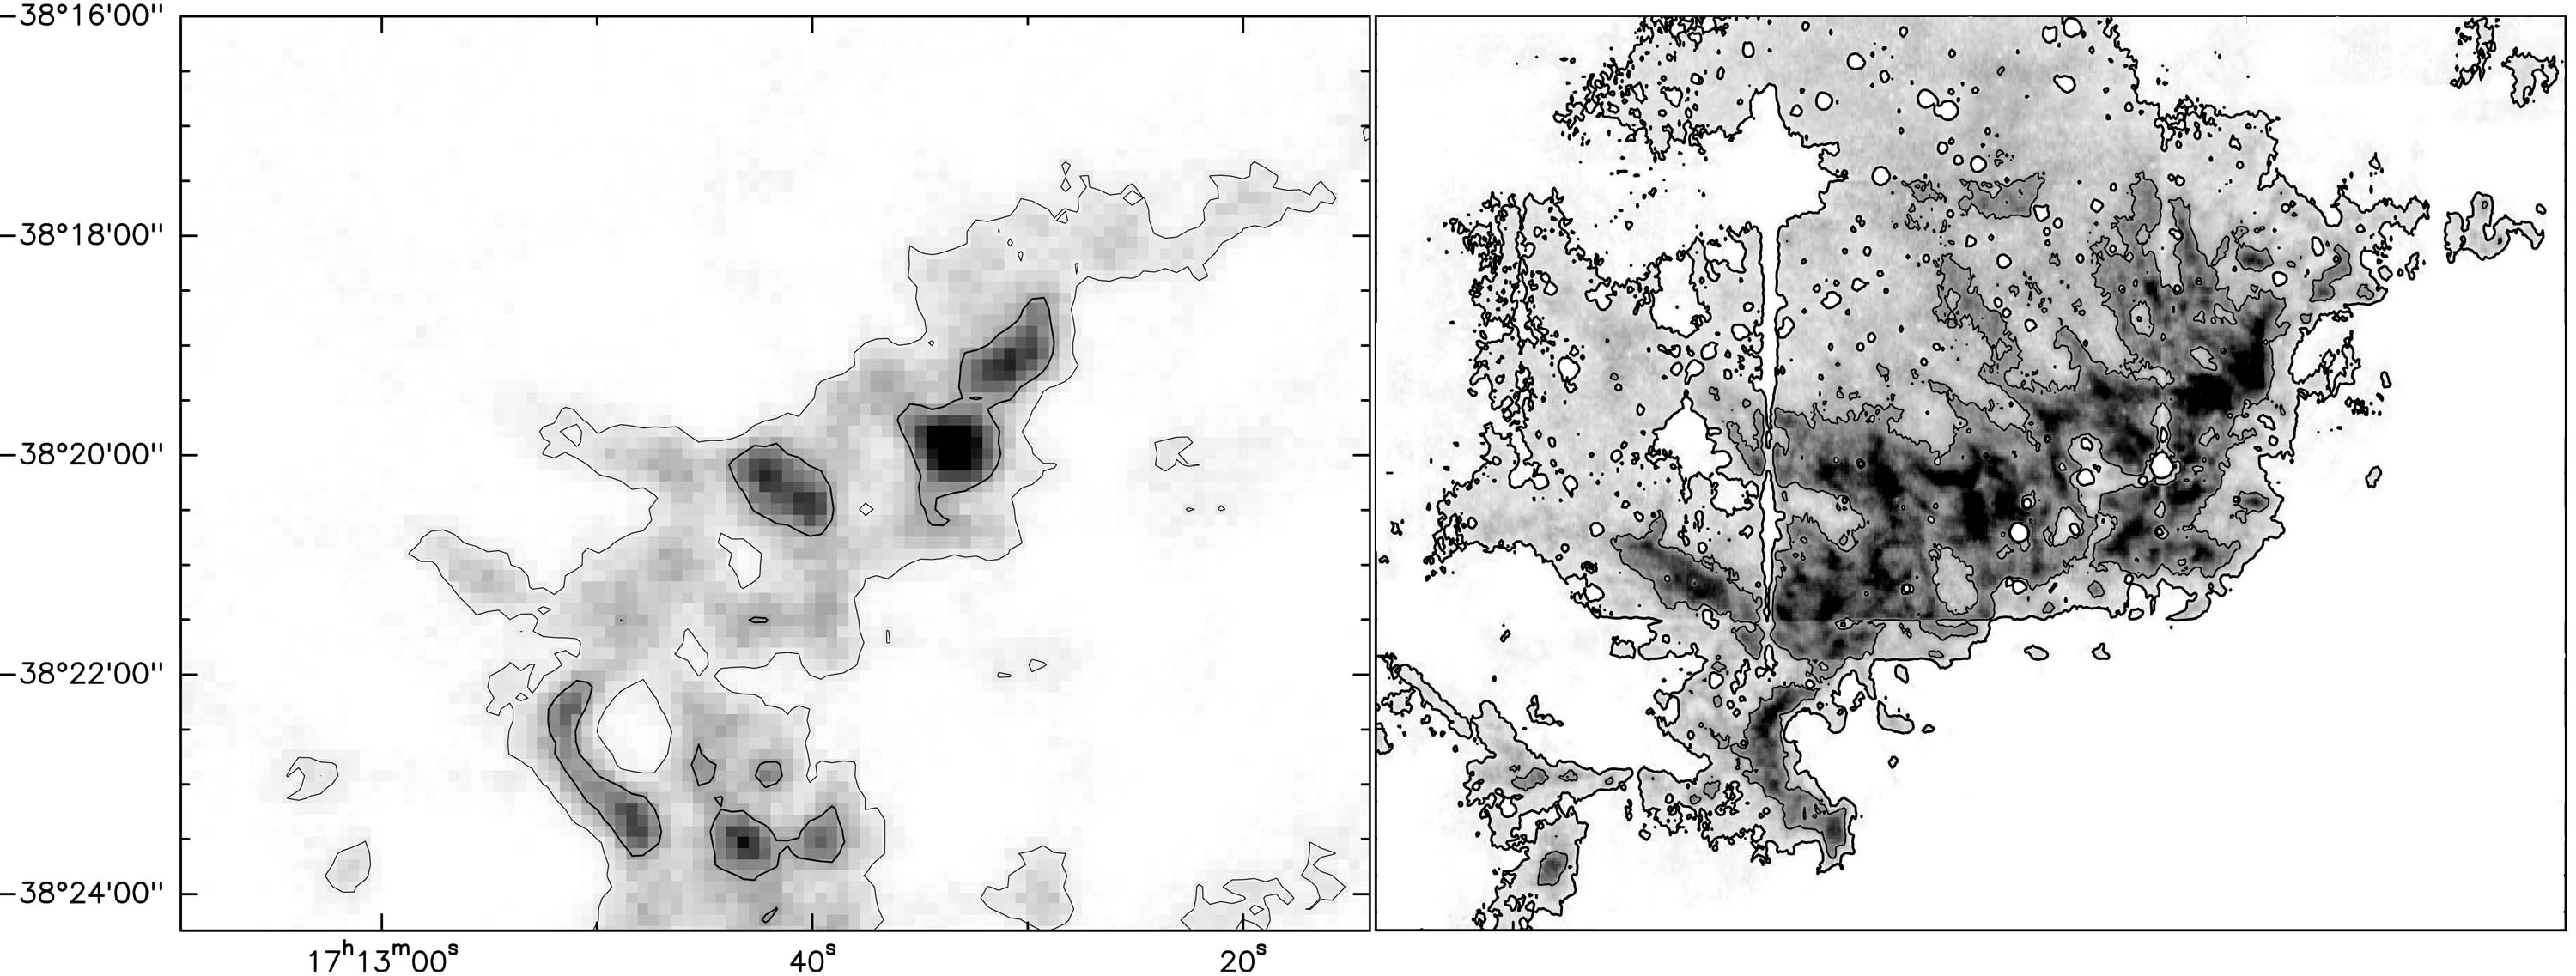
Fig. 4 allows us to compare these two determinations of the extinction in the direction of a zone situated north-east of RCW 120 (in the direction of condensation 5). For this region we have estimated to be equal to 45 MJy/sr. The first contour, on each map, corresponds to a visual extinction of 1.7 mag. These two maps are similar, with a few differences:
-
•
The region with mag is more extended on the 8.0 m extinction map than on the 870 m map. In the low extinction zones the extinction derived from the dust emission at 870 m is 1 – 2 mag less than that derived from the 8.0 m absorption. In the large extinction zones the two determinations of the extinction are in rather good agreement.
-
•
The 8.0 m extinction map shows small-scale structures, mainly filaments and curls. In the 870 m observations these structures have been smoothed out because of the larger beam. Note that many of the large extinction filaments are perpendicular to the ionization front; we will return to this point in Sect. 5.4.
An IRDC is also observed in the 24 m image, in the same direction. Because the surrounding background is far from uniform, we did not try to estimate the extinction via the absorption at 24 m.
What can we learn about the extinction from the near-IR data (from the 2MASS survey)? This data is difficult to interpret in terms of extinction. Zones devoid of stars, hence directions of large extinction, are clearly present all around RCW 120 (ZA07, fig. 3), in the , and maps. This is the case, for example, of the north-east large extinction zone shown in Fig. 3. Very few stars are detected towards these large-extinction filaments, whereas elsewhere numerous stars are observed, many of them displaying large extinction (up to 30 mag in ) in the versus diagram (not shown here). These are most probably evolved stars situated in the distant background, possibly in the Galactic bulge (RCW 120 is less than away from the Galactic centre).
4 Young stellar objects in the vicinity of RCW 120
We wish to determine whether each source detected at 24 m is a star – main-sequence or evolved – or is a YSO – Class I if its luminosity is dominated by an accreting envelope or Class II if its luminosity is dominated by a disk. (Robitaille et al. rob06 (2006) prefer to describe YSOs as stage I or stage II sources.)
In the absence of a spectroscopic signature, several indicators can be used to establish the evolutionary status of a YSO, depending on the wavelength range.
-
•
One indicator is the presence of a near-IR colour excess in the versus diagram. This excess of near-IR emission is generally attributed to hot dust associated with a disk (Lada & Adams lad92 (1992)).
-
•
Another indicator often used with the Spitzer-GLIMPSE survey is the position of the source in the Spitzer-IRAC colour-colour diagram, [3.6][4.5] versus [5.8][8.0]. In this diagram, unreddened stars (both main-sequence and evolved) have colours near (0,0), whereas Class I and Class II sources occupy different regions, as shown by Allen et al. (all04 (2004)) and discussed by Whitney et al. (2003a , 2003b , whi04 (2004)).
-
•
The slope of the spectral energy distribution (SED) between the near-IR and the mid-IR, for example from 2 m to 10 or 20 m, is another indicator. This slope is defined as In the following we shall consider that Class I sources have an increasing SED, i.e. , Class II sources have a decreasing SED with , and Class III sources have . One can use for example the versus [24] diagram (Rebull et al. reb07 (2007)333Rebull et al. (reb07 (2007)) also identify “flat spectrum” sources, which are intermediate between Class I and Class II, and correspond to (). The domain of flat spectrum sources is indicated in Fig. 4). Considering sources corrected for the interstellar extinction, Class I objects have , and Class II objects have between 3.37 and 7.54. Class III and stars, which we do not attempt to separate, have . (Ordinary stellar photospheres have .)
We shall compare the information given by these three indicators to discuss the evolutionary stages of the sources observed at 24 m in the vicinity of RCW 120, and listed in Table 1. We shall show the limitations of these indicators and try new ones. We have been greatly helped in this study by the comprehensive discussion of Robitaille et al. (rob06 (2006)).
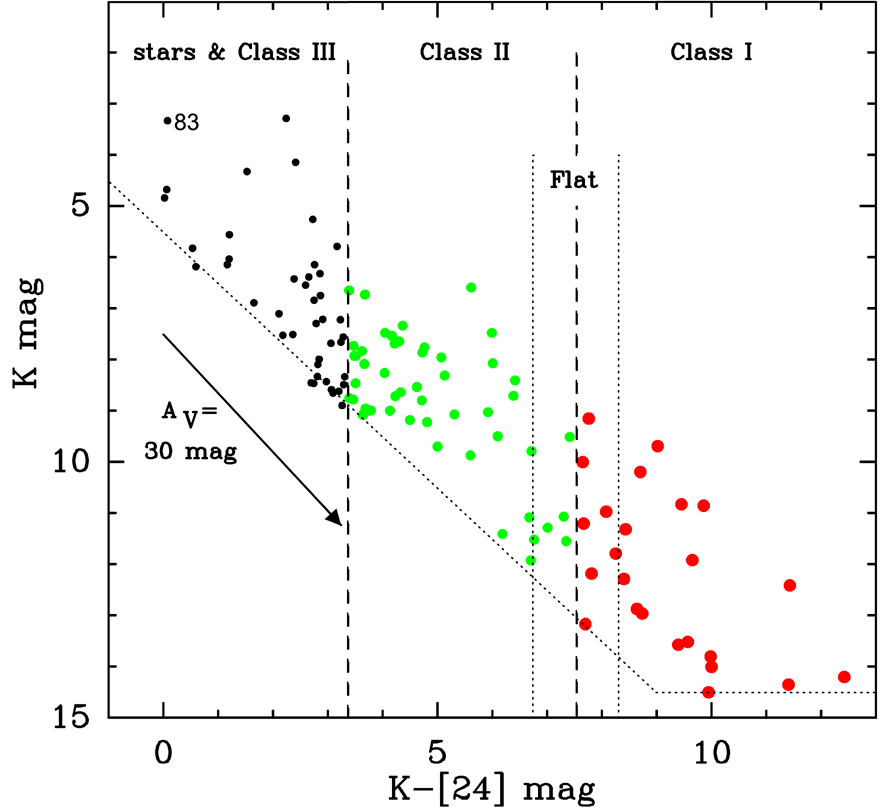
Fig. 5 presents the versus [24] diagram obtained for the 118 sources that have and [24] magnitude measurements. We are tempted to identify 24 Class I sources (red symbols), and 51 Class II sources (green symbols) in this diagram. However, note the strong effect of interstellar extinction on the [24] colour, and the suspicious concentration of sources near the separation line between Class II and Class III objects. We shall return to this point later in this section. (Following Robitaille et al. rob06 (2006), we here refer – unconventionally – to the extinction as “interstellar” when it is due to dust located outside the envelope and/or disk of a source.)
Fig. 6 presents the [3.6][4.5] versus [5.8][8.0] diagram for the 103 sources that have been measured in the four IRAC bands. We use the same symbols as in Fig. 5 for the Class I and Class II sources already identified with the first indicator ( versus ). Fig. 6 shows an almost perfect agreement between the two indicators for Class I sources. Eleven new very red sources (black squares), which have no measurable magnitude and hence are absent in Fig. 5, are identified as Class I. The situation is less satisfactory for the candidate Class II sources (according to our first indicator). A number of these sources lie inside the ellipse of stars. We shall return to this point later in this section.
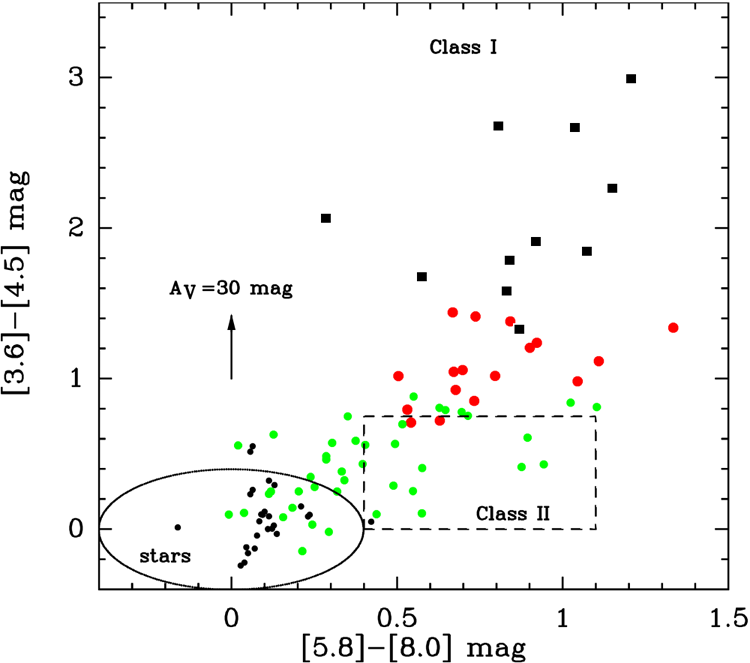
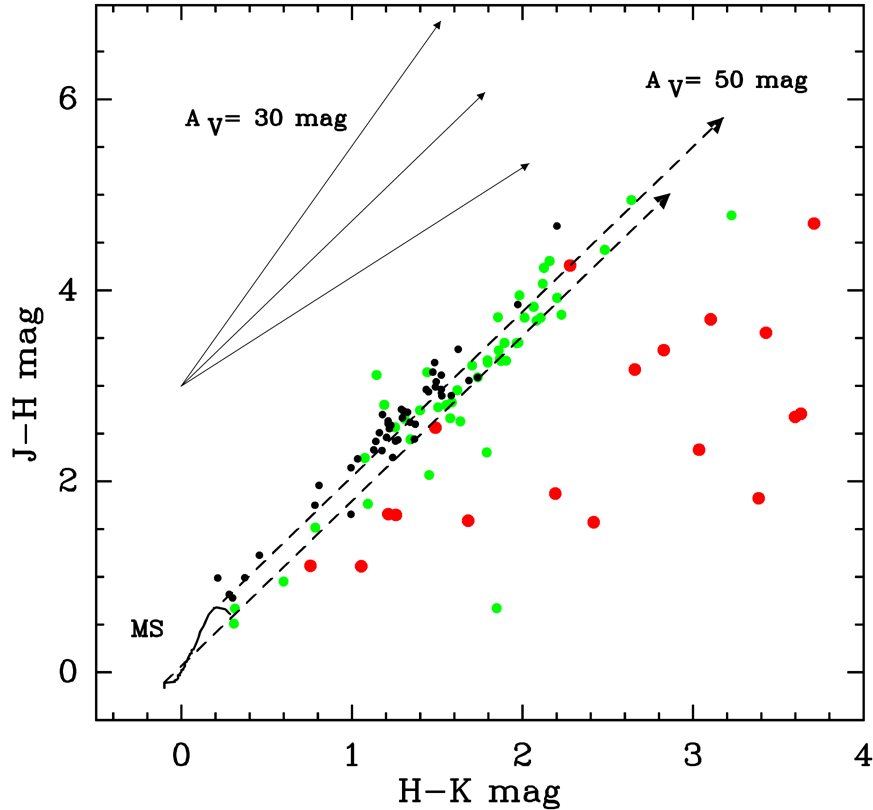
Fig. 7 is the versus diagram for the 112 sources with measured , , and magnitudes. All the Class I sources (identified by our first indicator) exhibit near-IR excesses, and they are nearly the only ones to do so. (The relative amounts of the near-IR excesses is uncertain, as almost all these sources have uncertain 2MASS magnitudes.) The fact that most of the sources previously classified as Class II do not have near-IR excesses is surprising, since in models of Lada & Adams (lad92 (1992)), the hot dust situated in the disk emits in the near-IR. One possible explanation is that the slope of the extinction curve is steeper than that adopted in Fig. 7. For this figure we have used the interstellar extinction law of Indebetouw et al. (ind05 (2005)). According to these authors, and , giving a slope . This range of values is illustrated in Fig. 7, showing that a small increase of the slope would result in a near-IR excess for numerous Class II sources.
The sources with are Class III objects or stars – in the later case mainly evolved stars. Main-sequence stars at the distance of RCW 120 or in the background (thus possibly reddened) should have mag (Martins & Plez mar06 (2006)). Thus all the sources brighter than 5.67 in and with are possibly giants or supergiants. This is compatible with their positions in the versus diagram. One of these sources, #83, is very bright in and lies in the direction of the ionized gas. This star is HD 155275, an M0III star (Houk hou82 (1982); it is identified in Deharveng & Zavagno deh08 (2008)).
Many sources may be affected by a large interstellar extinction. Fig. 7, for example, shows that many stars (black dots) or candidate Class II sources (green dots) may be affected by an (external) extinction between 20 and 40 mag. This extinction may severely affect the classification of the sources. We suggest that some stars or Class III objects, affected by strong extinction, are mistaken for Class II objects by our first indicator. Our first indicator shows a large concentration of stars and Class III and Class II objects at . All the Class II sources which have lie inside the ellipse (showing the location of stars) in Fig. 6. Furthermore, according to their and colours (Fig. 7), all these sources may be evolved stars. Thus most of these stars are probably evolved background stars and not Class II sources.
And the situation is perhaps not better for Class I sources. Fig. 8 presents the [24] versus [8][24] diagram, very similar to the versus [24] diagram of Fig. 5, with the disadvantage of a smaller wavelength range but the advantage of a weaker influence of the extinction. In this diagram unreddened Class I sources have , and Class II sources have . We have kept the same symbols as given by our first indicator. Fig. 8 (left) shows that some sources previously classified as Class I now appear as Class II, and that some sources previously classified as Class II are probably Class III sources or stars.
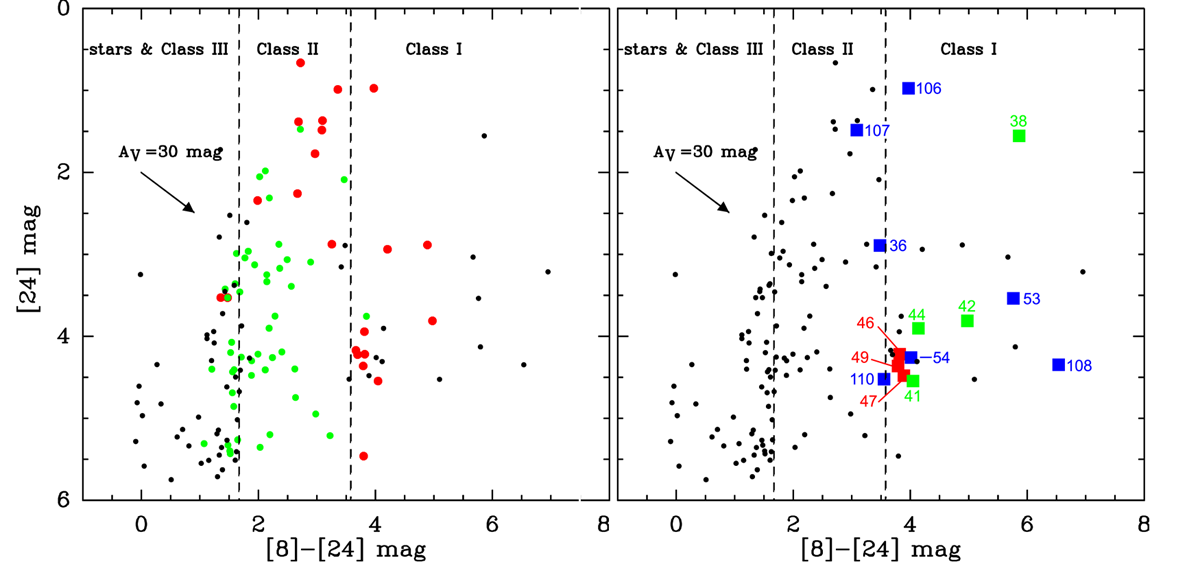
We shall now try to estimate the possible influence of the interstellar extinction on our classifications. We use the 870 m emission to derive a maximum value of this external extinction; we assume that the sources lie in the centres of the dust condensations observed at 870 m in their direction. The extinction is then given by
where is expressed in Jy/beam and the 3 is to correct for a 3 mag underestimate of the extinction using the 870 m map (Sect. 3.2). Fig. 8 (right) gives an idea of the maximum external extinction possibly affecting the sources. It shows that only a few sources are possibly misclassified for this reason. These are mainly sources observed in the direction of the bright condensation 1 (#41, #44, #46, #47, #49, #54) and in condensation 6 (#106, #110) (Sect. 5.3). These sources may be flat spectrum sources. For the other sources, the discrepancy between the classifications given by different indicators is most probably due to difficult photometric measurements. It mainly affects sources lying near the separation limits of the different classes.
Table 1 gives our conclusions concerning the evolutionary stages of the sources. As Class I we include 21 sources satisfying all the indicators ( versus , versus , [24] versus [8][24]) and not affected by too much external extinction. We consider as intermediate Class I–Class II 18 sources which are Class I or Class II depending on the indicator (identified by “I-II?” in column 13 of Table 1), or are possibly flat spectrum sources mistaken for Class I because of a large external extinction (“I-flat?” in Table 1)). We consider as Class II 29 sources satisfying all the indicators, and as intermediate Class II–Class III 9 sources which are Class II or Class III depending on the indicators (“II-III?” in Table1). Note that in Table 1 we have classified as “stars” all the sources dominated by their photosphere, and which we are unable to distinguish: Class III YSOs, MS or evolved stars.
The spatial distribution of the YSOs is presented on Fig. 9 and is discussed in Sect. 5.3.
5 Discussion
5.1 Dust condensations and infrared dark clouds
RCW 120 demonstrates in an exemplary way that massive dust condensations are not all infrared dark clouds. A dense neutral condensation needs to be seen towards a bright background emission to appear as an IRDC. But another necessary condition is to not be located behind bright foreground emission. In the case of RCW 120 the structures that are the most massive (condensations 1 and 2) and the densest (the core in condensation 1, responsible for an extinction mag) are not IRDCs: they are masked by the bright emission of the adjacent foreground PDR. Only their external parts (those far from the IF) appear as faint absorption features (Fig. 3).
5.2 Young stellar objects and AGB stars
Robitaille et al. (rob08 (2008)) present a catalogue of intrinsically red sources, observed by Spitzer, in the Galactic mid-plane. These sources consist mostly of high- and intermediate-mass YSOs and asymptotic giant branch (AGB) stars. As shown by these authors, it is very difficult to distinguish between these two types.
In the following we compare the sources detected at 24 m in the vicinity of RCW 120 with the red sources selected by Robitaille et al. If we apply their selection criteria, i.e. [4.5][8.0], , and , to the 112 sources with [4.5] and [8.0] magnitudes in Table 1, we find 39 sources; 26 of them are Class I or flat spectrum sources, 11 are Class II, and two more are uncertain Class II–Class III.
Robitaille et al. estimate that 19 percent of the red sources may be AGBs. If true, this means that up to seven of our 39 red sources may be AGBs and not YSOs! It is very difficult to distinguish between these two categories if we only have photometric measurements up to 24 m. Robitaille et al. show that YSOs are generally redder than AGBs between 8 m and 24 m, and propose to use the criterion [8.0]-[24] to identify YSOs. Using this criterion we find that 32 of our 39 red sources are probably YSOs (the seven sources with [8.0]-[24] are Class II or uncertain Class II). Thus we must keep in mind in the following that a few of our sources identified as YSOs, and especially Class II YSOs, are possibly AGB stars and are therefore evolved.
5.3 Large scale distribution of the YSOs
We have measured 138 sources around RCW 120 emitting at 24 m. Three are unclassified. Twenty-one are Class I YSOs, and eighteen are possible Class I or flat spectrum sources. Twenty-nine sources are Class II YSOs, and nine sources are more uncertain Class II sources. Thus 49 to 56 percent of the 24 m sources are young stellar objects, 28 percent of the 24 m sources being Class I or flat spectrum sources.
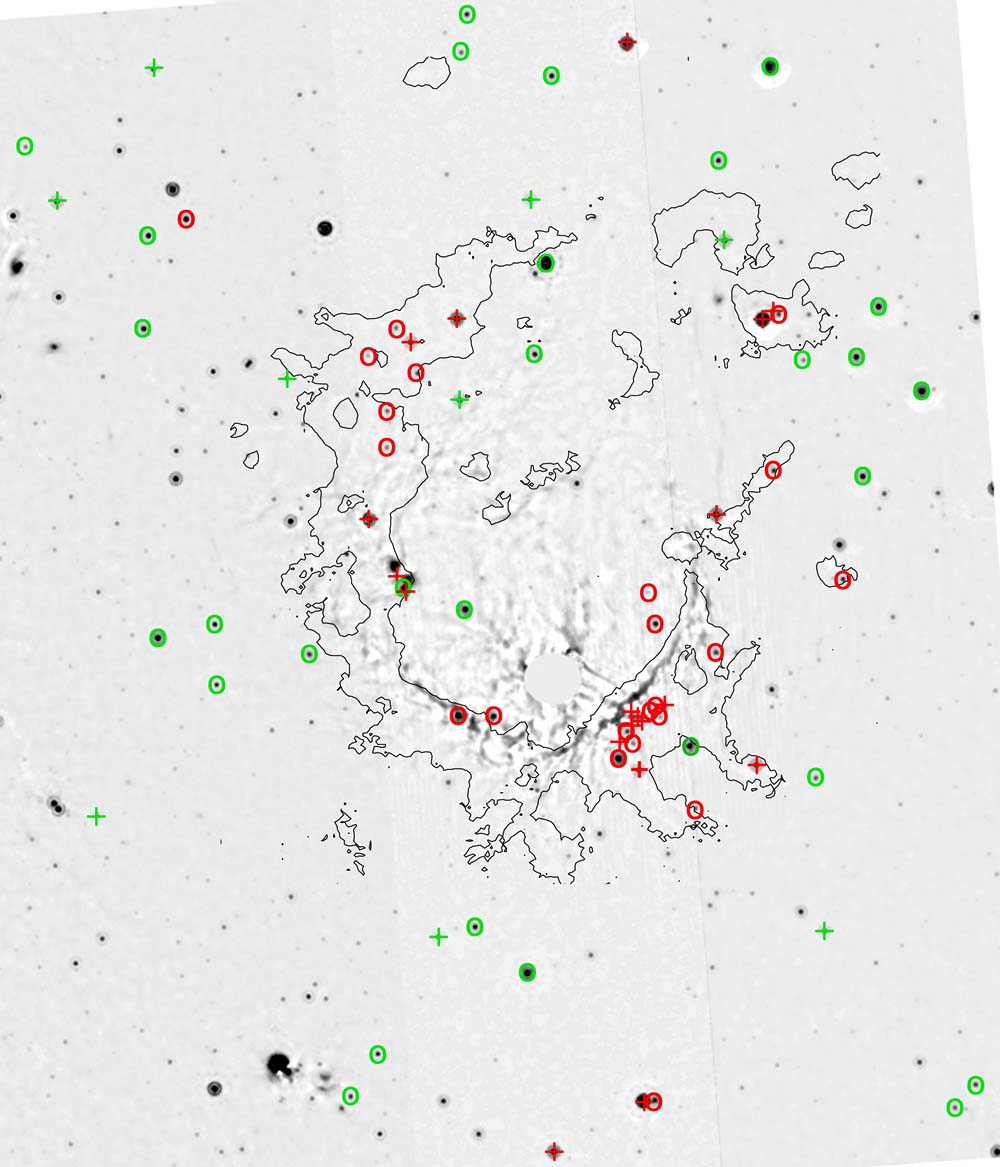
Fig. 9 shows the large-scale distribution of the YSOs possibly associated with RCW 120. It shows a large number of Class I or flat spectrum sources (red symbols), all but five associated with the shell of dense neutral material surrounding RCW 120. Thus even if we have no direct proof that any given YSO is associated with RCW 120, this general picture demonstrates that most of them are associated with the H ii region, and that their formation has been triggered, one way or another, by the H ii region. On the other hand, the Class II sources are more widely scattered over the field. Their association with RCW 120 is less evident, and this raises questions about their origin.
We note the large concentration of Class I or flat spectrum YSOs in the direction of condensation 1, the most massive.
5.4 Stellar content of the condensations
In the following we discuss the YSO content of a few condensations.
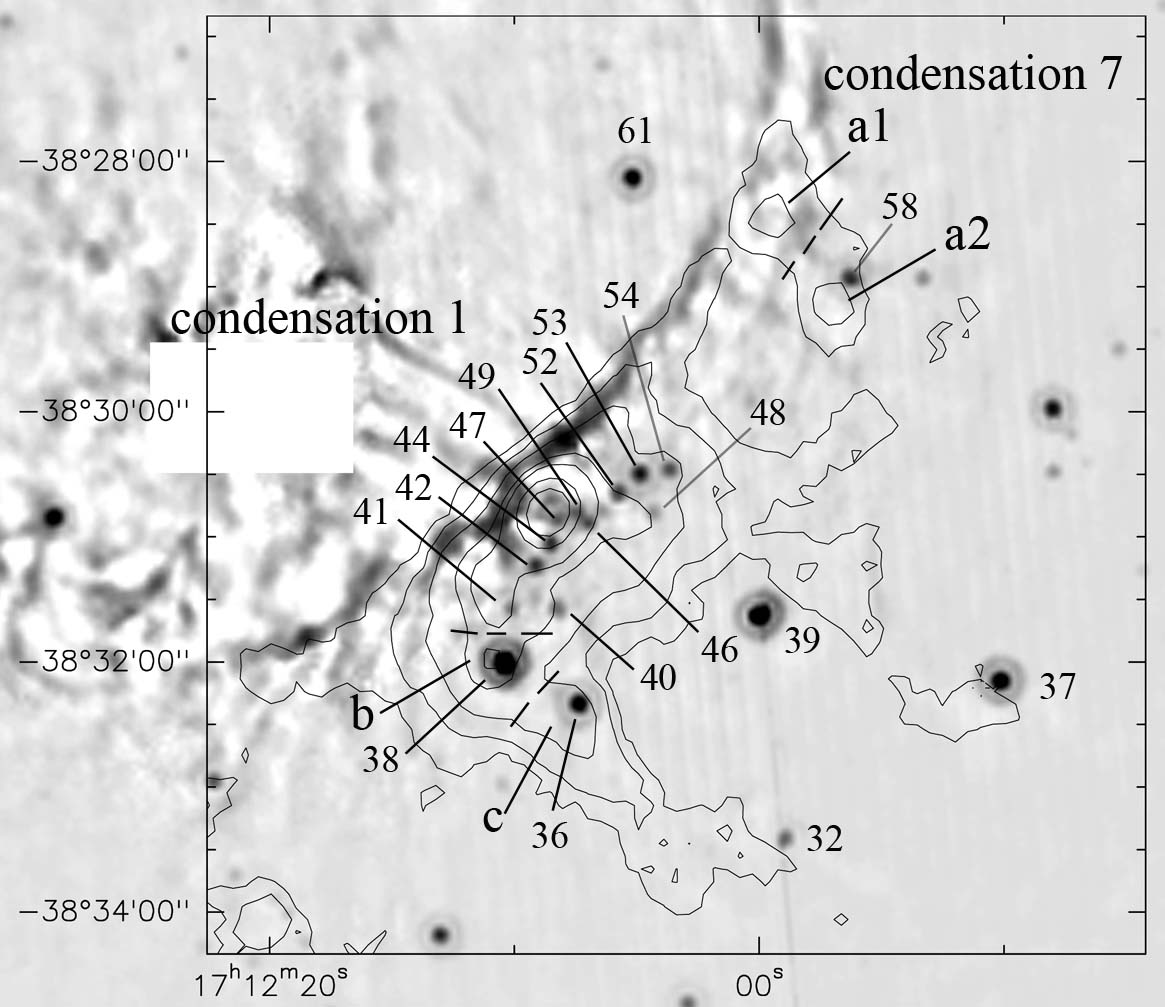
Condensation 1: This is the most massive of the condensations, in the range 460–800 . It contains a very massive core, of 140–250 , and several other bright substructures. Fig. 10 shows this condensation and the numerous 24 m sources observed in its direction or vicinity.
The bright 870 m core has a size (beam-corrected FWHM) of (0.095 pc 0.05 pc), along the IF and perpendicular to it, respectively – thus slightly elongated along the IF. Its size and peak flux indicate a mean density of a few times molecules cm-3. No bright 24 m source is observed in the direction of the 870 m emission peak, but three faint sources (including #47) may be associated with it. The Spitzer-MIPSGAL image at 70 m in Fig. 11 shows an enhancement of the emission in the direction of the core, suggesting that a very deeply embedded object is present here. We measured a flux of 130 Jy for this object, but this is very uncertain due to the underlying emission of the PDR and the low quality of the 70 m image.
According to our indicators, many 24 m sources appear to be Class I YSOs. Among these are #38, which is observed in the direction of a spherical dust clump (b in Table LABEL:massemm and Fig. 10); #58, also observed on the border of clump a2 in condensation 7; and #61, observed in the direction of the ionized gas (but most probably situated behind the H ii region). Sources #36 and #37, also located in projection close to a condensation, are possibly in an intermediate stage between Class I and Class II. The stage of #39 depends on the indicators used, but is probably a Class II. Source #32 has only [4.5] and [24] magnitudes; the slope of its SED suggests a Class I source.
Condensation 1 contains a most remarkable feature: a chain of eleven 24 m sources. They are aligned parallel to the main IF and are regularly spaced, separated by some 0.1 pc. They are deeply embedded. Sources #42 and #53 are Class I. Sources #41, #44, #46, #47, #49, and #54 lie near the separation between Class I and Class II and may be flat spectrum sources as they may be affected by a large external extinction (cf. Fig. 8). Measurements lack for #40, #48, and #52; the slopes of their SEDs suggest Class I sources.
We have fitted the SEDs of a few sources using the Web-based SED fitting-tool of Robitaille et al. (rob07 (2007); http://caravan.astro.wisc.edu/protostars/). The parameters of the best model, as well as a range of possible values for some parameters, are given in Table LABEL:models. YSO #38 is a stage I source, with a central object of a few solar masses; condensation b is probably not the source’s cold envelope since its flux density at 870 m is too large. Source #61 is also in stage I, with a central object of a few tenths of a solar mass. For sources #53 and #49, most of the models indicate that they are stage I sources around central objects of about one solar mass, and with massive disks; but a few of the good models (those with ) show central objects with a higher mass, no accreting envelopes, and massive disks, hence corresponding to stage II sources.
The chain of sources aligned along the IF, and regularly spaced, indicates that star formation has occurred in the collected layer, probably resulting from gravitational instabilities along a dense filament. At a temperature of 20 K and a density of 105 molecules per cm3, gravitational instabilities form cores separated by the Jeans length pc, and with the Jeans mass . This is probably what has occurred inside condensation 1. On the other hand the formation of the very massive and dense core may result from the collect and collapse process, i.e. from large-scale gravitational instabilities along the surface of the collected shell. Here again triggered star formation is probably at work, as shown by the presence of a very deeply embedded source – hence a Class 0 YSO – only detected at 70 m.
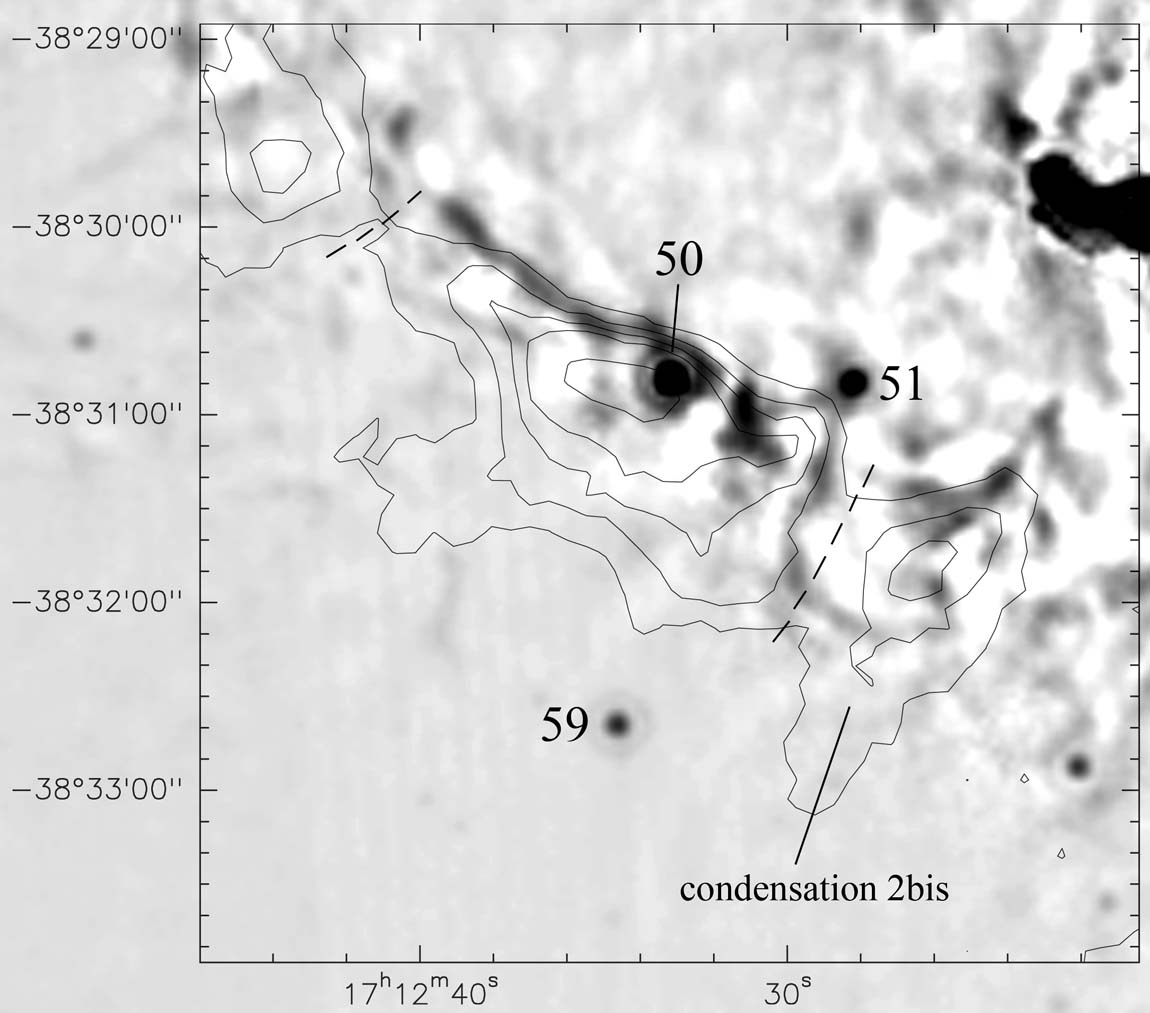
Condensation 2: This lies at the south-east border of RCW 120, adjacent to the main IF. Its mass is in the range 110–290 (not including the elongated structure which we call condensation 2bis in Fig. 12). Its peak column density corresponds to a visual extinction 32 mag. The YSO #50 lies at less than 0.03 pc (in projection) from the peak direction.
This source has no near-IR emission (in the 2MASS survey), and no measured 8.0 m flux, hence does not appear in our diagrams. However the slope of its SED between 3.6 m and 24 m is between 2.0 (without extinction correction) and 1.3 (correcting for a visual extinction of 32 mag). Thus source #50 is a Class I object. It lies very close to the IF, which is probably the reason why we do not detect it at 70 m.
Source #51 lies at the top of a “finger”, a structure of the IF protruding inside the ionized gas, and pointing towards the exciting star. This finger, which is seen south-west of condensation 2, is an elongatd dust filament. Another such structure lies nearby, which we have called condensation 2bis (Fig. 12). ZA07 proposed that these structures result from dynamical instabilities of the expanding IF, such as these simulated by García-Segura & Franco (gar96 (1996)). These structures are found towards a gap between condensations 1 and 2, through which the ionized gas tries to flow away from the central H ii region (a region thus dynamically unstable). An alternative origin is possible. These two “fingers” are reminescent of the “pillars” in M16, with Class I & II YSOs located at their tops (Sugitani et al. sug02 (2002), Indebetouw et al. ind07 (2007) and references therein). The pillars in M16 clearly result from the interaction of NGC 6611’s OB stars’ UV radiation with pre-existing dense clumps. However, as shown by the molecular observations of White et al. (whi99 (1999)), most of the mass of the pillars is located in their heads rather than their tails, whereas the contrary is observed in RCW 120’s fingers (at least in condensation 2bis). Thus the origin of the fingers and of YSO #51 is uncertain; higher angular resolution observations are needed.
Our indicators show that YSO #51 is possibly a Class I object. Its SED, modelled by the Robitaille et al. fitting tool, confirms this conclusion. The best model indicates a central object of 1.3 with a massive disk but, however, with an accreting envelope, hence a stage I-stage II object. Several parameters are rather uncertain, but the disk is massive in all the models (Table LABEL:models).
Finally the other YSO of the field, #59, is clearly a rather massive stage II-stage III source. It is well fitted by a central object of 6.6 , a small disk, and no envelope (Table LABEL:models). Its association with RCW 120 is uncertain.
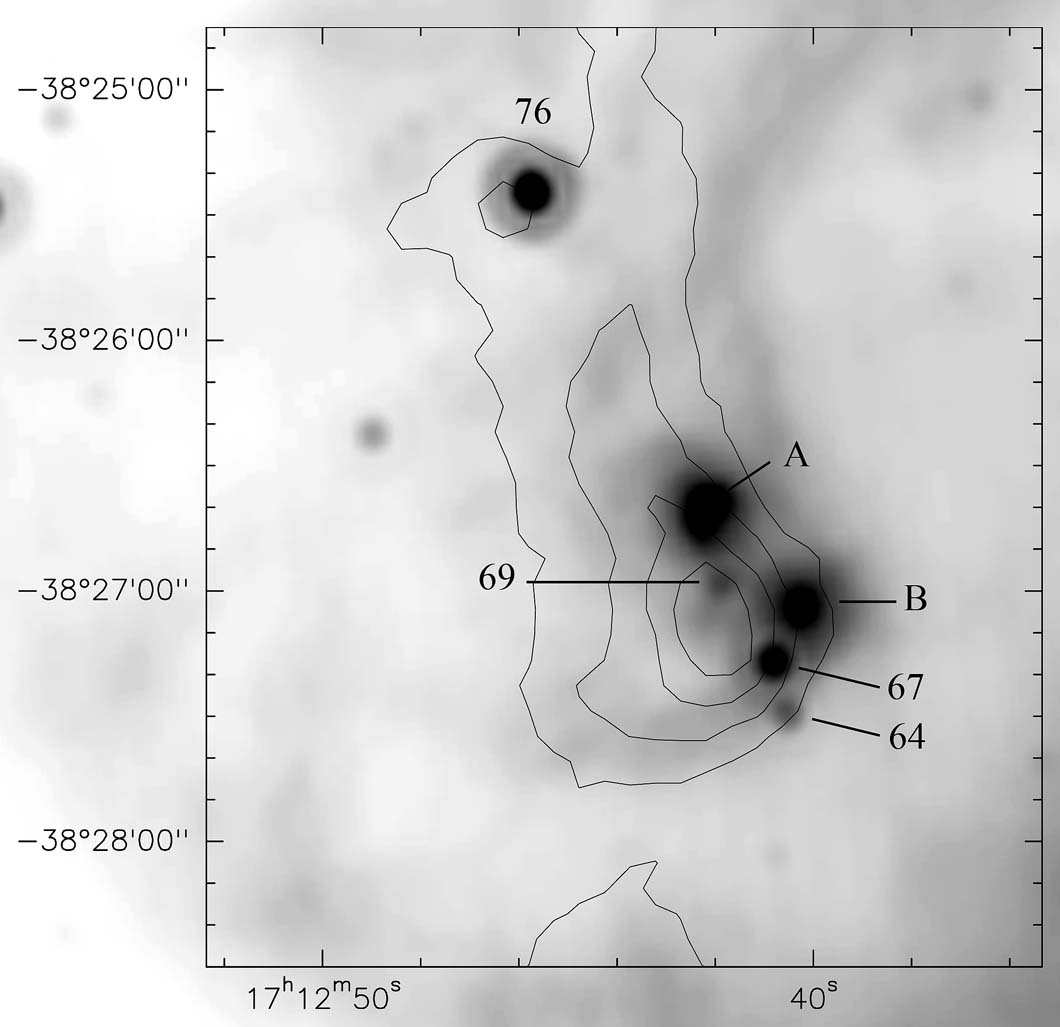
Condensation 4: This is elongated along the IF but protrudes inside the ionized region. Its mass is between 50 and . Fig. 13 shows that several 24 m sources are detected in its vicinity, but that none is observed in the exact direction of the 870 m emission peak. However all three sources (#64, #67, and #69) lie on the border of the condensation facing the ionized gas and have near-IR counterparts. Our indicators show that #64 is intermediate between Class I and Class II, and that #67 is a Class II. Source #69 has no measurement at 8.0 m, so it is not in our diagrams, but the slope of its SED between 3.6 m and 24 m lies between 0.4 (uncorrected for extinction) and 0.1 (assuming mag, corresponding to the 870 m column density in its direction); thus source #69 is probably intermediate between Class I and Class II.
We have used the Robitaille et al. SED fitting tool to model source #67. The result confirms our previous conclusion. The parameters of the best model are given in Table LABEL:models. This source contains a central object of mass . Many of the good models have no accretion from an envelope. Thus this source is most probably a stage II, but the mass of the disk is very uncertain.
Two regions of extended emission at 8.0 m also lie on the border of condensation 4. ZA07 suggested that they were PDRs around Herbig Ae/Be stars. Emission from these PDRs is also observed at 24 m. Their central stars have been observed by 2MASS; their near-IR photometry suggests a B4V star affected by a visual extinction of 7.8 mag (object A in Fig. 13, or object 1 in ZA07), and a B7V star with an extinction of 12.2 mag (object B in Fig. 13, or object 2 in ZA07). These stars are probably the most massive of the sources associated with condensation 4.
ZA07 proposed that condensation 4 was a pre-existing dense clump which became surrounded by ionized gas during the expansion of the H ii region. Star formation is observed at its borders and not at its centre. Thus star formation is probably not due to the clump implosion (which is predicted by the radiation-driven implosion models; Lefloch & Lazareff lef94 (1994), Kessel-Deynet & Burkert kes03 (2003)).
Fig. 13 shows the presence of a small spherical clump north of condensation 4, with a mass in the range 5–9 . A bright 24 m YSO, #76, coincides with this clump to within the uncertainties (about 0.015 pc in projection). The evolutionary stage of #76 is uncertain: our indicators point to Class I or Class II. But most of the SED models have no accreting envelope, suggesting stage II.
Condensation 5: This is a group of structures emitting at 870 m on the north-east border of RCW 120 (Fig. 14). Its mass is in the range 130–225 . It contains several small spherical dust clumps in the direction of which YSOs are observed: clump a, of mass 15–26 , possibly associated with #107; clumps b1 + b2, of total mass 11–19 , possibly associated with #105 and #103. Clump c, of mass 6–11 , possibly associated with #88, lies outside condensation 5.
Numerous 24 m sources lie in the field of Fig. 14. According to our indicators, sources #88, #91 and #97 are Class I YSOs; sources #103 and #107 are probably intermediate between Class I and Class II; #102 is a Class II; and #92 is intermediate between Class II and Class III. Magnitudes are missing for three sources; we have used the slope of the SED between 3.6 m and 24 m to classify them. Sources #101 and #105 have strongly rising SEDs (slopes 1.9 and 1.6 respectively) characteristic of Class I. Source #114 is a Class II source (decreasing slope of ). The nature of #113 is very uncertain, probably because it lies too close to the very bright #114.
We have used the Robitaille et al. SED fitting tool to model the SEDs of #88 and #105. The parameters of the best fit model are given in Table LABEL:models. These two sources are rather similar, in an evolutionary stage I, with a massive disk. We tried to model #103 and #107 but the results are very uncertain (both stage I and stage II are obtained); far-IR measurements are clearly needed to constrain their SEDs.

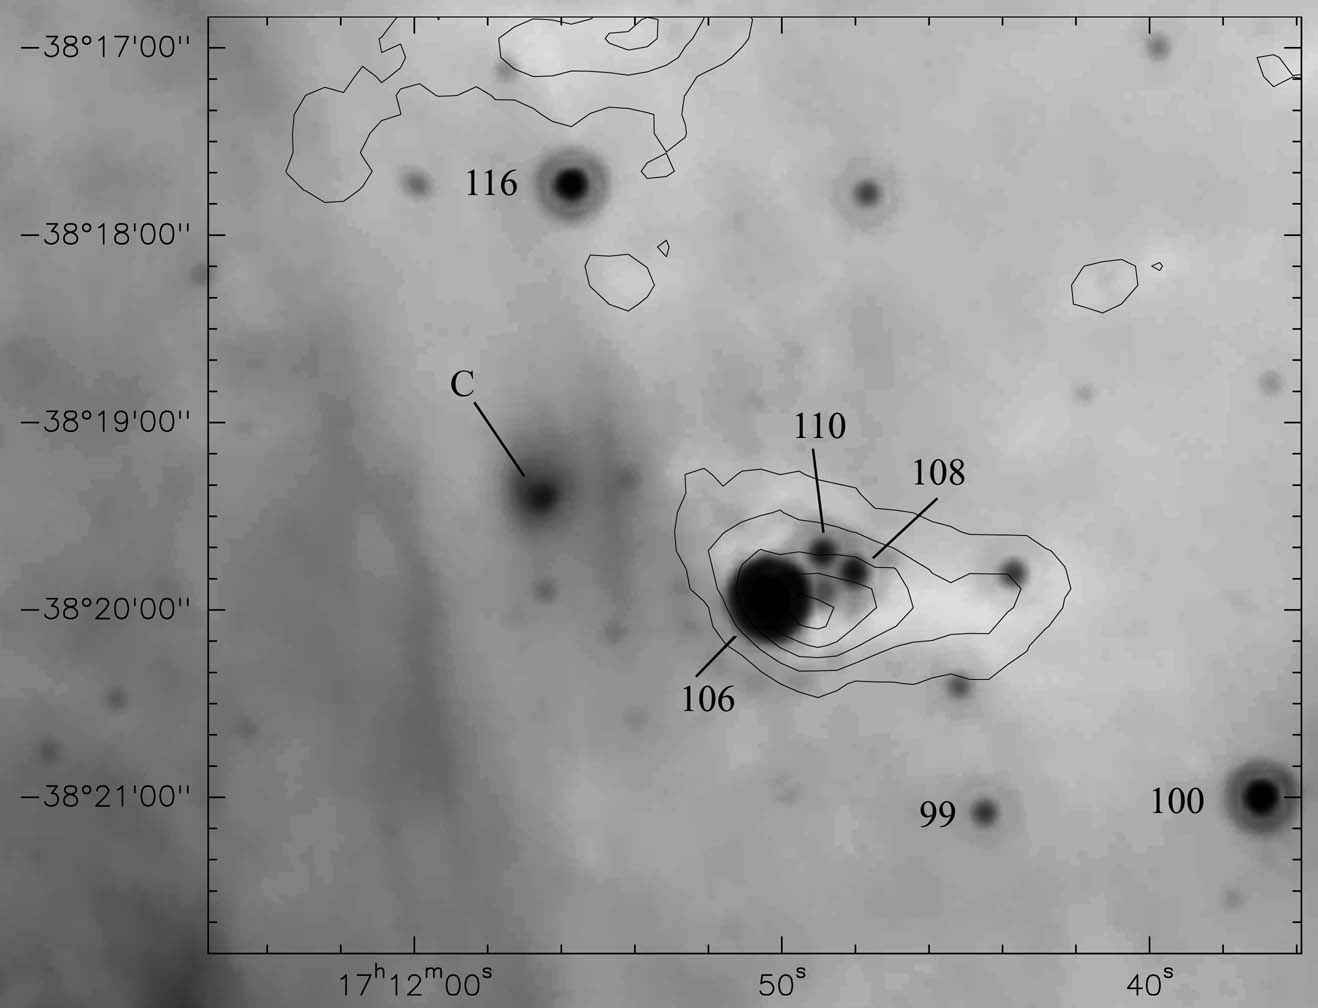
Condensation 6: This lies on the north-west border of RCW 120, apparently far from the main IF. However a north-south 24 m filament, probably tracing the emission of dust in the PDR, is seen adjacent to this condensation (Fig. 15). Also, diffuse H emission is observed nearby (Fig. 2). Thus this condensation is submitted to the pressure of the ionized gas. Its mass is in the range 52–90 ; its peak column density corresponds to a visual extinction of 18 mag. It appears as an IRDC on both the 8.0 m and 24 m images.
Fig. 15 shows the 870 m emission contours superimposed on the 24 m image. Condensation 6 contains a small cluster of at least three YSOs, separated by 0.17 pc (in projection). YSO #106, very bright at 24 m (possibly saturated), is also detected at 70 m; it lies 0.08 pc away from the dust emission peak. All the indicators show that these three YSOs are Class I (#108) or flat spectrum sources (#106, #110).
We tried to model the SED of object #106 using the Robitaille et al. fitting tool. The evolutionary stage of this source is uncertain: the best model, with a central object of mass and an accreting envelope, corresponds to stage I (Table LABEL:models), but other good models have more massive central objects and no accreting envelopes, and thus correspond to stage II sources.
The other stars in the field of Fig. 15 are Class II (#99, #100) or intermediate Class II–Class III (#116). Fig. 15 also shows a small faint region of 24 m extended emission which we call region C. Its central star has 2MASS magnitudes (, , ) corresponding to a B9V star with a visual extinction of the order of 6.1 mag. We suggest that the extended 24 m emission comes from a PDR excited by this star. Region C and its exciting star are very similar to regions A and B in condensation 4, which we believe to be second-generation objects.
| YSO | comment | |||||
|---|---|---|---|---|---|---|
| () | (K) | () | () | () | ||
| #38 | 3.2 | 4350 | 2.4 10-3 (10-3–10-1) | 1.7 10-4 | 98 | stage I |
| #61 | 0.3 | 3370 | 4.3 10-2 | 7.3 10-5 | 20 | stage I |
| #51 | 1.3 | 4355 | 6.3 10-2 | 1.8 10-6 (10-6–10-4) | 17 | stage I-II |
| #59 | 6.6 | 19700 | 1.0 10-5 (10-5–10-4) | 0 | 1320 | stage II-III |
| #67 | 5.1 | 7554 | 1.7 10-3 (10-5–10-1) | 2.2 10-7 | 280 | stage II |
| #88 | 4.1 | 4400 | 4.4 10-2 (10-3–10-1) | 3 10-4 | 130 | stage I |
| #105 | 1.7 | 4200 | 4.5 10-2 (10-3–10-2) | 6 10-4 | 38 | stage I |
| #106 | 2.0 | 4160 | 2.210-1 | 1.2 10-5 | 105 | uncertain |
5.5 The structure of the PDR and the long-distance influence of the H ii region
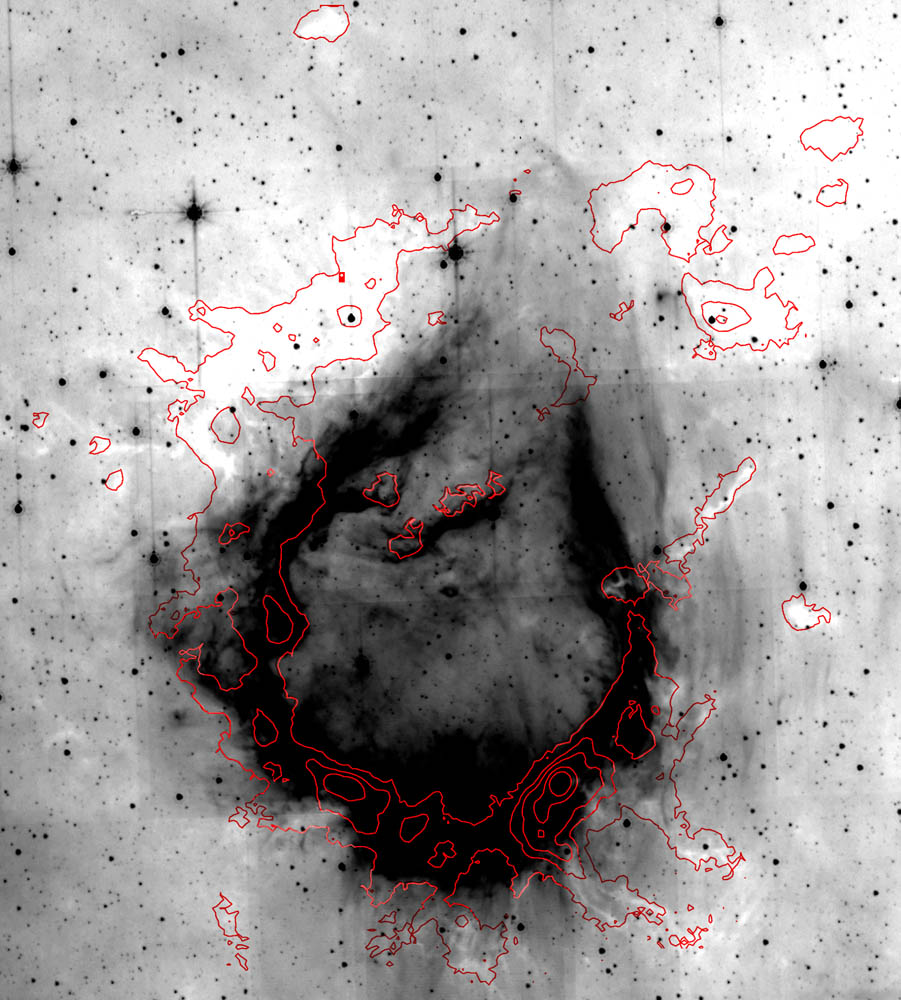
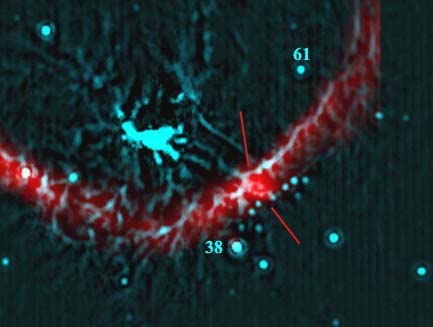
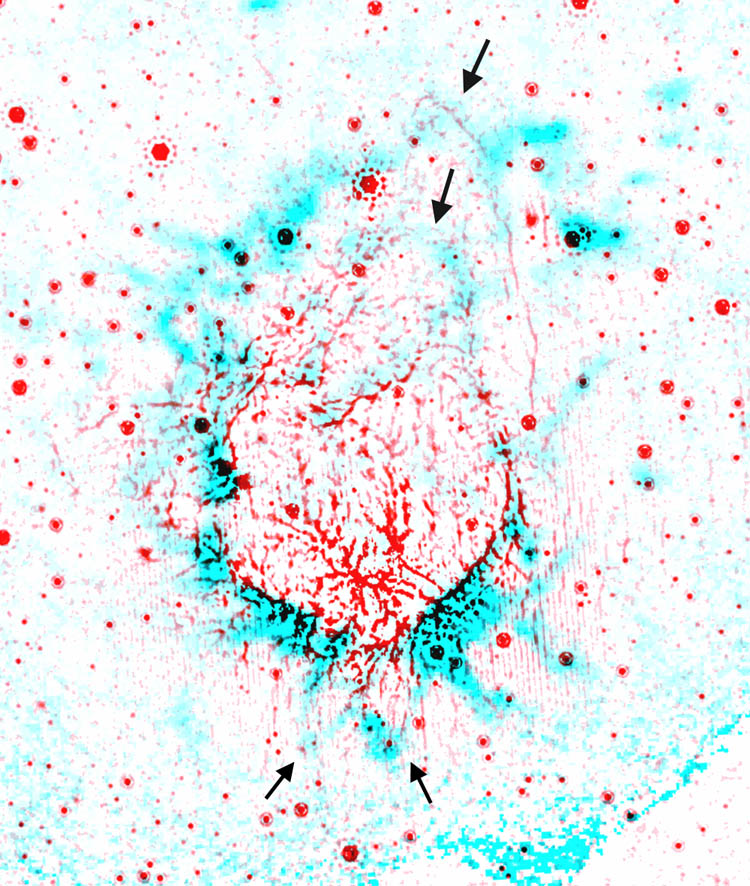
At first glance RCW 120 appears to be a perfect spherical bubble. However, as stressed by ZA07, the ionized gas is trying to flow out of the bubble, and consequently the H ii region is elongated towards the north, where the surrounding interstellar medium is of lower density. This morphology is delineated by the shape of the ionization front and by that of the low intensity 870 m emission zones, as shown in Fig. 16, a composite image of the 870 m emission in turquoise and of an unsharp-masked image at 24 m in red. The unsharp masking emphasizes the small-scale structures of the 24 m emission, both in the ionized gas and in the PDR. The black arrows at the top of Fig. 16 point to low intensity 870 m emission zones which close the northern extension of the ionized bubble; these zones are associated with 24 m filaments in the adjacent PDR. The upper arrow shows that a low intensity 870 m emission region joins condensation 5 and condensation 9. Here again we are observing the layer of neutral material collected around the ionized region.
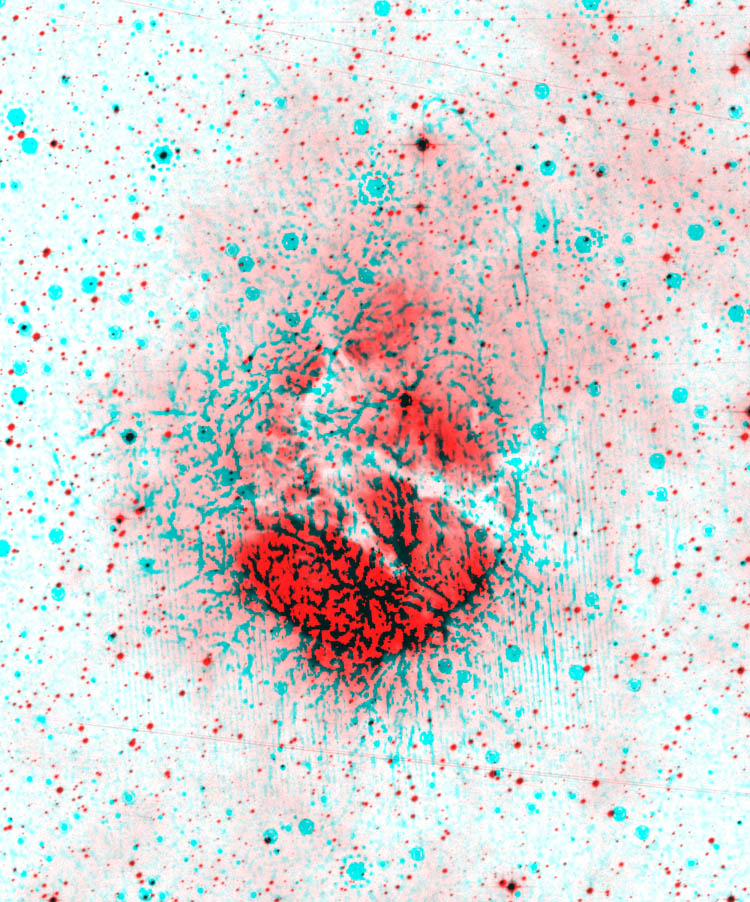
Fig. 17 shows the extent of the PDR. This is a colour composite image of the H emission, in red, and of the unsharp-masked image at 24 m in turquoise. We see in red the H emission of the ionized gas inside the bubble, and in pink a zone of diffuse low intensity H emission from the PDR surrounding the bubble. This ionized PDR is extended. The unsharp-masked image at 24 m shows the structures of the dust emission from the PDR, covering about the same zone as the diffuse H emission. The ionized PDR extends over an area with about twice the radius of the central H ii region. As stressed by ZA07, the IF is porous, and the ionizing radiation escapes to the outside through small holes. This ionized PDR is probably of low density, but its existence demonstrates the long-distance influence of the H ii region and its central exciting star.
The 870 m emission map shows radial features inside condensation 5 and also in the southern parts of RCW 120; there two bubbles are observed between condensations 1 and 2 (see the black arrows at the bottom of Fig. 16). Fig. 4 shows, at 8.0 m and with a high resolution, the radial structures inside condensation 5; only the pressure of the ionized gas seems able to form filaments perpendicular to the IF.
Thus star formation can probably be triggered far from the ionization front – for example in condensation 6, which is in contact with the extended PDR.
5.6 An unanswered question
A question raised by ZA07 remains unanswered: what is the three-dimensional geometry of the RCW 120 bubble? Is there a preferential plane for the accumulation of neutral material during the expansion of RCW 120? We have identified only two Class I sources in the direction of the ionized gas (#61 and #65), whereas more should be observed if star formation is at work in a spherical collected shell. According to the simulations of Krumholtz et al. (kru07 (2007)), the presence of a magnetic field inhibits motion of the gas across magnetic field lines, leading to a concentration of collected material in a preferential plane. This point, important for the study of star formation triggered by H ii regions, will possibly be addressed via submillimetre polarimetric observations.
6 Conclusions
In this paper we present new observations, obtained with the APEX-LABOCA camera, of the thermal dust emission at 870 m. The higher angular resolution and signal-to-noise ratio of these observations, compared to the previous 1.2-mm observations, allow the detection of low brightness structures and permit more accurate mass estimates. The observations confirm the presence of a shell of dense neutral material collected around the ionized region during its expansion. This shell is now observed all around RCW 120, even at the border of its northern extension. The shell’s mass is greater than 2000 ; we confirm that it is fragmented, with massive fragments of a few tens or hundreds of solar masses. We also confirm that a very massive () and compact (0.095 pc 0.05 pc) core lies adjacent to the ionization front in the most massive fragment.
We present and discuss mid-IR observations at 24 m and 70 m, obtained by Spitzer-MIPSGAL. We have measured 138 sources at 24 m and six at 70 m. These observations provide new indicators to better distinguish between stars and YSOs, and to better distinguish between the evolutionary stages (Class I or Class II) of the sources. Robitaille et al. (rob06 (2006)) have shown the uncertainties tainting these classifications. RCW 120 is a good illustration of the difficulty of this study. The main uncertainty is due to the objects’ external extinction, which is not known; highly reddened stars can be mistaken for Class II sources, and highly reddened Class II sources for Class I sources. We have used the 870 m emission to determine the maximum external extinction which may affect a given 24 m source.
We have detected 21 Class I sources, 18 sources possibly intermediate between Class I and Class II, 29 Class II sources, and nine more uncertain Class II–Class III sources. A large fraction of the Class I or intermediate Class I–Class II sources are observed in the direction of the shell of collected neutral material surrounding the ionized region. This distribution demonstrates that their formation has been triggered by the expanding H ii region.
As stressed by ZA07, we believe that several different mechanisms are at work simultaneously to form stars in the collected layer. The mechanisms that we tentatively identify are small-scale gravitational instabilities in condensation 1, dynamical instabilities of the IF in condensation 2, and interaction of the IF with a pre-existing molecular condensation in condensation 4. The collect & collapse process, which implies large-scale gravitational instabilities of the collected layer along its surface, is possibly at work in the dense core of condensation 1, which harbours a source detected only at 70 m. High-resolution kinematic observations are necessary to ensure that a Class 0 source is present there, building its mass by accreting material in the dense core; enough mass is present there ( ) to allow the formation of a massive star.
We have also detected, at 24 m, in the direction of condensation 1, a very unusual and remarkable feature: a chain of about eleven Class I or flat spectrum sources, parallel to the IF. These YSOs have approximately solar masses, and are regularly spaced by some 0.1 pc. To our knowledge it is one of the best illustrations ever found, in the domain of star formation, of the Jeans gravitational instability at work.
Finally, we have shown that the H ii region, via the UV radiation of its central exciting star, has a long distance influence upon its surrounding medium. If is the radius of the H ii region, the low density ionized PDR, and the associated dust emitting at 24 m, extends a further outward from the IF. This influence is also reflected by the shape of the collected layer, which shows radial features and bubbles. We conclude that the H ii region can probably trigger star formation far from the IF. This remains to be confirmed by other examples of H ii regions.
Acknowledgements.
We thank the APEX staff for their support during the observations with LABOCA, and A. Beelen who performed the first reduction of the data. We thank the anonymous referee for his suggestions and comments. This research has made use of the SIMBAD data base, operated at CDS, Strasbourg, France, and of the interactive sky atlas Aladin (Bonnarel et al. bon00 (2000)). This work is based in part on observations made with the Spitzer Space Telescope, which is operated by the Jet Propulsion Laboratory, California Institute of Technology, under contract with NASA. We have made use of the NASA/IPAC Infrared Science Archive to obtain data products from the 2MASS, Spitzer-GLIMPSE and Spitzer-MIPS surveys.References
- (1) Allen, L.E., Calvet, N., D’Alessio, P., et al. 2004, ApJS, 154, 363
- (2) Avedisova, V.S., & Kondratenko, G.I. 1984, Nauchnye Informatsii, 56, 59
- (3) Benjamin, R.A., Churchwell, E., Babler, B.L., et al. 2003, PASP, 115, 953
- (4) Bohlin, R.C., Savage, B.D., & Drake, J.F. 1978, ApJ, 224, 132
- (5) Bonnarel, F., Fernique, P., Bienayme, O., et al. 2000, A&ASS, 143, 33
- (6) Carey, S.J., Noriega-Crespo, A., Price, S.D., et al. 2005, BAAS, 37, 1252
- (7) Churchwell, E., Povich, M. S., Allen, D., et al. 2006, ApJ, 649, 759
- (8) Deharveng, L., Zavagno, A. 2008, Handbook of Star Forming Regions, Vol. II, B. Reipurth, ed.
- (9) García-Segura, G., & Franco, J. 1996, ApJ, 469, 171
- (10) Henning, Th., Michel, B., Stognienko, R. 1995, P&SS, 43, 1333
- (11) Hildebrand, R.H. 1983 Q.Jl. R. astr. Soc., 24, 267
- (12) Houk, N. 1982, (Michigan Catalogue of Two-dimensional Spectral Types for the HD stars), Vol. 3 (Ann Arbor: Univ. Michigan)
- (13) Indebetouw, R., Mathis, J.S., Babler, B.L., et al. 2005, ApJ, 619, 931
- (14) Indebetouw, R., Robitaille, T.P., Whitney, B.A., et al. 2007, ApJ, 666, 321
- (15) Johnstone, D., Matthews, H., Mitchell, G.F. 2006, ApJ, 639, 259
- (16) Kessel-Deynet, O., Burkert, A. 2003, MNRAS, 338, 545
- (17) Kirk, H., Johnstone, D., Di Franchesco, J. 2006, ApJ, 646, 1009
- (18) Krumholz, M.R., Stone, J.M., Gardiner, T.A. 2007, ApJ, 671, 518
- (19) Lada, C.J., & Adams, F.C. 1992, ApJ, 393, 278
- (20) Lefloch, B., Lazareff, B. 1994, A&A, 289, 559
- (21) Martins, F., Plez, B. 2006, A&A, 457, 637
- (22) Motte, F., Schilke, P., Lis, D.C. 2003, ApJ,582, 277
- (23) Ossenkopf, V., Henning, T. 1994 A&A, 291, 943
- (24) Parker, Q.A., Phillipps, S., Pierce, M. J., et al. 2005, MNRAS, 362, 689
- (25) Rebull, L.M., Stapelfeldt, K.R., Evans II, N.J., et al. 2007, ApJSS, 171, 447
- (26) Rieke, G. H., & Lebofsky, M. J. 1985, ApJ, 288, 618
- (27) Robitaille, T.P., Whitney, B.A., Indebetouw, R., & Wood, K., Denzmore, P. 2006, ApJS, 167, 256
- (28) Robitaille, T.P., Whitney, B.A., Indebetouw, R., & Wood, K. 2007, ApJS, 169, 328
- (29) Robitaille, T.P., Meade, M.R., Babler, B.L. et al. 2008, astro-ph/0809.1654v1
- (30) Siringo, G., Weiss, A., Kreysa, E., et al. 2007, The Messenger, 129, 2
- (31) Stetson, P.B. 1987, PASP, 99, 191
- (32) Sugitani, K., Tamura, M., Nakajima, Y., et al. 2002, ApJ, 565, L25
- (33) Tokunaga, A.T. 2000, Allen’s Astrophysical Quantities, 4th edition, ed. A.N. Cox, Springer-Verlag (New York), p. 143
- (34) Vig, S., Testi, L., Walmsley, M., et al. 2007, A&A, 470, 977
- (35) White, G.J., Nelson, R.P., Holland, W.S., et al. 1999, A&A, 342, 233
- (36) Whitney, B.A., Wood, K., Bjorkman, J.E., Wolff, M.J. 2003a, ApJ, 591, 1049
- (37) Whitney, B.A., Wood, K., Bjorkman, J.E., Cohen, M. 2003b, ApJ, 598, 1079
- (38) Whitney, B.A., Indebetouw, R., Bjorkman, J., Wood, K. 2004, ApJ, 617, 1177
- (39) Young, C.H., Shirley, Y.L., Evans II, N.J. 2003, ApJSS, 145, 111
- (40) Zavagno, A., Pomarès, M., Deharveng, L., et al. 2007, A&A, 472, 835 (ZA07)