Long term stability of the energy of conversion electrons emitted from solid 83Rb/83mKr source
Abstract
The mono-energetic conversion electrons from the decay of 83mKr represent a unique tool for the energy calibration, energy scale monitoring and systematic studies of the tritium beta spectrum measurement in the neutrino mass experiment KATRIN. For this reason, the long term stability of energy of the 7.5 keV and 17.8 keV conversion electrons populated in the decay of solid 83Rb/83mKr vacuum evaporated sources was examined by means of two electron spectrometers.
keywords:
Nuclear transition energy; Conversion electron; Electron spectrometer; Rubidium-83; Krypton-83m; Neutrino mass.PACS:
14.60.Pq; 23.20.Nx; 27.50.+e 29.30.DnREPORT NPI ASCR ŘEŽ, EXP-01/2009
,
,
,
,
,
,
,
,
,
,
1 Introduction
The knowledge of the absolute value of neutrino mass is crucial for understanding the fermion masses. Moreover, massive neutrinos and their properties play an important role in astrophysics and cosmology for explaining the hot dark matter. Current upper limits ascribed to the effective neutrino mass, , 2 eV/ (95% C.L.) published by the particle data group [1] is based on the limits from the tritium -decay experiments performed in Mainz [2] — 2.3 eV/ and in Troitsk [3] — 2.1 eV/. With respect to the great importance of knowledge of the neutrino mass a next generation tritium -decay experiment KATRIN (KArlsruhe TRItium Neutrino experiment) is being built [4]. The aim of the project is to determine or its upper limit with the 0.2 eV/ (90% C.L.) sensitivity after full three years of data taking.
The KATRIN experimental setup consists of several components: windowless gaseous tritium source with differential pumping and cryosorption sections, pre- and main electrostatic retarding spectrometers, detector for counting and monitoring electron spectrometer. The spectrometers of MAC-E-Filter (Magnetic Adiabatic Collimation Electrostatic Filter) type will work as electrostatic filters — all electrons with the energy high enough to overcome the electric potential set can be detected. The pre-spectrometer with suitably pre-set electric potential will prevent huge amount of low energy electrons from tritium decay (carrying no information about the neutrino mass) to enter the main spectrometer and thus causing undesirable background. As a primary result, the integral beta spectrum measured by main spectrometer will be recorded. The narrow range of (-30,+5) eV around the 18575 eV endpoint of the tritium -spectrum will be inspected in detail as it is most sensitive region to neutrino mass [4]. The reliable determination of the neutrino mass squared from fit of the theoretical -spectrum to measured one does not require a precise knowledge of the absolute retarding voltage applied to the main spectrometer. However, the numerical calculations have shown that an unrecognized smearing and/or a shift of the retarding voltage by mV would result in systematic error of the fitted neutrino mass by eV which is a non-negligible part of the expected KATRIN sensitivity of 0.2 eV [4, 5]. The energy spectrum is scanned by varying low voltage applied to the tritium source. The low voltage can be precisely measured by modern voltmeters. The long term monitoring of the high retarding potential of 18.6 kV at a level of about mV in 2 months ( ppm in 2 months) represents a challenge. For this reason the KATRIN retarding voltage will be measured by two methods. As the first method the standard procedure will be applied — a high-precision voltmeter together with a high voltage resistance divider, directly attached to the main spectrometer retarding potential [6]. The second method will use a monitoring spectrometer principally of the same type as KATRIN main spectrometer - upgraded Mainz neutrino mass spectrometer MAC-E-Filter. The retarding voltage of both the monitoring and main spectrometers will be common (from the same power supply). The monitoring spectrometer will be equipped with a source of mono-energetic electrons the energy of which will be stable and close to the tritium endpoint energy. The measurement of the spectrum will be provided by means of scanning low voltage power supply attached to the source itself. Any change of the energy of mono-energetic electrons measured on the monitoring spectrometer will indicate a possible change of the common retarding voltage.
The conversion electrons of the 9.4 and 32.2 keV transitions of the isomeric state of 83mKr proved to be useful for the calibration and systematic studies in previous tritium neutrino experiments as described in [7, 8, 9, 10, 11]. Particularly, the energy of K conversion electrons of the 32 keV transition for free krypton atom (denoted as K-32) of eV [12] is rather close to the tritium endpoint. In those tritium experiments gaseous and condensed 83mKr sources were utilized. The new condensed source had to be prepared every few hours due to 1.83 h half life of 83mKr. To overcome this, a not easy technique of continuously condensed krypton source was suggested and tested [13]. From this point of view a solid source 83Rb/83mKr would be advantageous — its lifetime is governed by the half life of 83Rb amounting to 86.2 d. It seems that the 83Rb/83mKr source could be used as the calibration source of KATRIN in the monitoring spectrometer. On the other side, the more complex condensed 83mKr source, which was proven to be able to provide long-term stability, will be used for less-frequent calibrations of the KATRIN main spectrometer.
The vacuum evaporated solid 83Rb/83mKr sources on aluminium backing were successfully used in Auger and conversion electron measurements with the electrostatic spectrometer in Dubna [14, 15]. These sources are physico-chemically stable both in vacuum and air for several months. The energy of the K-32 line was reported to be stable within experimental error of 1.1 eV [16]. Although 83mKr is a gas and can have limited retention in a solid radioactive source, the effect of limited krypton retention was not reported in the above cited works. Regardless many years effort of nuclear electron spectroscopists there are no solid radioactive sources of the conversion electron useable for the energy calibration at sub-electronvolt level. The reason is a high sensitivity of the electron binding energies to the physico-chemical environment of the atoms of decaying nuclei. (On the other side this feature, exhibited also by the innermost atomic shells, is basis of the powerful X-ray photoelectron spectroscopy applied to surface analysis, see e.g. [17]). The necessary condition for precise determination of the electron energy is an instrumental resolution of a few eV that allows to detect so called zero-energy loss peak in the measured spectrum. This peak corresponds to conversion electrons that leave the radioactive source without any energy loss. The width of the zero-energy loss peak is determined by the natural widths of the corresponding atomic subshell and nuclear state and the width of the instrumental response function. A vacuum evaporation of the carrier free activity on the flat source backing was found to be one of the most promising methods for preparation of these radioactive sources. Using the practice of [15] the technique of purification of rubidium activity in a micro-chromatography column with subsequent vacuum evaporation is available. We have to our disposal two electron spectrometers, one at NPI Řež ESA12 (differential spectrometer, energy range of 0–20 keV with moderate resolution in the basic measurement mode and resolution of 1 and 3 eV for energies 2 and 7 keV in the retardation mode with reduced luminosity) and the second one at Mainz University (integral spectrometer, energy resolution for the K-32 electrons, energy range 7-35 keV).
Previously a good experience was obtained as for the reproducibility of the energy of the 99mTc M5-2.2 conversion line with energy of 1917 eV — at level of about 0.040 eV [18]. For this result the sources were periodically, once a day, prepared by electrolysis onto platinum substrate and immediately measured. On the other side, a change of energy of the K-14 57Co conversion line after storage (at air) of a source prepared on aluminium backing was observed. Also a dependence of the K-14 line energy on backing material was noticed [19].
For the reasons indicated above the development of the solid 83Rb/83mKr conversion electrons source for calibration and monitoring purposes at sub-electronvolt level was started.
In this work we report about the experimental methods, instrumentation equipments, conversion electron sources production, measurements of the energy of the conversion electrons and about first results.
2 Experimental method
2.1 Conversion electrons from 83Rb decay
The 83Rb nuclide decays by electron capture with a half-life of T1/2=86.2(1) d to form the short lived isomeric state 83mKr with T1/2=1.83(2) h, i.e. the 83mKr isomer is continuously generated by the decay of 83Rb, see the decay scheme in Fig. 1.

The conversion electrons produced in electromagnetic transitions from the krypton nuclear levels above the isomeric state are not usable for systematic studies and calibrations for the tritium neutrino mass experiment as their energies are too high. Conversely, the isomeric state decays via a cascade of suitable low energy transitions of 32.2 and 9.4 keV possessing high intensity of conversion electrons. The first transition with E3 multipolarity is especially highly converted — the total conversion coefficient calculated using the tables [21] amounts to . The second transition of 9.4 keV energy is practically a pure M1 transition — the amount of E2 multipolarity admixture is given by the mixing parameter =0.0130(8). The energies and intensities of the -transitions and the related conversion electrons (with intensity larger than 0.1 %) from 83Rb decay are listed in Table 1.
| Energya | Transition | Intensityb | Line widthc | Line widthd |
|---|---|---|---|---|
| eV | type | % per 83Rb decay | eV | eV |
| 9405.9(8)[9] | 6.1(14)[23] | - | ||
| 7481.2(11) | L1 | 73.2 | 5.3(4) | 3.75 |
| 7674.9(9) | L2 | 8.24 | 1.84(5) | 1.25 |
| 7727.4(9) | L3 | 5.28 | 1.40(2) | 1.19 |
| 9113.0(9) | M1 | 12.1 | 4.27(5) | 3.5 |
| 9183.6(8) | M2 | 1.35 | 1.99(32) | 1.6 |
| 9191.4(8) | M3 | 1.03 | 1.66(8) | 1.1 |
| 9378.4(8) | N1 | 1.49 | 0.19(4) | 0.4 |
| 9391.7(8) | N2 | 0.12 | 0.59(4) | - |
| 32151.7(5)[12] | 0.037(5)[23] | - | ||
| 17824.3(5)e | K | 17.6 | 2.83(12) | 2.71 |
| 30226.9(9) | L1 | 1.17 | 5.3(4) | 3.75 |
| 30420.6(7) | L2 | 18.2 | 1.84(5) | 1.25 |
| 30473.1(7) | L3 | 28.3 | 1.40(2) | 1.19 |
| 31858.7(6) | M1 | 0.19 | 4.27(5) | 3.5 |
| 31929.3(5) | M2 | 3.10 | 1.99(32) | 1.6 |
| 31937.1(5) | M3 | 4.81 | 1.66(8) | 1.1 |
| 32137.4(5) | N2 | 0.28 | 0.59(4) | - |
| 32137.4(5) | N3 | 0.43 | 0.59(4) | - |
| aThe energies of conversion electrons are calculated for free atoms using transition | ||||
| energies from this table and binding energies from [22]. | ||||
| bThe intensities of conversion electrons are calculated using -ray intensities in this | ||||
| table and conversion coefficients from interpolation in tables [21]. | ||||
| cThe experimental line widths are taken from [9]. | ||||
| dThe line widths recommended in[24]. eBinding energy is taken from [25]. | ||||
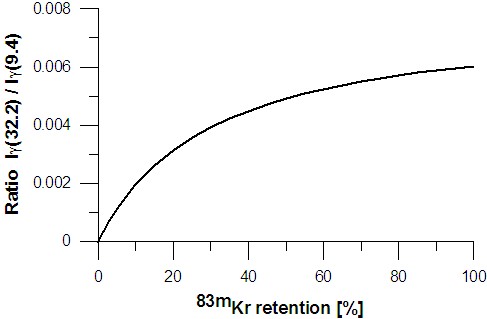
The natural widths of conversion electron lines are also shown in the table as the precision of energy calibration depends on this parameter. Particularly, the natural width of the main calibration line K-32 amounts to 2.83(12) eV. The conversion lines N1,2,3, due to their sharpness, are well suited for the study of the spectrometer response function. Unlike the 32.2 keV transition, which comes only from decay of the isomeric state, the feeding of the 9.4 keV transition is composed of three branches: a direct branch from electron capture on the 9.4 keV level, from electron capture on nuclear levels above the isomeric state and from the isomeric state via the 32.2 keV transition. Consequently, even in case of zero retention of 83mKr in solid 83Rb/83mKr source, the 9.4 keV -rays and corresponding conversion electrons are emitted from the solid source (the half-life of the 9.4 keV level is 147 ns only which is deeply below the time needed by the krypton atoms the leave the source volume). The value of krypton retention in a particular solid source can be determined from the ratio of the measured 32.2 and 9.4 keV -ray intensities. The 100 % 83mKr retention, i.e. the maximum possible number of isomeric states in the source, corresponds to the situation when 83mKr and 83Rb nuclei in the source appear in an equilibrium determined by their decay half-lives. The dependence of the intensity ratio on the retention deduced from the 83Rb decay data is shown in Fig. 2.
Compiled nuclear data about 83Rb decay can be found in [26].
For 83mKr atoms in the solid 83Rb/83mKr source the kinetic energy of conversion electrons measured by an electron spectrometer is given by the equation
| (1) |
where
-
•
is the transition energy which is equal to the energy of related -rays,
-
•
represents the binding energy of electron in subshell referred to the Fermi level for krypton atoms bound in the source,
-
•
is the 83Kr recoil energy encountered after emission of a conversion electron,
-
•
is the spectrometer work function.
Formula (1) is valid for the case when the source is in electric contact with the spectrometer. The recoil energy for K-32 electrons emitted from free krypton atoms is of 0.12 eV. The recoil energy for the other subshell conversion electron is larger. The largest value is observed for the emission of the N-32 conversion electrons and amounts to 0.22 eV. Possible changes of these recoil energies for krypton atoms bounded in the source are very unlikely at room temperature. The recoil energy after -ray emission is not stated in this formula as it is negligible. In case of free krypton atoms this recoil energy amounts to 0.01 eV. Energies of nuclear -rays are known to be stable except extremely small Mössbauer shifts fully negligible in our case. However, the electron binding energy represents a problem as it depends on the stability of the physico-chemical environment of the atom, see Sect. 2.3. The spectrometer work function can also change with a time. Its stability depends both on the spectrometer surface treatment and on the presence of rest water in spectrometer vacuum.
2.2 High resolution electron spectroscopy
The interpretation of the conversion electron spectra measured at high energy resolution requires to account for two important effects: shake up and off processes connected with the atom from which the electron originates, and energy losses resulting from inelastic interaction of the outgoing electron with surrounding atoms. Both effects produce satellite lines or continua on the low energy side of the zero-energy loss line, which is thus reduced in its intensity.
When a conversion electron is ejected from an atom a sudden change of electric potential of the atom can excite other bound electrons of the same atom from its orbital either into another (shake up process - discrete line spectrum) or even into the continuum (shake off process - continuous spectrum with edge). Actually, in a shake off process two electrons are emitted forming two complementary continuous spectra, one at very low energy and a second close to the zero-energy loss line. Similar shake up/off processes were studied experimentally and theoretically also for decay, photoelectric effect or electron impact interaction. In works [9, 22, 27] and [28] shake up/off effects in Kr were observed and interpreted. Shake up/off effect is not yet fully understood, e.g. in case of the K-14.4 57Co conversion electrons the expected shake up satellites were not identified. The solid-source effect could mask the phenomenon in this case, see [29].
The second effect is caused by inelastic scattering of electrons on surrounding atoms. Namely, even a solid conversion electron source, prepared from no-carrier added radioactive substance contains unavoidable traces of contaminants. The radioactive atoms are deposited on a backing where moreover, electron backscattering takes place. Finally, a contamination over-layer composed mainly of carbon, oxygen and hydrogen is formed on the source surface during and after its production even if it is prepared and kept at UHV conditions (10-10 mbar). Therefore, emitted conversion electrons suffer from inelastic and elastic scattering processes in the source material. As a result, components corresponding to inelastically scattered electrons and zero-energy loss ones appear in the measured spectra taken with high instrumental resolution. The energy loss electron spectrum is then represented by a broad peak, separated from the narrow zero-energy loss electron peak. The tail of the energy loss distribution extends to zero energy, see e.g. [30]. The electron scattering process can be successfully described using Monte Carlo calculations if enough information about the source is available see, e.g. [31, 32, 33].
At a high energy resolution, 3 eV or better, the zero-energy loss electron peak is well resolved from the shake up/off and loss energy structures and its energy can be established with high reliability. The width of this peak is practically represented only by the convolution of the Lorentzian function (the width of which is given by the sum of the natural widths of atomic and nuclear levels in question) with the spectrometer response function. Fig. 3 shows an example of such a spectrum which represents a typical result of the measurements at ESA12 spectrometer for one of the 83Rb/83mKr sources (altogether we investigated 22 sources which are listed in Table 2).
In contrast, the measurement at lower resolution (tens of eV) where the inelastically scattered electrons are not or only partly resolved from zero-loss electrons, gives the peak energy shifted to a lower value. Using the material with low Z for the substrate and carrier free radioactivity reduces the amount of the inelastically scattered electrons. Conversely, in unfavorable cases a large contamination in the source material can suppress the rate of the zero-energy loss electrons substantially, so that precise energy determination is impossible despite high instrumental resolution.
2.3 Chemical and solid state shifts
The chemical and/or solid state shifts are defined as the difference between electron binding energy for free atoms (obtained in measurement with atoms in a gaseous or vapor state) and the atom in a particular chemical state and/or solid environment. The measurements of the shifts represent the main subject for the specimen investigations by means of the X-ray photoelectron spectroscopy. The chemical shifts amount to 2–7 eV with both signs and are correlated with the valence state [30, 22]. For solids, the binding energies are mostly by about 2–10 eV smaller than for free atoms [38], [37]. The photoelectron lines are generally found to be broader for the solid state specimens than for free atoms. A similar shift of the electron binding energy and consequently a shift of kinetic energy is observed in spectra of conversion electrons observed in radioactive decays. In the photoelectron measurement, the photoelectron reflects the state of specimen being in a stable chemical and solid state. On the other hand, in the internal conversion process following -decay, in which the atomic number was changed, the original inner atomic shells are rearranged during typically 10-16 s [30]. As the half-lives of the nuclear levels are in the order of 10-13 s or longer, the electron binding energy in daughter nucleus atom must be taken into account, i.e. the chemical and solid state properties of this atom influence the shift. For reference for the non zero chemical and solid state shift for the conversion electrons, see e.g. [29, 34, 35].
For the investigated solid 83Rb/83mKr source, the 83Rb activity of 5-10 MBq in a circle of about = 8 mm is needed. It corresponds to an average thickness of only 0.2-0.4 monolayers of radioactive rubidium. After the decay, the rubidium atoms, originally in the form of oxide or hydroxide in the source [36], convert into chemically inert krypton atoms kept fully or partially in the source solid matrix. According to the arguments given above, we can expect here only the effect of the solid state shift. Thus, the reproducibility and stability of the conversion electron energy will be determined by the reproducibility and stability of the source matrix. It has to be stressed that the values of typical shifts for solids cited above were observed in the studies with well defined macroscopic samples. A broader conversion line can be also observed in comparison with those expected for free 83mKr atoms.
3 Instrumentation
For the development of the solid 83Rb/83mKr source dedicated instrumentation was necessary: krypton gas target for 83Rb production, technique of pure radiochemistry, X-ray and -spectrometers, vacuum evaporating device and electron spectrometers for the test of reproducibility and stability of the electron conversion line energies.
3.1 Krypton gas target
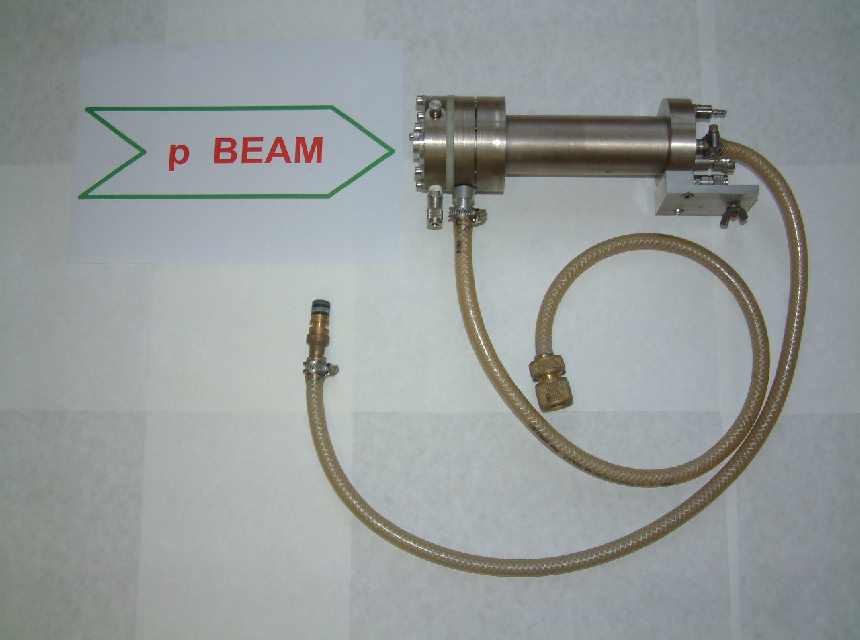
The production of 83Rb was carried out at the U-120M cyclotron of NPI in Řež with proton beam via the reaction natKr(p,xn)83Rb using a water cooled krypton gas target. The basic features of its design and construction were published in [39]. Most of target details were produced from a hard aluminium, free of copper. The entrance window for the beam was from 0.1 mm thick titanium foil. The inner side of krypton vessel was plated by nickel. For filling with krypton, the target was equipped with two SWAGELOK miniature quick-connects. In Fig. 4, the overall view on target is shown.
The pressurized krypton gas (absolute pressure of 7.5 bar at room temperature in volume of 22 cm3) was exposed to the external 6 A proton beam for 12 hours (total beam charge of 250 mC). During target irradiation, the pressure and temperature increased to about 9.5 bar and 100 ∘C, respectively. The primary energy of the proton beam was set to 27.0 MeV. Due to the energy degradation in cyclotron aluminium beam-focus-smearing foils and output aluminium window, target titanium entrance window and krypton gas itself, the energy used for the production was in the range 19.5–24.1 MeV. This range is optimal for the 83Rb production, both maximizing the 83Rb production rate and minimizing the amount of 84Rb (see the excitation functions in Fig. 5).

The irradiated target was left for a week to let short lived activities to decay. The mixture of rubidium isotopes deposited on the target walls was two times washed out by 25 cm3 of distilled water. The produced 83Rb activity was about 100 MBq and the elution efficiency of 83Rb from the target amounted to about 90 %. The -spectrum of the rubidium water solution sample measured 14 days after the irradiation is shown in Fig. 6. Only the -lines from longer living rubidium isotopes and terrestrial background are present in the spectrum.

As expected, the rubidium water solution contained an admixture of the rubidium isotopes with mass numbers A = 84 (T1/2 = 32.9 d) and A = 86 (T1/2 = 18.66 d). The relative abundance of isotopes 83Rb, 84Rb and 86Rb amounted to 10:1:0.2 at 14th day after the irradiation. The abundance ratio for 83Rb and 84Rb was in agreement with the measurement [39], see Fig. 5. These admixtures are relatively weak and did not cause any problem for the measurement of the low energy conversion electrons. The amount of 86Rb was in fact negligible due to its low yield and relatively short half-life. Even higher yield and better radionuclide purity could be reached using enriched 84Kr in the target instead of natural krypton since the contribution due to the reactions 86Kr(p,n)86Rb, 86Kr(p,3n)84Rb and 83Kr(p,)84Rb would be avoided. Some other aspects of 83Rb production related to the KATRIN project can be found in [40].
3.2 Pure radiochemistry and production of the 83Rb/83mKr solid source at vacuum evaporation device
The 83Rb/83mKr sources of conversion electrons were prepared by means of vacuum evaporation. In order to minimize electron energy loss, the 83Rb had to be deposited onto a metal evaporation boat in the cleanest possible form. For this the water rubidium solution obtained after gas target wash out had to be reduced in volume and purified. First, the solution was gradually evaporated under an infra red-lamp in a quartz vessel. Then the activity from the quartz vessel was washed out several times into the total amount of ml of 0.1 M HNO3 acid. This primary eluate was let to pass through a chromatography micro-column (70 mm long and 1.5 mm in diameter). To speed up the column flow nitrogen gas with a purity of 99.99 % and pressure of 1.7 bar was applied to the column. Elementary rubidium was retained in the upper part of the column. Next, 0.3, 0.5 and 1.0 molar solutions of HNO3, each of 0.5 cm3 volume, were applied to purify the column. Rubidium was released from the column by means of a 0.5 cm3 of 2.0 M HNO3. The acid was removed from this last eluate by evaporation. By dissolving the rest in distilled water, the solution for the boat deposit was obtained. Successively, three ion-exchange catex resins were tested for filling of the column — OSTION LG KS 0803 (with particle size of 15–20 m), AMINEX A4 (16–24 m) and LEWATIT LWC-100 (1–60 m) with practically the same result.
In addition a more simple and faster process of purification was suggested and tested. Instead of chromatography column, the primary eluate was purified using 220 nm pore aerosol filter from MILLIPORE and then evaporated to a small volume for boat deposition. Unfortunately, solid 83Rb/83mKr sources prepared in this way, exhibited imperfections and this procedure had to be excluded from further source development, see Sec. 4.1.
The modular high vacuum coating system MED 020 from BAL-TEC (Liechtenstein) was used for the vacuum evaporation, see Fig. 7.

The glass cylindrical vacuum chamber with 108 mm inner diameter and 172 mm height was evacuated with an oil free pumping system consisting of a fore-vacuum membrane pump (2 m3/h) and a turbomolecular pump (70 l/s). The system enabled us to reach a vacuum of 3 10-6 mbar in evaporation chamber. To reduce the contamination of the chamber by 83Rb a removable protection foil of 0.2 mm thick aluminium was used to line on the inner wall of the cylindrical part of the chamber before each evaporation process. A Microfibre HEPA filter was connected to the vacuum system outlet to prevent any escape of evaporated radioactivity. The radioactive material was electrically heated in a metal boat using a high current supply (4 V; maximal 250 A). In most cases, tantalum boats were used, but molybdenum and tungsten ones were tested, too. The dependence of the boat temperature on the heating electrical current was determined by finding the current value at which a particular metal melts. Indium (157 ∘C), tin (232 ∘C), aluminium (660 ∘C), silver (962 ∘C) and gold (1064 ∘C) were used. The calibration depended on the material and dimension of a given evaporation boat; e.g. gold melted at 30 A (using 4 V current supply) in a tantalum boat (37 mm length, 12 mm width, 0.095 mm thickness) used in the majority of the last 83Rb evaporations. To check the dependence of 83Rb evaporation on the temperature, a number of boats were heated to gradually increased temperatures. By means of -spectroscopy the activity remaining in the boats was checked after the heating. A decrease of activity was not found up to 300 ∘C. In these cases where the boats were heated above 600 ∘C, only a few percent of 83Rb activity remained in the boat. The studied 83Rb/83mKr vacuum evaporated sources were prepared according to [15]. To avoid some possible impurities the boat with 83Rb activity was preliminary heated to 200 ∘C for 5–10 minutes. In this phase the boat was shielded with special shutter to keep the substrate clear. Then the 83Rb evaporation followed for 30–60 seconds at 800 ∘C.
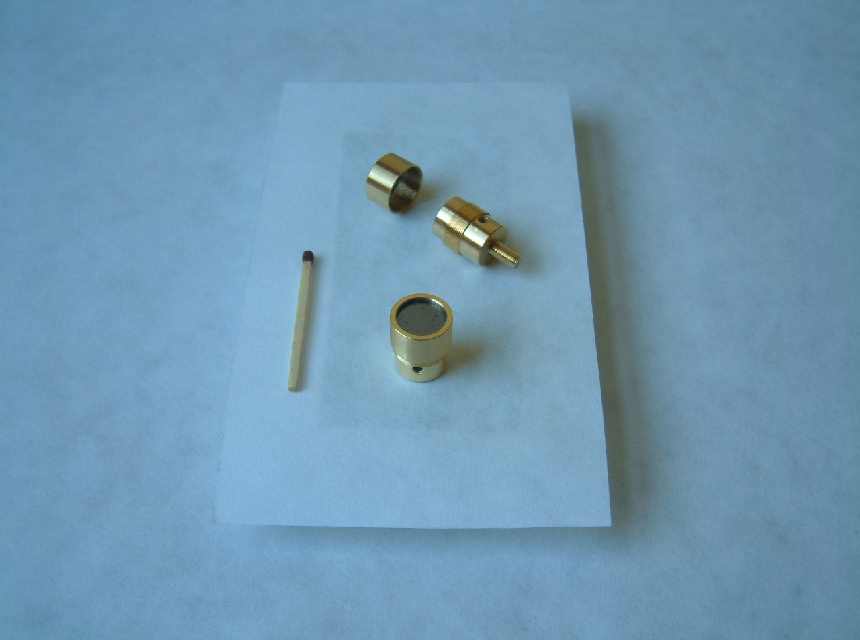
The vacuum evaporated source was of circular shape with 8 mm diameter. It was determined by a circular mask with thickness of 1 mm situated directly on the source backing during the evaporation process. A 50 m thick aluminium foil or carbon (0.2 mm foil or 1 mm thick disk of highly oriented pyrolytic graphite (HOPG)) served as a 83Rb source backing. The distance between the source backing and the evaporation boat was from 17 to 1 mm. During heating to 800 ∘C the tantalum boat was deformed due to thermal extension. The deformation in the direction normal to the boat plane could reach 2 mm causing mostly a reduction of the distance between the boat dimple (2 mm deep) with 83Rb and the source backing. For larger boat-source backing distances ( 10 mm) the evaporated source activity was nearly 2 higher than the of initial activity in the boat (solid angle was determined by the boat center point and an 8 mm diameter circular mask). At smaller distances the evaporation efficiency increased but it was less than . For further manipulation and for the measurement at spectrometers the source was fixed in a copper holder plated with gold shown in Fig. 8. The gold on the holder ensured safe electric contact of the source backing to the spectrometer zero potential.
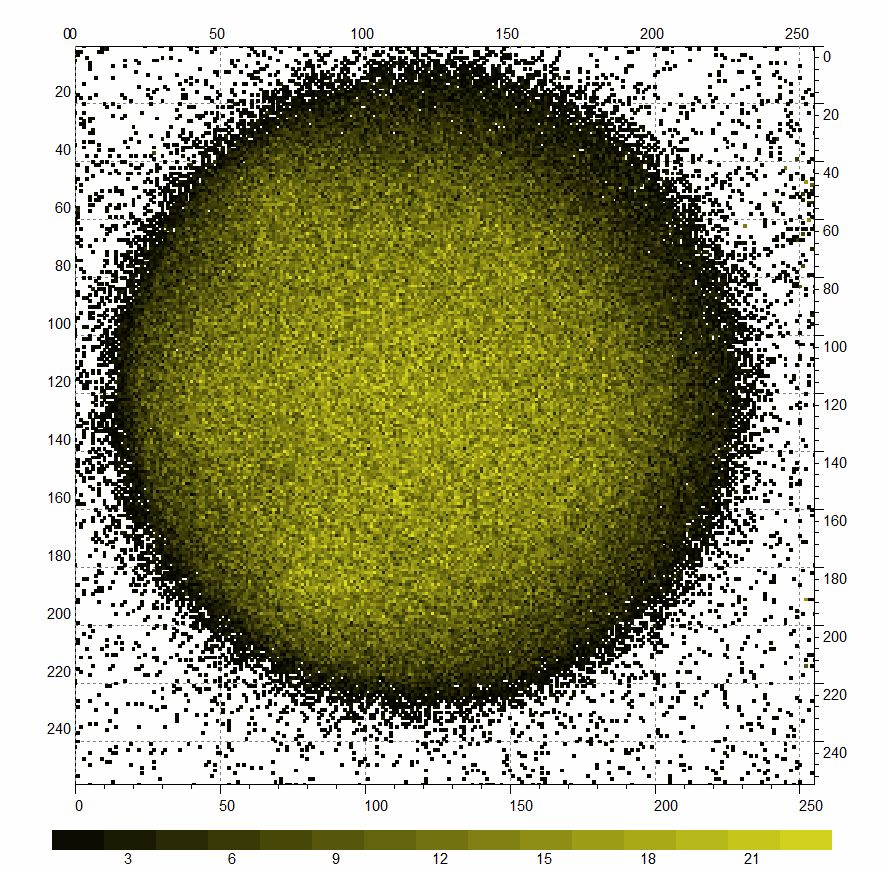
Distribution of 83Rb/83mKr activity on two of vacuum evaporated sources was examined with a position and energy sensitive detector of the Timepix type [41]. The measurements were carried out in the Institute of Experimental and Applied Physics of the Czech Technical University in Prague. The detector has 256 x 256 pixels and a sensitive area of 14.08 mm x 14.08 mm. Dimensions of individual pixels are 55 m x 55 m implying outstanding position resolution. The thickness of the Timepix silicon chip amounts to 300 m. In order to prevent damage or contamination of the detector surface a 4 m mylar foil was placed between the chip and the source fixed in a holder. Since the 83Rb and 83mKr decays are accompanied by X-rays, gamma rays, internal conversion- and Auger electrons, the interpretation of the measurements is not straightforward. In particular, intensive gamma-rays with energy around 500 keV can produce a signal in several pixels especially if their direction is not perpendicular to the detector chip plane. The Timepix image of the 83Rb/83mKr source No. 9 projected on the horizontal plane is shown in Fig. 9. The distance between the source and chip plane was 1 mm. The activity of the source was 26 kBq at the time of measurement. No distinct inhomogeneities exceeding 55 micrometers were recorded. Details can be found in [42].
3.3 The -detectors
The radiopurity and activities of the radioactive samples and the retention of 83mKr in 83Rb/83mKr solid sources were determined via -spectrometry based on a commercial apparatuses. The -ray spectra were measured with a 20% efficiency HPGe detector equipped with standard preamplifier, amplifier and computer based ADC card TRUMP — all from EG&G ORTEC. The energy resolution of the system, the full width at half maximum, was 1.8 keV at 1332 keV energy. The spectroscopy chain was calibrated for energy and absolute efficiency by a set of commercially available standard radioactive sources of 133Ba, 152Eu and 241Am. The activities of rubidium isotopes were calculated from the net peak areas corrected for the dead time and efficiencies with the use of the relevant -intensities published in [20]. In view of the large span of sample activities, the spectrometer absolute efficiency calibrations for distances source-detector endcup 50, 160 and 320 cm were established in order to achieve optimal dead time for the measurements. In Fig. 10, the view on the -spectrometer with the krypton gas target is shown.

The 83mKr retention in 83Rb/83mKr solid samples was determined from the measurement of the -ray intensity ratio for the 32.2 and 9.4 keV transitions according to Sec. 2.1. For this purpose, a Si(Li) detector equipped with beryllium window was employed as the HPGe -detector was practically insensitive for the detection of these low energy -radiations. A 80 mm5 mm Si(Li) detector with build-in preamplifier and spectroscopy amplifier (both devices from CANBERRA) were used. The thickness of the beryllium window was 0.05 mm. The card TRUMP digitized the amplifier output signals into 8192 channels. The energy resolution of the system was 330 eV at an energy of 33 keV. Energy and absolute efficiency calibrations of the detector were based on calibrated sources of 55Fe and 241Am. The calibration was carried out with the KX, LX and -ray energies and intensities from [20] and [43]. The X-ray spectrometer was equipped with a small vacuum chamber (content of about 100 cm3) pumped by vacuum station from LEYBOLD. The station was assembled from a two stage rotary pump (3 m3/hour) and turbomolecular pump (50 l/s). The end vacuum achieved was of 3 10-6 mbar. The 1.5 mm thin plexiglass window on the vacuum chamber facing to the detector with attenuation factors of 0.49 and 0.98 for the 9.4 and 32.2 keV -rays, respectively, allowed us to measure the 83mKr retention for the 83Rb/83mKr samples in vacuum. In Fig. 11, the view on the -spectrometry measurement with the Si(Li) detector and vacuum chamber is shown.
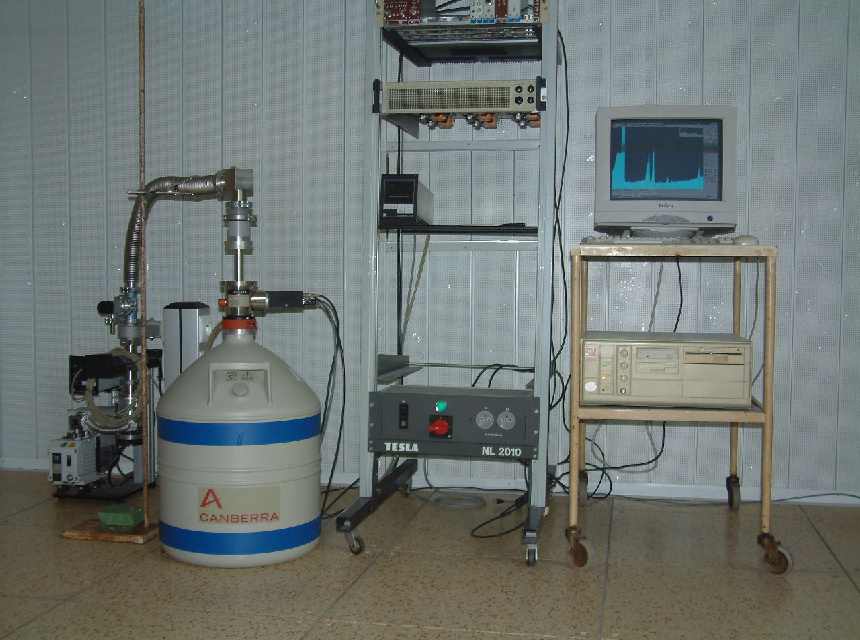
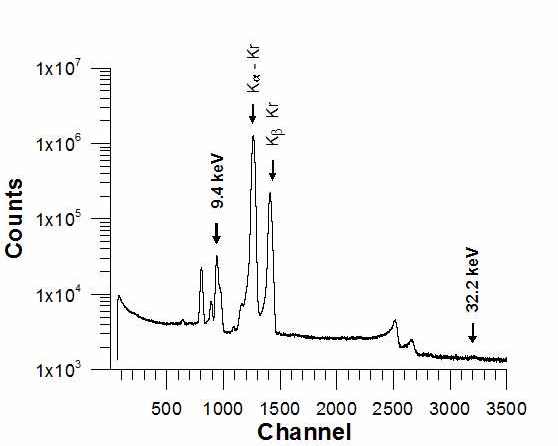
Fig. 12 shows as an example the gamma spectrum of the 83Rb/83mKr source No. 28 measured with Si(Li) detector for the retention determination. At a distance between source and detector endcup of 23 mm the dead time amounted to 7 %. The time of the measurement was set to 6 h.
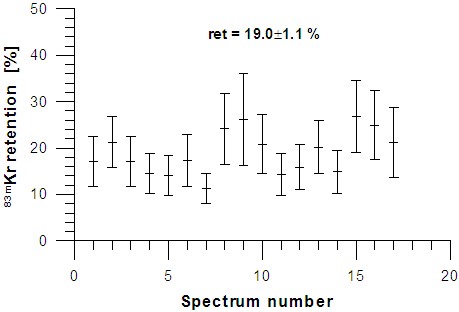
The analysis of retention measurement is demonstrated in Fig. 13. For 17 spectra subsequently measured with source No. 28 the values of retentions were established.
3.4 Electrostatic spectrometer ESA12 at NPI Řež
The energy stability of electrons from solid rubidium sources was tested with the ESA12 spectrometer at NPI Řež with the L1-9.4 conversion line at an energy of 7.5 keV. The monitoring K-32 line at energy 17.8 keV could not be tested as it falls out of the high resolution range (eV) of this instrument. The result of such tests will help to plan more effectively the K-32 measurements at a less accessible electron spectrometer at Mainz university. The long-term stability tests lasting many weeks were more easily carried out at home Řež workplace. They are also much cheaper since no liquid helium for superconducting magnets is needed.
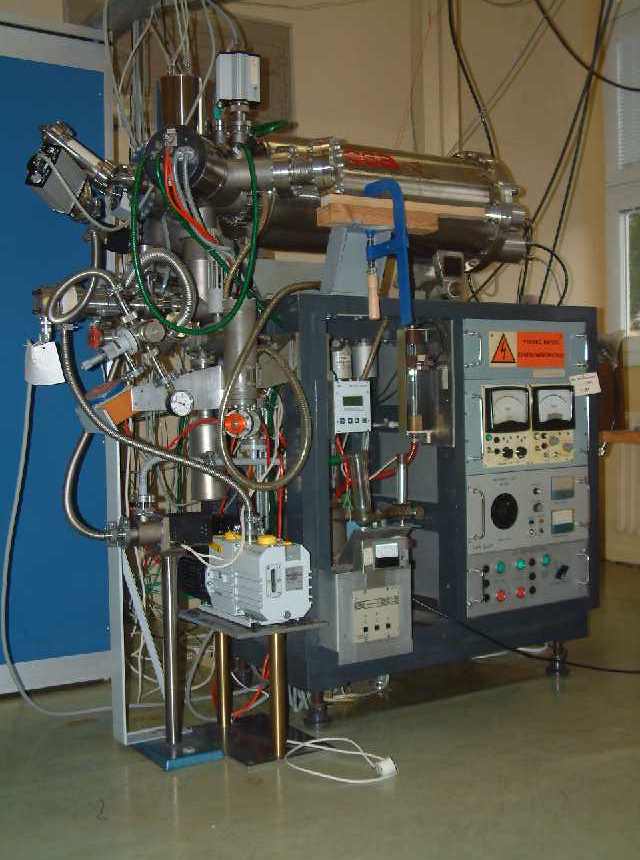
The ESA12 spectrometer in Řež is a second order focusing cylindrical mirror electron analyzer equipped with retarding/accelerating lens system and channel electron multiplier as a detector [44, 45]. In Fig. 14, the view on the spectrometer with vacuum components and 220 V power distribution is shown.
The primary value of the kinetic energy for electrons detected at ESA12 is given by the relation
| (2) |
where
-
•
is the energy lost or gained at lens,
-
•
is the analyzer passing energy,
-
•
represents a unit of elementary charge,
-
•
is electric potential on the lens electrode connected electrically with the radioactive source,
-
•
V/eV is a constant determined by the analyzer construction,
-
•
is negative voltage applied to the outer analyzer cylinder.
The behavior of , i.e. its stability and reproducibility, is the most important parameter followed in the 83Rb/83mKr solid source development. The instrumental resolution of the ESA12 is given by the relation and its response function is assumed to have a Gaussian shape. The spectrometer is a one-channel device which can work in basic or lens mode. In the first case, the V and is swept with adjustable voltage step in order to cover the required kinetic energy range according to equation (2) (the steps can be chosen in voltage ascending or descending way). For the lens mode the is stabilized at an appropriate value to provide the intended analyzer resolution and the is changed in the same way as is changed in the basic mode. Generally accepted method for the precise measurement of high voltage based on HV resistor divider is used. Three precision HV dividers named KD2, KD3 and KD10 were developed in our laboratory [46]. First two are similar with dividing ratio of 402.7, the third one has the dividing ratio of 9.9. The measurement of the actual values of voltages at the outputs of the dividers is accomplished with high-quality commercial digital voltmeters. The dividing ratio of the dividers was chosen in such a way that the voltmeters can operate in the 20 V range, thus providing the most precise values up to 8 valid digits. When a voltage step is set, i.e. the energy point is adjusted, the detector signals are added up in the counter within a fixed period (formerly 1 now 2 sec). During the measurement, the spectrometer input and output slits (situated at the inner cylinder) are set to the maximal width of 4 mm. In this case and for the basic mode the geometrical transmission of the system amounts to 0.74 % of . In the lens mode, the transmission decreases or increases with the applied retarding or accelerating lens voltage. Using lens mode, an excellent resolution can be obtained also for higher energy electrons by setting a low value for the passing energy. However, as stated above, the transmission of the analyzer is reduced due to the loss of electrons when passing the electrostatic retarding field between lens electrode and the input analyzer slit (the reduction factor is roughly proportional to for electrons with given kinetic energy). The total efficiency of the spectrometer is obtained by multiplying of the transmission with a channeltron efficiency. The channeltron efficiency is energy dependent and amounts to several tens of percent for electrons in a range of 10–1000 eV and several percent for the electrons in keV range. The low overall efficiency of the spectrometer causes the measurement to be time consuming — two days or more with a 83Rb/83mKr source of several MBq.
A computer program controls the measurement, i.e. digital voltmeters attached to HV dividers, precise HV power supplies and a counter, according to given input data. After all energy points in a given energy range are scanned the basic element of a measurement, the sweep, is completed. The sweeps are then repeated until sufficient statistics is obtained. The number of counts and the related measured voltage in basic mode or in lens mode were recorded successively into the output file for each voltage step and each sweep. In the lens mode, the actual values of stabilized voltage were not recorded in the output file formerly. If the voltage appeared outside fixed limits the control program wrote appropriate comment into the output file. At present this voltage is recorded as well.
During the measurement, the control program allows to visualize the electron spectrum sorted from all already accumulated sweeps on the computer monitor. After finishing the measurement, the spectrum is sorted off-line using the data from the output file. In the measurement of L1-9.4 conversion electrons with kinetic energy of 7482 eV the following three basic control program modes with values for , energy ranges and steps were used:
-
•
basic mode: eV eV eV
-
•
lens mode eV: eV eV eV
-
•
lens mode eV: eV eV eV
The first two modes include a larger portion of the spectrum on the low energy side of the L1-9.4 line, which is useful for inspection of the loss electron spectrum. The third mode is most frequently applied as it is used for the line position determination. From this it follows that the precise and reproducible measurement of voltages V and V is of decisive importance.
During the development of the solid 83Rb/83mKr source
a number of improvements was gradually adopted at the ESA12 spectrometer:
a) new voltmeters and one of the HV supplies were installed,
b) frequent measurement of the divider ratio was introduced,
c) vacuum system was improved,
d) open water cooling circuit was replaced by a closed water system,
e) auxiliary voltage of –29 V on the channeltron input funnel was applied,
f) control program was modified,
g) more precise analysis of the measured data was introduced.
a)
In the old HV system, the voltmeter SOLARTRON 7061 (produced in
1989, set to resolution of 6.5 digits) attached to the divider KD2
or KD3 was used at basic mode for the cylinder electrode and at lens
mode for the lens electrode. The voltmeter TESLA M1T330 (produced
in 1985, 5.5 digits) attached to divider KD10 was used at lens mode for
the analyzer electrode. Both these voltmeters were replaced by two new
ones FLUKE 8508A, both set to resolution of 7.5 digits. The
8508A FLUKE multi-meter is designed for the most demanding
measurement applications and provides extremely high measurement
precision. It is one of the best available on the world market,
intended also for the KATRIN experiment. The measurements with
FLUKE and SOLARTRON devices connected simultaneously to
batteries V or a Weston cell 1.0 V showed that the
ripple and noise of the voltage indications was by factor of 2.7
smaller with the FLUKE voltmeter. The temperature coefficient of
Fluke voltmeters was also measured. For the voltages 1.6, 14.5 and
650 V at ranges 2, 20 and 1000 V values of only
+0.08, +0.1 and –0.07 ppm/∘C we obtained. The measured
temperature coefficient for SOLARTRON at the voltage 14.5 V
amounted to +0.4 ppm/∘C. Generally, the voltmeter
indications exhibit a time drift, being larger when the instrument
is new. The FLUKE voltmeter specification shows a 365 days uncertainty
of about 3 ppm at a confidence level of 95% for DC voltage
measurement. In order to check the drift behavior, one of the
FLUKE voltmeter was sent till now 4 times to The Czech Metrological Institute
(CMI) Brno, for verification of the voltmeter performance at
metrological standard voltages for all DC ranges and at the
voltages important for our measurement, i.e. 1.6, 18, –150 and
650 V (verification does not mean a calibration at which the
voltmeter is reset in order to show the right voltages). The
voltages 18 and 150 V are close to those used in measurement of
the L spectrum; the values 1.6 and 650 are related to
the measurement of the dividing ratio (see below). In
Fig. 15 the difference between the
voltage measured by voltmeter and those set by precise metrological
divider for the important values is shown on dependence of time.
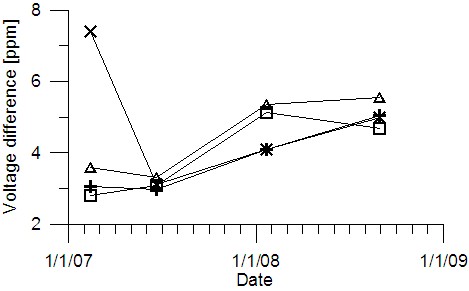
The largest drift amounts only to 0.22 ppm/week (between the first and
second verification of 650 V). In the approximation, that the voltmeter
indication changes linearly with time, the
measured energy of the conversion electron line can be corrected for
the voltmeter drift.
The HV supply –3 kV ATOMKI (produced in 1989) utilized in
combination with the KD10 divider for at the lens mode
measurement was replaced by a MCP 34–650 MOD power supply (maximal
voltage at the output is 650 V, + or – polarity can be set by
grounding of the appropriate output terminal)
from F.u.G ELECTRONIC. The relative value off p-p
ripple and noise measured at a voltage set to -150 V for the old
power supply amounts to , whereas for the new
device much a better value of is obtained. In
order to reduce the number of electronic elements the divider KD10 was
removed from the system as the FLUKE voltmeter enables us to
measure the analyzer voltage ( V) with sufficient precision
directly. The second HV supply produced at NPI and used for the
cylinder or lens electrode in basic or retarding/accelerating
modes, respectively, remains unchanged.
b)
Besides the precise voltmeter values, a detailed knowledge about
the behaviour of the HV dividers KD2 and KD3 was necessary. Each of them
consist of 74 TESLA TR164 resistors connected in series and assembled
into two groups forming high and low voltage sections. Moreover,
matched pairs of resistors with positive and negative temperature
coefficients were combined in the dividers in order to
reduce the dividers temperature coefficient.
The resistance of high and low sections are 54.013 M and
134.4 k, respectively.
Further details about dividers can be found in [46].
Starting December 2006, the
measurements of the dividing ratio with +650 V at the KD3 divider inputs
are frequently carried out, see Fig. 16.

By fitting of the line to the dependence in the figure a value
of divider drift of –0.6(1) ppm/week was determined. The drift measured for the
second divider KD2 in the same way amounts to -1.0(1) ppm/week.
The temperature coefficient
of both dividers deduced from divider ratio measurements taken at
different temperatures amounts to about –0.2 ppm/∘C. Again,
if necessary, the measured energy of conversion electrons can
be corrected for the divider drift. Actually, during the
measurement of the electron line L1-9.4, a voltage of about 7200 V is
applied to the divider KD3 or KD2. The dividers themselves exhibit at
different input voltage a slightly different ratio .
Nevertheless, we can use the divider ratio determined at 650 V for two
reasons:
— there are no indications that the divider ratio drift itself is different
for the different input voltages [47].
— for the energy stability of the conversion line
the knowledge of the absolute energy is not necessary.
Unfortunately, there is no possibility to measure precisely the
divider ratio at such a high voltage in the Czech Republic.
In order to learn more this question, KD2 divider
was moved to The Institute of Physics
at Mainz University, where the measurement of divider ratio
and its drift at 7200 V was started.
A 650 V at the divider input represents a rather low voltage at the divider output, of about 1.6 V. In this case, the divider output connectors, voltmeter terminals and connecting leads represent a critical point as for the thermoelectric voltage which can disturb the result. Thermoelectric voltages are large for combinations of Cu-Cu(oxide), Cu-Ni and Cu-solder(Sn/Pb) and amount to 1000 V/∘C, 22 V/∘C and 1–3V/∘C, respectively. On other side, the thermoelectric voltage for Cu-Au is only of 0.2 V/∘C. For this reason the nickelled brass connectors of the divider were replaced by gold plated copper connectors. The connecting twisted leads were produced from copper wire of about 50 cm and equipped with copper gold plated spade terminations soldered by special Sn/Cd alloys (thermoelectric voltage for Cu-alloys(Sn/Cd) is low and amounts to 0.8 V/∘C). The FLUKE voltmeter terminals are not affected by undesirable thermoelectrical voltage as they are made from tellurized copper which is resistant to oxidation. Before starting HV divider ratio measurement, several hours have to pass to minimize the temperature gradients at the divider and the voltmeter.
c)
The spectrometer vacuum pumping system based on an old titanium getter
pump with a double stage rotary pump (5 m3/h) as a backing
pump reached a vacuum level of about
2 mbar. Replacing the titanium pump by a 210 l/s
turbomolecular pump improved the vacuum to 2 mbar.
d)
The original vacuum gauges controlling the spectrometer safety
system were cooled by an open water system with a consumption of
1.2 m3 of water per day. Practically continuous operation
of the spectrometer is expected during the solid
83Rb/83mKr source development. In order to
avoid large costs for water a closed water circuit equipped with
pump and small refrigerator was introduced. The mean temperature of
cooling water is set to 11 ∘C.
e)
In the spectrometer volume, conversion electrons are
produced by decay of 83mKr released from the source.
These electrons scatter on spectrometer material and produce
secondary electrons. Some of them are detected by the channeltron
as a background. Applying a low voltage of -29 V to the channeltron input
funnel the background in the electron spectra was reduced by factor of 4,
whereas the line intensity at pass energy eV was
reduced only by factor of 1.6. A similar procedure was used in
Dubna at spectrometer ESA50 [48].
f)
The spectrometer control program was equipped with configuration input
files to be able to run measurements with any regime using any
combinations of all available
voltmeters, HV dividers and HV power supplies. If necessary, the measurement
of temperature using the SOLARTRON temperature gauge can be also
selected in the configuration file. Because the integration time
for FLUKE voltmeters with a resolution 7.5 digits is 1.8 sec,
the time devoted to count in the counter had to be
prolonged to 2 sec. The structure of the spectrometer output data file was also
changed, currently in each sweep and for each point the actual values
of , , counts in 2 sec and ambient temperature are recorded.
g)
The old computer code for the spectrum sorting from output file
occurred to be insufficient for the development of the radioactive
source with reproducibility of the conversion electron energy at
sub-electronvolt level. In the old code the appropriate energy
window was chosen and all counts corresponding to the
energy bin were summed up together. The value of the energy ,
bin energy, was ascribed
to this sum of the counts. Usually,
and ; obviously, ,
[45]. Unfortunately, due to the HV supply imperfections
for the steps of several tenths of
volts the sorted spectra exhibited count irregularities and
the determined line position was unreliable. Therefore, three new codes
were written. The first one does the overall diagnostic for the
format correctness of the output file and sorts four dependencies
from which the quality of the measurement can be estimated:
-
•
D1: frequency distribution of values of the energies for the measured points (i.e. value) using bins (usually the bin width is taken as 0.05 eV) which are successively set to cover without spaces the range () eV
-
•
D2: frequency distribution of values of the steps (i.e. , the difference between the neighboring energy points in measured range) using bins (usually 0.01 eV) which are successively set to cover without spaces the range (0, ) eV
-
•
D3: dependence of the values for particular energy point of the measured range (usually the points 1, 2 and 3 are chosen) on the sweep number
-
•
D4: dependence of () values and temperature — both quantities averaged for points in frame of given sweep — on the sweep number.
In Figs. 17—20 examples of dependencies D1-D4 are displayed for three day measurement with the 83Rb/83mKr solid source: line L1-9.4, eV, eV, eV, altogether 2500 sweeps.

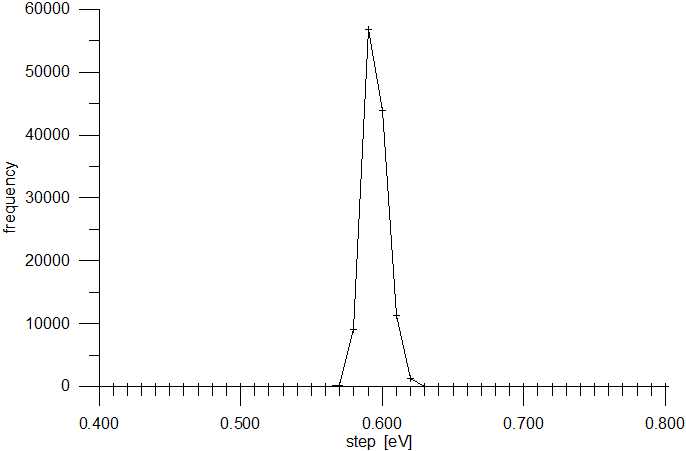

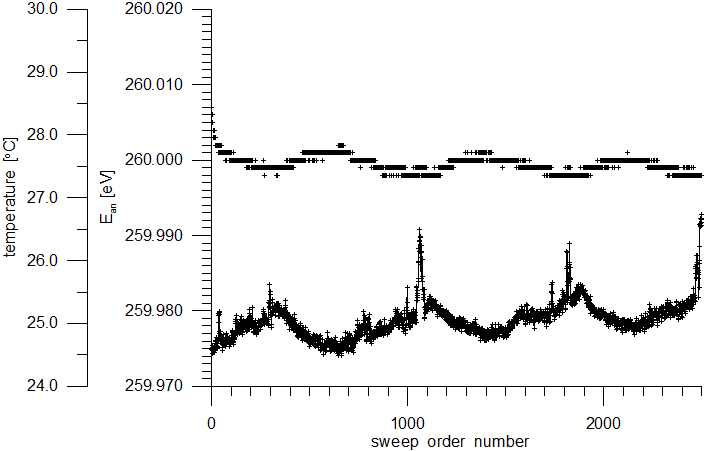
It is visible from Figs. 17 and 18 that in a real measurement, the actual step was set to 0.59 eV although in control program input data a value of 0.5 eV was required, which in terms gives 50 energy points in the range instead of 59. This is a result of non ideal transformation of the digital signal into analog one in the HV power supply. In Fig. 19 some instability at a level of 200 meV is visible at the beginning of the measurement and in the second half of the measurement, starting at sweep number 1500. This effect was connected with lens HV supply as was stable within 8 mV, see Fig. 20. In Fig. 20, one can further clearly see the day and night temperature variation and corresponding variation of cylinder electrode voltage.
The second computer code is designated for sorting of the electron spectrum itself. It works similarly as the previous code but this time the bin structure for spectrum sorting is taken from frequency spectrum in Fig. 17. Ideally, -functions would be seen; instead peaks of finite width and variable amplitude are visible. For correct sorting of the energy spectrum, the centroids of these peaks were chosen to serve as the bin energy. In such a way the bin widths for different points are different. The width for a particular bin is obtained as a sum of the half distance between the bin centroid and adjacent bin centroids. In this case, the count irregularities (present in spectra sorted according to the old approach) disappeared.
The third code is also designated for sorting of the electron spectrum. This time a new, direct, no-bining method is applied. The conversion line energies determined using the spectra sorted by this code are within statistical error the same as those determined by the second code. But generically, the new method is better as it takes into account all individual values of voltages measured for each point in each sweep. The full description of the no-bining method can be found in [49].
3.5 Electrostatic retarding MAC-E-Filter spectrometer at The Institute of Physics, University of Mainz
The electron spectrometer of Mainz university is of the MAC-E-Filter type, see [50]. The device was used for the neutrino mass experiment with tritium [2]. It consisted of quenched condensed tritium source (QCTS), an electron transport section (ETS), MAC-E-Filter spectrometer with vacuum vessel, retarding electrode and two superconducting pinch magnets and detector with superconducting magnet. Additionally, the device was equipped with central air coil controlling the low magnetic field in center of the spectrometer vacuum vessel and two mutually perpendicular earth compensation coils for the elimination of the influence of the earth magnetic field. After bake up a water free vacuum with final pressure of about mbar was achieved.
At present the spetrometer is used for systematic studies necessary for the KATRIN project. A HV supply for 35 kV from F.u.G. ELECTRONIC is used for the retarding electrode. The high voltage is measured by means of the newly developed KATRIN HV divider [6] and voltmeter FLUKE 8508A. The divider ratio and the divider ratio drift amount to 1972.4 and +0.15 ppm/week, respectively. The FLUKE voltmeter is daily calibrated at –10 V using FLUKE 732A DC Reference Standard. The typical value of drift of the FLUKE 732A reference is 0.06 ppm/week. From half a year measurements follows that the FLUKE voltmeter has at voltage –10 V a drift of –0.22 ppm/week. For measurements with solid 83Rb/83mKr sources, the ETS and QCTS were replaced by a new system allowing installation of the source. Moreover, the source being in vacuum can be aligned in X,Y and Z directions relative to the spectrometer. The Z direction is defined by the spectrometer horizontal axis along which are the magnetic guiding and electric retarding fields axially symmetric. The source part with the X-Y-Z source alignment mechanism and the 185 mm diameter compensation bellows are seen in Fig. 21.

The detector magnet was removed, too. The detector had to be moved
closer to the pinch magnet in order to conserve suitable detector
count rate. The spectrometer measures integral spectra in an
energy region of 7–35 keV. The lower limit is given by electronic
noise of the detector. The upper limit is
dictated by the maximal possible voltage which can be applied to
the retarding electrode. The instrument enables us to measure not
only the K-32 conversion electrons but also other conversion
electron lines observed in 83mKr decay. For the 17.8 keV
energy of K-32 electrons, usually instrumental energy resolutions
of 2.0 or 0.9 eV are used. These values are achieved by applying
the magnetic field (6.014 T) in the pinch magnets and by setting a
low magnetic field in central retarding plane. The response
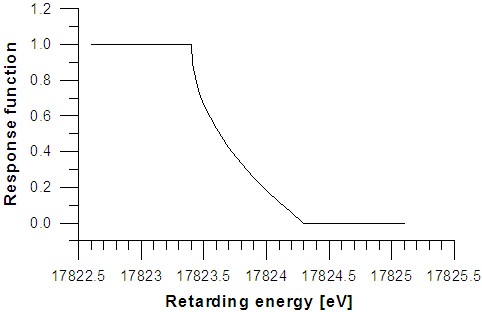
function for the electrons with energy and
instrumental resolution is described by the following
relations:
if ,
if , (3)
if ,
where
-
•
is the retarding energy for the retarding voltage ,
-
•
represents the energy of monoenergetic electrons,
-
•
is the magnetic field at the electron source,
-
•
corresponds to the maximum magnetic field at the pinch magnet.
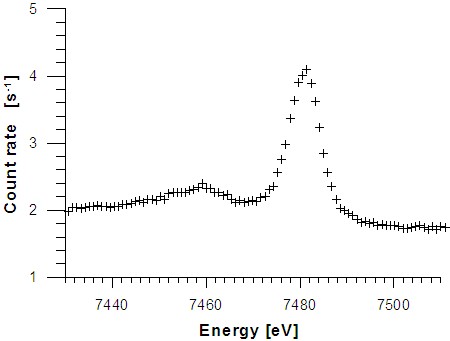
This response function definition holds under an assumption that the electrons are leaving the source isotropically. In Fig. 22 an example of response function for the energy of K-32 conversion electrons is shown.
The spectrometer transmission depends on distance between the source and the center of the pinch magnet on the source side. For example, for distances of 25, 20 and 15 cm, the transmission amounts to 3.3, 10.0 and 23.5 % of , respectively. The old, partly damaged, semiconductor silicon chip was replaced by a new detector, a pin diode from HAMMAMATSU. The diode with an area 9 mm 9 mm and max. HV –150 V is cooled to –90∘C. In front of the detector a mask was installed with diameter 9 mm. The energy resolution for 17.8 keV electrons is 2.1 keV. and the efficiency for registration of electrons is of 80 %. For processing of the detector signals a standard electronic chain with the cooled FET preamplifier, spectroscopic amplifier and a 8192 channel ADC is used. A histogrammig memory was also applied in order to reduce the dead time of the data acquisition system. The correction for the dead time is provided by means of pulser signals applied to the preamplifier pulser input. During the measurement a computer is controlling the HV supply, voltmeter and data acquisition system.
4 Measurements and results
4.1 Sources preparations and measurements in Řež
The development of the source of conversion electrons with an energy stability in the ppm level for at least 2 months is a difficult and time consuming process. Obviously, only to find out this source quality needs tests with the source at the electron spectrometer for 2-3 months. Because our first measurements showed unsatisfactory reproducibility and stability of the energy of the L1-9.4 line a large effort was devoted to study this effect by improvements of the spectrometer (see Sect. 3.4). Attention was also payed to increase the source activity in order to decrease statistical errors. Finally, different modes of source preparation were tested.
During the period 2006-2008, 6 irradiations with krypton gas targets were performed at NPI. From the activity produced, 21 solid 83Rb/83mKr sources were prepared by vacuum evaporation and measured at gamma and electron spectrometers. The list of sources according to the irradiation and source production dates is shown in Table 2. Further properties as a boat activity, substrate type, boat—substrate distance in evaporation device, efficiency of evaporation, source activity, retention of 83mKr in the source and reduced amplitude of L1-9.4 line are also indicated.
| Irrad. | Source No. | Prod. | Boat act. | Substr. | Dist. | Eff.ev. | Activ. | Ret. | Ar |
| [MBq] | [mm] | [%] | [MBq] | [%] | |||||
| 02.11.05 | 8a1 | 29.11.05 | 89 | Al | 14 | 5 | 4.6 | 70 | 0.56 |
| 9b | 17.02.06 | 34 | Al | 14 | 6 | 2.1 | 25 | 0 | |
| 10b | 22.02.06 | 23 | Al | 14 | 3 | 0.6 | 53 | 0 | |
| 10.05.06 | 11 | 29.05.06 | 140 | Al | 14 | 2 | 2.4 | 18 | 0.63 |
| 12b | 27.06.06 | - | Al | 14 | - | 5.8 | 100 | 0.03 | |
| 29.11.06 | 13 | 30.01.07 | - | Al | 11 | - | 0.5 | 7 | - |
| 14a2 | 30.01.07 | - | Al | 10 | - | 0.4 | 5 | - | |
| 15 | 06.02.07 | 66 | Al | 11 | 10 | 6.6 | 12 | 1.01 | |
| 13.06.07 | 16 | 02.07.07 | 11 | HOPG | 13 | 9 | 0.9 | 13 | 0.96 |
| 17 | 03.07.07 | 93 | Al | 11 | 13 | 12.0 | 11 | 0.64 | |
| 18 | 04.07.07 | 10 | C | 7 | 59 | 6.1 | 23 | 0.65 | |
| 30.11.07 | 19 | 27.03.08 | 25 | C | 12 | 11 | 2.7 | 3 | 0.95 |
| 20c | 27.03.08 | 18 | C | 7 | 28 | 4.9 | 30 | 0.41 | |
| 21 | 27.03.08 | 8 | C | 5 | 38 | 3.0 | 7 | 0.97 | |
| 09.04.08 | 22d | 23.04.08 | 10 | C | 1 | 20 | 2.0 | 33 | 0.52 |
| 23d | 29.04.08 | 10 | C | 3 | 46 | 4.7 | 60 | 0.27 | |
| 24d | 29.04.08 | 11 | C | 3 | 30 | 3.2 | 49 | 0.26 | |
| 25d | 07.05.08 | 10 | C | 3 | 32 | 3.2 | 87 | - | |
| 26d | 07.05.08 | 9 | C | 3 | 55 | 5.1 | 63 | 0.26 | |
| 27d | 16.06.08 | 15 | C | 6 | 24 | 3.8 | 73 | 0.21 | |
| 28 | 28.07.08 | 18 | C | 5 | 27 | 5.0 | 19 | 0.53 | |
| 29 | 28.07.08 | 19 | C | 5 | 26 | 4.9 | 11 | 0.62 | |
| a1,a2 The 83Rb water solution with LOCTITE glue added, for details see text. | |||||||||
| b The 83Rb for deposition into the boat obtained from the 83Rb contaminated Al protection foil. | |||||||||
| c The non-carrier free deposit in the boat - to the 83Rb a non-active rubidium was added. | |||||||||
| d 83Rb purified by aerosol filter was deposited into the boat, for details see text. | |||||||||
The amplitude in the table is given by the relation
| (3) |
where
-
•
32 is scaling constant,
-
•
represents the measured amplitude of the L1-9.4 conversion electron line in ,
-
•
is the mean activity of the source in MBq for the period of measurement,
-
•
is retention of 83mKr in the solid source in %.
The reduced amplitude enabled us to compare sources with different activities and retentions. The numbers in denominator 23 and 77 are the electron capture and 83mKr isomer feeding intensity of the level at 9.4 keV energy, respectively. These numbers are deduced from nuclear decay data, see also Fig. 1. The different values of Ar indicate the different amount of zero-energy loss electrons and consequently a different contamination present in the sources. The initial conditions for the particular source production are indicated in the columns Boat activity, Substrate and Distance. For some sources additional conditions, marked by indexes a,b,c,d in the second column, are explicitly described below the table. The last 4 columns represent the source property itself.
The Table 2 reflects four dedicated tests:
a)
At the production of the source No. 8 accidently the rubidium
water solution was polluted by LOCTITE glue used in the
construction of the first version of the gas target. Nevertheless,
the source quality was good - the retention and reduced amplitude
were high. In order to repeat this favorable case the LOCTITE glue
was added when the source No. 14 was produced. Unfortunately, the
expected high retention was not achieved.
b)
During the vacuum
evaporation a large portion of rubidium activity is deposited on
the protection foil used in evaporation chamber. Drops of
distilled water were applied on this foil and later put away and
purified. The procedure for this purification was the same
as those used for the water rubidium solution obtained
from gas target. Sources prepared in this way No. 9, 10, 12 indicated
large krypton retention, but the amplitude of the zero-energy loss
line was practically zero.
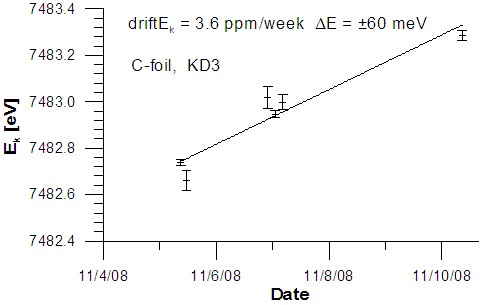
c)
The sources were mostly
carrier free with the calculated mean thickness of about 0.1–0.4
monolayers of radioactive rubidium. The solid source No. 20 was
prepared with addition of nonactive rubidium carrier in amount of
10 monolayers in order to define better the environment of the
83Rb atoms.
Into the water solution with 18 MBq of purified 83Rb 16 g
of RbNO3 (purity 99.99) were added. Finally, the solid source
contained 2 % of the radioactive rubidium and 98 % of the stable
rubidium.
No marked result was achieved, the krypton
retention was higher of a 30 % and the reduced amplitude was lower
but still acceptable . The L1-9.4 line position
exhibits a drift of 3.6 ppm/week, see Fig. 26.
d)
The more simple and faster purification of the rubidium water solution
by means of aerosol filter instead of chromatography column was
tested. The sources No. 22–27 document the results. The Kr
retention was high. The reduced amplitude was
acceptable of when the source was fresh but after
one month it became too low of . The energy of
the L1-9.4 electron line exhibited fully unacceptable large
negative drifts of about –40 ppm/week. For this reason the
aerosol filter technique was rejected from further development.
At an early stage the sources were evaporated onto a Al substrate, similarly as it is described in [14] and [15]. Because the energy of L1-9.4 line exhibited a non zero drift and in order to avoid possible problem with insulating aluminium oxide inherently present on Al foils the next sources were prepared on carbon substrates. Nevertheless, a substantial reduction of the drift or a change in krypton retention with carbon substrate was not observed.
For the first evaporations the boat-substrate distance was kept large, of about 14 mm. The corresponding efficiency of the vacuum evaporation process was only 2–11 %. At the closer distance the efficiency of the vacuum evaporation process was expected to be even lower. Namely, the 83Rb deposited originally on the substrate could evaporate again due to the heat from the boat. However, the tests with closer boat—substrate distances were successful and much higher efficiencies of several tens of percent, were achieved, see Table 2. The dependence between efficiency and the boat—substrate distance is not always smooth. This is very probably caused by the effect of the boat deformation during the boat heating described in Sec. 3.2. Due to this effect the boat-substrate distance can increase or decrease up to 2 mm. The larger value of evaporation efficiency observed for the sources No. 18 and 21 is probably caused by a particular distribution of rubidium deposit in the boat.
In Figs. 23–27 the dependences of the L1-9.4 line position on the date of the measurement for different sources are demonstrated.
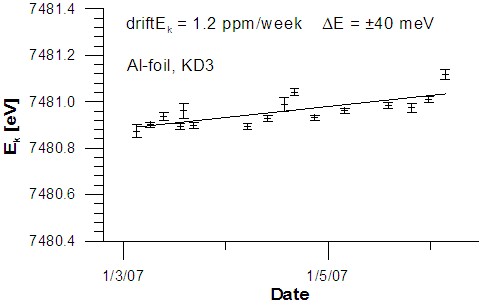

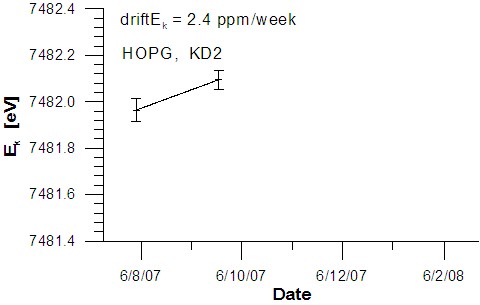
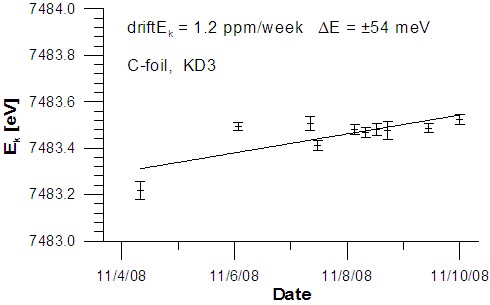
In the figures the type of source substrate and the divider applied (KD2 or KD3) are also shown. For sources and periods of measurements:
-
•
No. 15 5. 3. 07 - 31. 5. 07,
-
•
No. 17 6. 10. 07 - 7. 12. 07,
-
•
No. 21 15. 08. 08 - 30. 11. 08
a particular source was continuously in the spectrometer, i.e. at vacuum condition, occasionally at retarding voltage of 7200. V. The other points in the figures were obtained immediately after installation of the given source into the spectrometer being previously kept at air. The errors of the energies are only the statistical ones. In all cases the energy of the conversion line is increasing with time of the measurement and can be described by linear dependence. The corresponding linear fit is indicated in the figures together with the value of line drift in ppm/week and the mean scatter of the individual measurement relative to the linear fit in meV.
After correction for the drift of KD2 or KD3 divider the drifts of the L1-9.4 line positions are in the range 0.6–2.4 ppm/week. The correction to the voltmeter drift is omitted at this stage of analysis because it is relatively small. Besides, the different sources exhibit different starting value of energy, i.e. the energy measured immediately when the source was installed into the spectrometer. It must be stressed that sources were prepared in different way (e.g. different distance boat-substrate or the activity of the deposit in a boat) originally with the aim to test the modes of the source preparation. Nevertheless, it seems that the properties of the sources are sensitive to the mode of their preparation. This effect can be observed also in the cases where the initial conditions for the source production are quite close together, see e.g. sources 28 and 29. In spite of this the krypton retentions are different, they amount of 19 and 11 %, respectively. Moreover, the first short measurement of sources at ESA12 (just before sending the sources for the measurements at Mainz spectrometer) gave the values of energies for the L-9.4 line which differed by 0.7 eV. Strictly speaking there was a slight difference during production of these sources. When the rubidium water solution for the 29 source boat deposit was prepared an amount of distilled water was added into the eppendorf vessel with rubidium activity in order to wash out all last rubidium activity in the vessel.
On the other side, the mean scatter of conversion line energies along the fitted drift line is reaching only meV for a period of 3 months or more.
4.2 Measurements in Mainz
The measurements using the sources No. 11 and 13 with activities of several hundreds of kBq were performed in 2007. The sources were attached to the cold finger of the existing condensed krypton source setup, consequently the source centering in X-Y plane was very limited, however measurements with cooled sources were also possible. Due to the elimination of the detector magnet and without possibility to move the detector closer to the pinch magnet the detector count rate was reduced and the spectra suffered by lower statistics than expected — the count rate for the K-32 conversion electrons was only 30 . By cooling the source to 119 K (the boiling point of krypton) the detector rate increased up to 400 . Evidently, the krypton retention increased to 100 %. In this case the statistical error for the energy of K-32 electrons approached 10 meV after 12 hours of measurement. Unfortunately, the long term operation with cooled sources is not suitable. Condensation of the rest gas on the source changes its properties, including the energy of emitted electrons.
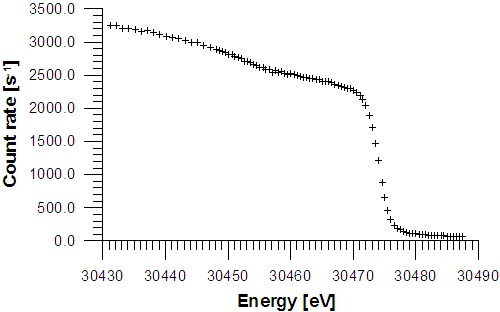
The next measurement in Mainz was started in August 2008 and will be finished during the first quarter of 2009. For this experiment vacuum evaporated rubidium sources No. 28 and 29 with activities of 5 MBq each were prepared, see Table 2. Now the sources could be aligned by means of the X-Y-Z system. Till now only the results of the source No. 28 are available. After installation of the source into the spectrometer, the measurements of spectra of different conversion electrons were performed for a period of 80 days. Using the same spectrometer distance source-magnet center as in 2007 year a substantially larger count rate of about 1200 s-1 for K-32 electrons was achieved. A statistical error of 10 meV could be obtained within 3 hours of measurement. The time of one individual measurement was 1-3 hours. In Figs. 28–30 typical integral spectra of conversion electrons L1-9.4, K-32 and L3-32 are displayed.
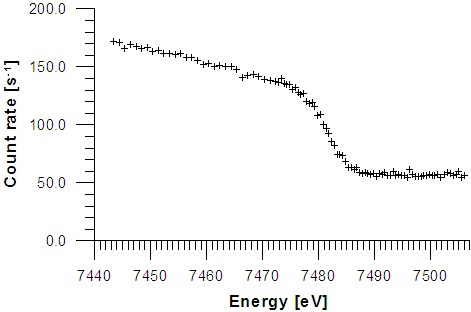

The time of the measurement at a particular voltage was 40 seconds. The part of the spectrum where the step occurs is important for the precision of the line position determination. This region was measured with smaller voltage step in order to accumulate larger statistics. The spectrum in Fig. 28 exhibits low statistics although the L1-9.4 line is the strongest in 83Rb decay. It was not possible to extract the full count rate due to the overlap of the line with the detector noise .
In the experiment the main attention was paid to the stability of the energy of the K-32 conversion line. The 80 days of measurement can be divided into 3 periods. The time dependence of the K-32 line position for these periods is shown in Figs. 31–33.
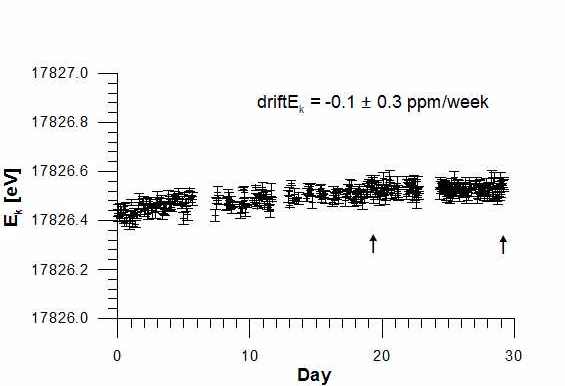
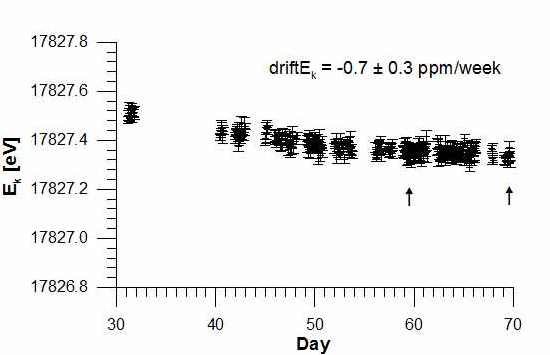
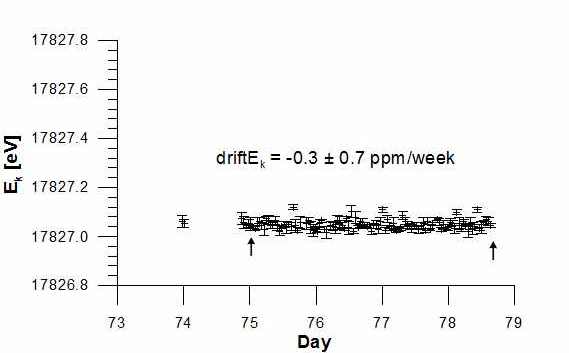
The values of the energies are corrected for the drift of the voltmeter. On the other side, the drift of the dividing ratio (+0.15 ppm/week) is not taken into account. The region of days where the K-32 line position was most stable, is indicated in each figure by arrows — the corresponding value of the drift is added. The first period includes the measurements started two days after source installation and finished on the 30th day where the jump of 0.9 eV in energy of K-32 line appeared. This jump was accompanied by the failure of temperature regulation of the HV divider. Due to the failure the temperature inside the divider increased. At the same time when the HV divider failed one of the two supplies for the earth field compensation coil failed also. So the magnetic field lines from spectrometer filter electrode to the source may appear. This could guide electrons and/or negative ions (e.g. H-) to the source. Since they are accelerated with the filter voltage, they could do some changes to the source surface. In the first period the K-32 energy is raising with decreasing slope — an effect of saturation is visible, see Fig. 31. After divider and supply repair the measurement continued, however the jump in energy of the K-32 line remained. The same jump was observed also for the L1-9.4, L3-32 and N2,3-32 lines. In spite of large efforts devoted to this event the reason for such a large and sudden jump in energy remains unexplained. The influence of the HV supply, HV divider or voltmeter was excluded by the dedicated tests. The change of the source surface by negative ions and the sudden change in the spectrometer work function or in source property itself seems to be the only reasonable explanation for the observed jump effect. The measurements of the K-32 spectra after the jump in energy show again saturation, this time the energy is decreasing, see Fig. 32.
After 70th day the source was heated up to 70∘ C for 10 hours in order to test the heating procedure itself (the heating is intended to be used for the next source No. 29 in order to speed up again the expected saturation effect). For heating the source was moved back and isolated by a vacuum valve from the spectrometer. After heating, when the source temperature was again at room temperature, the measurements of the lines K-32, L1-9.4, L3-32 and N2,3-32 were performed. The energies for all lines were increased by 25 meV. The amplitude of the K-32 electron line was reduced by only 2 %. Altogether, the heating procedure is applicable for the solid 83Rb/83mKr source. For the next measurements source and detector were moved closer to the source and detector magnets as the source activity was reduced due to the radioactive decay. The detector rate for the K-32 lines increased by factor 3. The result of 5 days measurement is displayed in the Fig. 33. Due to the higher statistics the band of energy values is slightly more narrow in comparison with measurements in the previous period. But the values are reduced by 0.36 eV. This decrease is a result of the source and detector geometry change. It indicates the still insufficient alignment of the source and detector.
The drifts obtained for the K-32 energy saturation for the first and third period are compatible with the stability requirement 60 mV in 2 months.
5 Conclusion and Outlook
The experience gained during the development of the solid 83Rb/83mKr sources showed that all future sources must be produced as reproducibly as possible. This concerns also the activity which itself must be about 10 MBq. Sources with such activity and moderate 83mKr retention of 10–20 % can be used at the monitoring spectrometer for 4–6 months. The future measurements at ESA12 spectrometer will be mainly for long term stability assessment ( 2 months), keeping the source all the time in vacuum. The technique of source heating could be introduced.
The results of the measurement at Mainz are promising. Unlike to the results at Řež, an effect of saturation of the K32 line energy value with time was observed. Of course, the next measurement with the source No. 29 will be very important. The present result of the Mainz measurements with the source No. 28, indicates that such a source has a perspective to be used for monitoring at least for 2 months, a typical time of the KATRIN individual experimental run. Especially, the observation of the very small drifts 0.1(3) and -0.3(7) ppm/week of the K32 line in periods were the source-spectrometer system was stable is encouraging.
6 Acknowledgment
We thank to M. Fišer and J. Stanislav for the design and production of the krypton gas target. We are also obliged to P. Hanč for handling of the krypton gas target. The authors wish to thank M. Beck and H.W. Ortjohann for the help with the design and production of equipment for the source installation at Mainz spectrometer. We wish to express our gratitude to B. Ostrick for fruitful discussions during measurements in Mainz. We are indebted to T. Thümmler for valuable advices concerning the KATRIN HV divider and precise DC voltage measurement. We gratefully acknowledge valuable communications with E.W. Otten.
This work was performed under the auspices of the Academy of Science of the Czech Republic under contract ASCR IRP AV0Z10480505. Further support by the Grant Agency of the Czech Republic under contract No. 202/06/0002 and by the MŠMT under contracts LA318 and LC07050 is highly appreciated. Two of us (D. Vénos and A. Kovalík) were supported by the Deutsche Forschungsgemeinschaft. We acknowledge University of Mainz and the hospitality of the Institute of Physics for performing the measurements at the Mainz spectrometer. The Mainz and Münster groups were supported by grants of BMBF.
References
- [1] W.M. Yao et al. (Particle Data Group), J. Phys. G: Nucl. Part. Phys. 33(2006)1, http://pdg.lbl.gov.
- [2] Ch. Kraus, B. Bornschein, L. Bornschein, J. Bonn, B. Flatt, A. Kovalik, B. Ostrick, E.W. Otten, J.P. Schall, Th. Thümmler, Ch. Weinheimer, Eur. Phys. Jour. C40(2005)447.
- [3] V.M. Lobashev, Nucl. Phys. A719(2003)153c.
- [4] J. Angrik, T. Armbrust and al., KATRIN Design Report 2004, Report NPI ASCR Řež EXP-01/2005 or FZKA Scientific Report 7090, Karlsruhe, http://www-ik.fzk.de/katrin/publications/index.html.
- [5] J. Kašpar, M. Ryšavý, A. Špalek, O. Dragoun, Nucl. Instr. Meth. Phys. Res. A527(2004)423.
- [6] T. Thümmler, Präzisionsüberwachung and Kalibration der Hochspannung für das KATRIN-Experiment, PhD Thesis, University of Münster, 2007.
- [7] R.G.H. Robertson, T.J. Bowles, G.J. Stephenson, Jr., D.L. Wark and J.F. Wilkerson, Phys. Rev. Lett. 67(1991)957.
- [8] W. Stoeffl, D.J. Decman, Phys. Rev. Lett. 75(1995)3237.
- [9] A. Picard, H. Backe, J. Bonn, B. Degen, R. Haid, A. Hermanni, P. Leiderer, A. Osipowicz, E.W. Otten, M. Przyrembel, M. Schrader, M. Steininger, Ch. Weinheimer, Z. Phys. - Hadr. Nucl. A342(1992)71.
- [10] V.N. Aseev, A.I. Belesev, A.I.Berlev, E.V. Geraskin, O.V. Kazachenko, Yu.E. Kuznetsov, V.M. Lobashev, R.P. Ostroumov, N.A. Titov, S.V. Zadorozhny, J. Bonn, B. Bornschein, L. Bornschein, E.W. Otten, M. Przyrembel, Ch. Weinheimer, A. Saenz, Eur. Phys. J. 10(2000)39.
- [11] B. Bornschein, J. Bonn, L. Bornschein, E.W. Otten, Ch. Weinheimer, J. Low Temp. Phys. 131(2003)69.
- [12] D. Vénos, O. Dragoun, A. Špalek, M. Vobecký, Nucl. Instr. Meth. Phys. Res. A560(2006)352.
- [13] B. Ostrick, Eine kondensierte 83mKr Kalibrations-Quelle für das KATRIN-Experiment, PhD Thesis, University of Münster, 2008.
- [14] A. Kovalík, V.M. Gorozhankin, A.F. Novgorodov, A. Minkova, M.A. Mahmoud, Jour. Elec. Spec. Rel. Phen. 58(1992)49.
- [15] A. Kovalík, V.M. Gorozhankin, Jour. Phys. G: Nucl. Part. Phys. 19(1993)1921.
- [16] A. Kovalík, International Workshop on Massive Neutrinos in sub-eV Region, Bad Liebenzell, Germany, January 18-21, 2001.
- [17] D. Briggs, J.T. Grant (eds.), Surface Analysis by Auger and X-ray Photoelectron Spectroscopy, IM Publication and Surface Spectra Ltd., 2003.
- [18] M. Fišer, V. Brabec, O. Dragoun, N. Dragounová, M. Ryšavý, A.Kh. Inojatov, International Worksop on Precise Measurement in Nuclear Spectroscopy, p.81, Sarov, Russia, Sept 2-6, 1996.
- [19] A. Špalek, O. Dragoun, A. Kovalík, E.A. Yakushev, M. Ryšavý, J. Frána, V. Brabec, A.F. Novgorodov, I. Cserny, J. Tóth, D. Varga, L. Kövér, Nucl. Instr. Meth. Phys. Res. B196(2002)357.
- [20] R.B. Firestone, V.S. Shirely, C.M. Baglin, S.Y. Frank Chu, J. Zipkin, Table of isotopes, eighth ed., Wiley, New York, 1996, 1998(update).
- [21] F. Rösel, H.M. Fries, K. Alder, H.C. Pauli, At. Data and Nucl. Data Tab. 21(1978)91.
- [22] K. Siegbahn, C. Nordling, G. Johansson, J. Hedman, P.F. Hedén, K. Hamrin, U. Gelius, T. Bergmark, L.O. Werme, R. Manne and Y. Baer, ESCA applied to free molecules, North-Holland Amsterdam-London, 1969.
- [23] S. Väisälä, G. Graeffe, J. Heinonen, A.A. Delucchi, R.A. Meyer, Phys. Rev. 13C(1976)372.
- [24] J.L. Campbell, T. Papp, At. Data and Nucl. Data Tab. 77(2001)1.
- [25] O. Dragoun, A. Špalek, F. J. Wuilleumier, Czech J. Phys. 54(2004)833.
- [26] J.K. Tuli, Nucl. Data Sheets 92(2001)930.
- [27] T.A. Carlson, C.W.Nestor, Jr., Phys. Rev. A8(1973)2887.
- [28] D.L. Wark, R. Bartlett, T.J. Bowles, R.G.H. Robertson, D.S. Sivia, W. Trela, J.F. Wilkerson, Phys. Rev. Lett. 67(1991)2291.
- [29] F.T. Porter, M.S. Freedman, F. Wagner, Jr., Phys. Rev. C3(1971)2246.
- [30] K. Siegbahn, C. Nordling, A. Fahlman, R. Nordberg, K. Hamrin, J. Hedman, G. Johansson, T. Bergmark, S.E. Karlsson, I. Lindgren, B. Lindberg, ESCA atomic, molecular and solid state structure studied by means of electron spectroscopy, Uppsala, Dec. 3rd, 1965.
- [31] A. Špalek, Surf. Inter. Anal. 15(1990)739.
- [32] R Shimizu, D. Ze-Jun, Rep. Prog. Phys. 55(1992)487.
- [33] J.M. Fernández-Varea, D. Liljequist, S. Csillag, R. Räty, F. Salvat, Nucl. Instr. Meth. Phys. Res. B108(1996)35.
- [34] M. Fišer, V. Brabec, O. Dragoun, A. Kovalík, J. Frána, M. Ryšavý, Int. J. Appl. Radiat. Isot. 36(1985)219.
- [35] A. Kovalík, V.M. Gorozhankin, Ts. Vylov, D.V. Filosofov, N. Coursol, E.A. Yakushev, Ch. Briançon, A. Minkova, M. Ryšavý, O. Dragoun, Jour. Elec. Spec. Rel. Phen. 95(1998)1.
- [36] N.A. Lebedev, private communication, 2006.
- [37] P. Weightman, Rep. Prog. Phys. 45(1982)753.
- [38] D.A. Shirley, R.L. Martin, S.P. Kowalczyk, F.R. McFeely, L.Ley, Phys. Rev. 15B(1977)544.
- [39] Z. Kovács, F. Tárkánayi, S.M. Qaim, G. Stöcklin, App. Rad. Isot. 24(1991)329.
- [40] D. Vénos, A. Špalek, O. Lebeda, M. Fišer, App. Rad. Isot. 63(2005)323.
- [41] X. Llopart, R. Ballabriga, M. Compbell, L. Tlustos, W. Wong, Nucl. Instr. Meth. A581(2007)485.
- [42] D. Vénos, J. Jakubek, O. Dragoun, S. Pospíšil, Report NPI ASCR REZ, EXP-01/2007, http://arXiv.org/abs/0712.3860.
- [43] M.C. Lépy, B. Duchemin, J. Morel, Nucl. Instr. Meth. Phys. Res. A353(1994)10.
- [44] D. Varga, I. Kádár, A. Kövér, I. Cserny, G. Mórik, V. Brabec, O. Dragoun, A. Kovalík, J. Adam, Nucl. Instr. Meth. 192(1982)277.
- [45] O. Dragoun, M. Ryšavý, N. Dragounová, V. Brabec, M. Fišer, Nucl. Instr. Meth. A365(1995)385.
- [46] N. Dragounová, IEEE Transactions on instrumentation and measurements, 54(2005)1911.
- [47] R. Marx, private communitation, PTB Braunschweig, 2007.
- [48] A. Inojatov, PhD Thesis, Dubna, 1986, p.81.
- [49] M. Ryšavý, J. Kašpar, Nucl. Instr. Meth. Phys. Res. A594(2008)97.
- [50] A. Picard, H. Backe, H. Barth, J. Bonn, B. Degen, Th. Edling, R. Haid, A. Hermanni, P. Leiderer, Th. Loeken, A. Molz, R.B. Moore, A. Osipowicz, E.W. Otten, M. Przyrembel, M. Schrader, M. Steininger, Ch. Weinheimer, Nucl. Instr. Meth. Phys. Res. B63(1992)345.