Comprehensive study of sodium, copper, and silver clusters
over a wide range of sizes
Abstract
The geometric and electronic structures of NaN, CuN, and AgN metal clusters are systematically studied based on the density functional theory over a wide range of cluster sizes . A remarkable similarity is observed between the optimized geometric structures of alkali and noble metal clusters over all of the calculated cluster sizes . The most stable structures are the same for the three different metal clusters for approximately half the cluster sizes considered in this study. Even if the most stable structures are different, the same types of structures are obtained when the meta-stable structures are also considered. For all of the three different metal clusters, the cluster shapes change in the order of linear, planar, opened, and closed structures with increasing . This structural type transition leads to a deviation from the monotonic increase in the volume with . A remarkable similarity is also observed for the dependence of the cluster energy for the most stable geometric structures. The amplitude of this energy difference is larger in the two noble metal clusters than in the alkali metal cluster. This is attributed to the contribution of electrons to the bonds. The magic number is defined in the framework of total energy calculations for the first time. In the case of NaN, a semi-quantitative comparison between the experimental abundance spectra (Knight et al., Phys. Rev. Lett. 52, 2141 (1984)) and the total energy calculations is carried out. The changing aspect of the Kohn-Sham eigenvalues from to is presented for the three different metal clusters. The feature of the bulk density of states already appears at for all of three clusters. With increasing , the HOMO-LUMO gap clearly exhibits an odd-even alternation and converges to 0. Although there is a similarity in the dependence of the HOMO-LUMO gap between the three metal clusters, it is much stronger between the two noble metal clusters. The growth aspect of the band below the Fermi level of the noble metal clusters with increasing is presented. A good correspondence is observed in the characteristic of the electronic states between the cluster composed of 75 atoms and the bulk metal. The similarities observed in the dependence of the geometric structures and s originate from the similarity in that of the electronic structures.
I Introduction
It is beneficial to study the geometric structures and various electronic properties of clusters as an intermediate phase of materials between isolated and condensed systems; the combination of quantum chemistry and solid state physics will result in further developments in the field of materials science. In the basis of the density functional theory (DFT) HK ; KS , an ab initio many-body theory for systems in the ground state, a detailed comparative study of the most and meta-stable geometric and electronic structures of three different metal clusters - NaN, CuN, and AgN - is systematically carried out over a wide range of . The three types of atoms composing those clusters have a common feature in that the outermost valence electron is one electron. The changing and converging aspects of the geometric and electronic structures of alkali and noble metal clusters from a diatomic molecule (dimer) to a condensed system have been presented explicitly and compared for the first time. A simple review of previous studies on clusters is presented below.
In 1984, a study was carried out based on the Woods-Saxon type shell model Knight to explain the distinctive peak observed in the abundance spectra of a NaN cluster at special value of (, …) evaluated in an experiment. Using this shell model, the electronic structures of simple metal clusters based on a simple spherical effective potential using phenomenological parameters. In this model, the Coulomb interactions between electrons are completely neglected. In a later study, the anormalous -dependent stability of a NaN cluster was studied based on various types of shell models such as a harmonic oscillator, with the effect of Coulomb interactions being neglected Clemenger .
In addition to simple shell models, various types of jellium models Chou ; Ekardt-1984 ; UJM were adopted for NaN clusters. In jellium models for metal clusters, the equilibrium ionic configuration of a cluster is averaged and replaced by a uniform or nearly uniform potential with a surface boundary. In most previous studies, the jellium models were incorporated with the DFT and the total energies were evaluated.
In model-based studies of NaN, the -dependent cluster stability was evaluated based on the shell correction energy, curvature of the sum of the electronic eigenvalues, and total energy Brack-RMP-1 ; LDM ; Nishioka ; Bjornholm ; Genzken ; Brack-RMP-2 ; deHeer-RMP ; Chou ; Ekardt-1984 ; UJM ; Kumar-Kawazoe-review . For the evaluation of the -dependent total energy, a semi-quantitative comparison with the peak intensity in the experimental abundance spectra Knight-deHeer was also carried out.
However, cluster studies based on these models differ from those based on the first principles calculations, which directly relate the geometric structures to the electronic structures. Even if the experimental magic number for a particular value of is obtained accidentally, these models are not based on a close relationship between the geometric and electronic structurtes of real NaN clusters. Furthermore, using these models, it is impossible to study the similarities and differences between the alkali metal cluster NaN and the noble metal clusters CuN and AgN because the electron in the outermost shell as well as electrons in the inner shell contribute to bonding in the latter.
Recenly, the most and meta-stable structures of NaN, CuN, and AgN clusters were determined for from first principles calculations based on DFT 3-Kronig ; Itoh-1 ; ref-Itoh-1 ; Yang-1 ; Yang-2 . In this study, an extremely systematic comparative study based on DFT was carried out for the three different metal clusters up to . Our study successfully reproduced the results of stable geometric structures obtained in previous studies; furthermore, it successfully discovered the convergence aspects of the electronic structures of clusters with those of bulk metals.
In section II, the computational method and the approximation are described. In section III, for the most and meta-stable structures are systematically classified and the similarities and differences between the three different metal clusters are described. In section IV, the dependence of the ground state energy of the most stable cluster structure is analyzed. In section V, all aspects of the electronic structure of the clusters including the odd-even alternation of the HOMO-LUMO gap are described. In section VI, the conclusion of this study is presented.
II Computational Methods
An exact many-body theory for a ground state system DFT HK ; KS - was employed to study the geometric and electronic structures of NaN, CuN, and AgN clusters. In this theory, the many-body Schrödinger equation is transformed into a self-consistent Schrödinger - type equation for a virtual one - electron in the reference system. This equation is called the Kohn-Sham equation and it is derived from the Hohenberg-Kohn variational principles, namely, . In the DFT, various physical properties of materials such as the exact ground state total energy can be evaluated if the exact exchange-correlation energy functional is adopted. In principle, the exact ionization energy for a system can be evaluated as the highest occupied molecular orbital energy by solving the Kohn-Sham equation. The other orbital energies are considered to approximately describe the quasiparticle energy.
In this study, the generalized gradient approximation (GGA) proposed by Perdew and Wang (PW91) PW91 is employed for the exchange-correlation energy functional. The spin polarization of the system was also considered. In the local density approximation (LDA), which was the first approximation developed for the exchange-correlation energy functional, the energy functional for a real inhomogeneous system is locally approximated by an energy functional of a homogeneous electron liquid. The main disadvantage of the LDA is the incomplete cancellation of the self-interaction fused into the Hartree potential by the exchange potential. This leads to an incorrect description of the electronic properties when electrons are strongly localized in the system. In fact, the GGA was developed to overcome this disadvantage of the LDA. It improves upon the approximation of several physical properties such as interatomic distance and cohesive energy in many systems.
In order to reduce the number of plane waves used in the calculation of the electronic structure, a pseudopotential method is employed for an approximation of the nucleus, inner core electrons, and valence electrons. An unempirical pseudopotential called ultrasoft pseudopotential, which is known to have good transferability Vanderbilt , was employed. In a manner similar to other methods, relativistic correction terms such as the mass velocity and the Darwin terms are included in the pseudopotentials. For Na, Cu, and Ag atoms, 3, , and electrons were explicitly treated as the valence electrons, respectively.
A local orbital basis set is commonly adopted within a real space representation for the electrons of isolated systems such as atoms, molecules, and clusters. However, it is difficult to converge the total energy effectively because some expertise is required to select the basis function for each atom.
Instead of treating the isolated system as is, the total energy can be effectively converged by using a plane wave basis set within a reciprocal space representation, which is frequently used in periodic systems. Here, isolated systems are approximated by pseudo-crystal systems constructed using arranged isolated systems having sufficient space between them.
In this method, the total energy can be effectively converged by simply increasing the cut-off energy of a plane wave expansion. The total energy of the cluster is approximately evaluated from the total energy of the pseudo-crystal system per unit cell. Another advantage of employing this method is that it is possible to evaluate the total energies and electronic structures of the clusters and bulk solids using a single method.
However, the latter method has two disadvantages in the study of isolated systems. The first is the incompleteness of removing the interaction between isolated systems. The second is the inability to separate the total energy into the kinetic energy term of electrons, and potential terms between electron and electron, electron and nucleus, and nucleus and nucleus. This is because the Ewald method Ewald is adopted for the evaluation of the total energy. In this method, the total energy is effectively converged by separating the Coulomb potential into the short- and long-range parts, and then treating the former in the real space and the latter in the reciprocal space.
The edge length of each cubic unit cell of the pseudo-crystal systems was set to be 2030 Å for NaN clusters, and 1530 Å for CuN and AgN clusters. It was confirmed that these lengths are sufficiently large to neglect the electronic wave vector dependence in these electronic structures. The cut-off energy for the plane wave expansion was set to be 48.7, 233.7, and 180.7 eV for NaN, CuN, and AgN, respectively. Brillouin zone integration was carried out only for the -point in the pseudo-crystal system. This k-point selection is known to be the most effective in the calculation of an isolated system. The residual minimization scheme, direct inversion in the iterative subspace algorithm was adopted for the effective self-consistent calculation of the electronic structures RMM-DIIS-1 ; RMM-DIIS-2 . The convergence criterion of the total energy was set to be within 1 eV.
Geometric structures of the clusters were optimized from several hypothetical initial structures using an optimization algorithm called the conjugate gradient method Payne . As initial structures in the geometry optimization procedure for NaN and CuN, the optimized cluster structures obtained from empirical atomic pair potentials such as Lennard-Jones, Morse, Sutton-Chen, etc. Cambridge , were employed along with optimized structures based on first principles calculations that were obtained in previous studies Itoh-1 ; ref-Itoh-1 ; Yang-1 .
In addition to these structures, structures expected to exist from the experimental photoelectron spectra Wrigge ; Issendorff-private ; Hakkinen-2004 ; Kostko-2005 ; Kostko-2007 and those expected to exist in the neighborhood of the local minimum points on the potential energy surface from our experience of the optimization procedures for these systems Itoh-1 were selected. The optimized structures of NaN and CuN obtained in this study were employed as the initial structures of AgN in the geometry optimization procedure, and the interatomic distances satisfying the nearest neighbor atomic distance ratio between the Na, Cu, and Ag bulk crystals were scaled.
The electronic density of states of the Na, Cu, and Ag bulk crystals were calculated for comparison with those of the clusters. The same cut-off energies and optimization method used for the cluster systems were also used for the bulk calculations. The lattice constants were optimized for the hcp and bcc structures for Na, and the fcc structure for Cu and Ag. Brillouin zone integration was carried out for the k-point meshes generated by Monkhorst-Pack scheme Monkhorst . For the bulk bcc, fcc, and hcp structures, the number of meshes were selected to be 8 8 8, 8 8 8, and 8 8 4, respectively. The convergence criteria of the total energy for the bulk bcc, fcc, and hcp structure were set to be within 1.0 , 1.0 , and 5.0 eV/atom, respectively.
The nearest neighbor diatomic distances, binding energies, and bulk moduli for the dimers and bulk crystals are presented, in the Appendix.
The Vienna Ab-initio Simulation Package (VASP) was employed in this study Kresse .
III Cluster Geometries
III.1 dependence of most and meta-stable structures
In general, unlike the case of molecules, clusters have various energetically nearly degenerated meta-stable structures. Therefore, the meta-stable as well as most stable structures must be considered for understanding cluster-related phenomena.
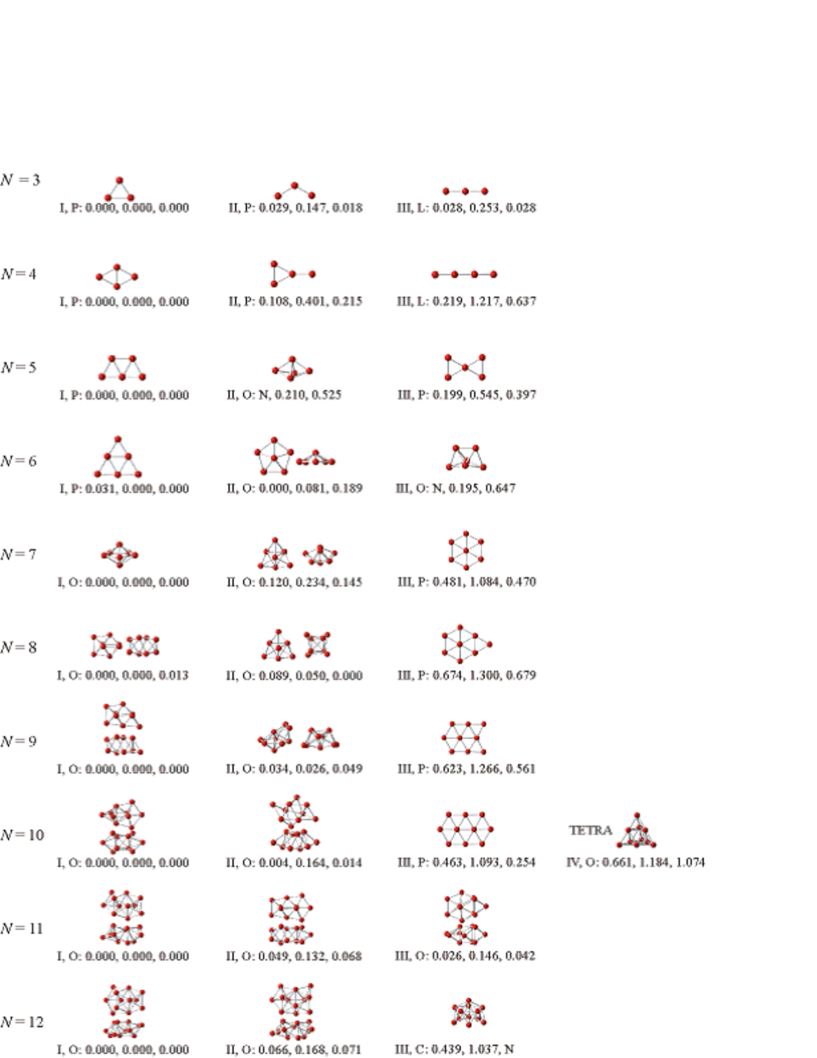
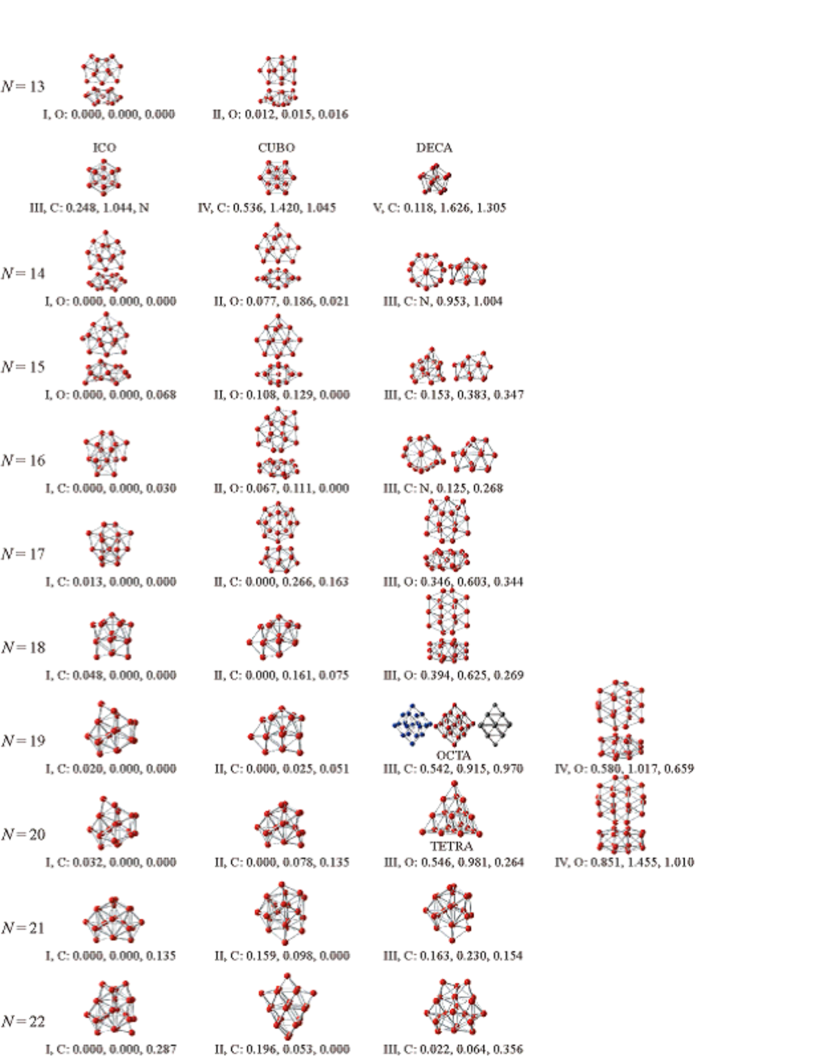
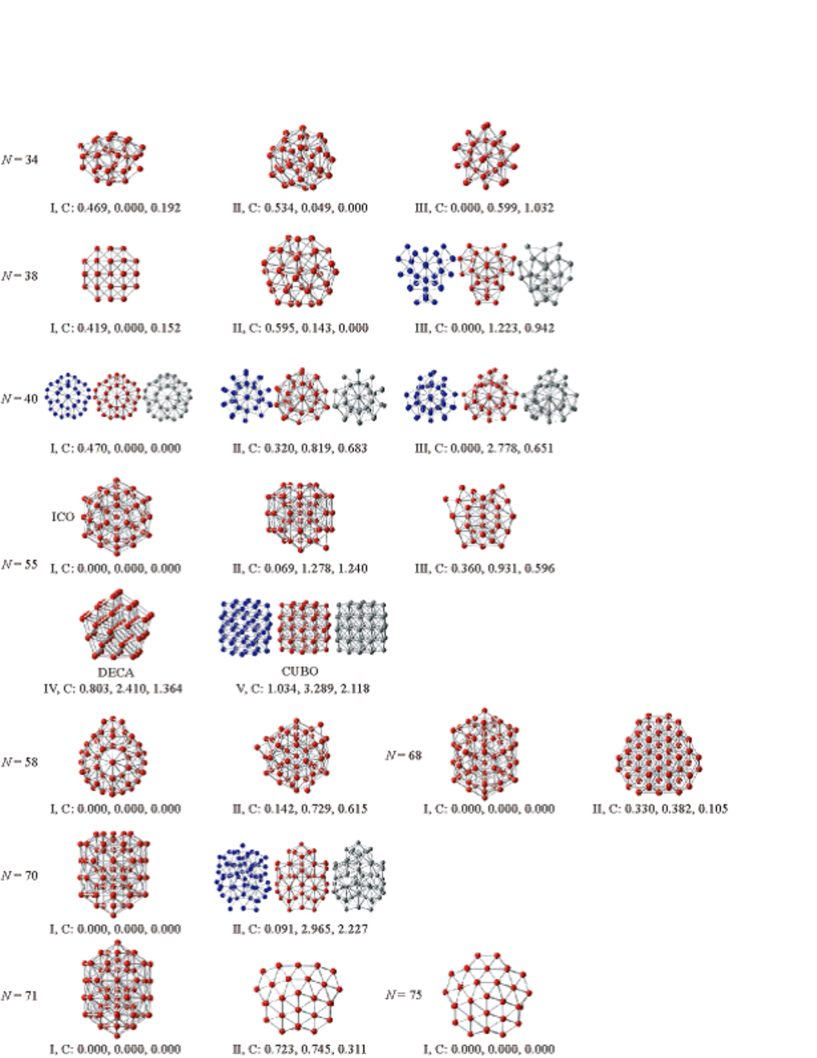
Figures 1, 2, and 3 show the most and meta-stable structures of the NaN, CuN, and AgN clusters for , , and , respectively. In these figures, the meta-stable structures are carefully selected to show the structural type transition, as described below. Almost all of the most and meta-stable structures of the NaN, CuN, and AgN clusters are similar. Therefore, to save space, the cluster structures are represented by the structure of CuN in the figure. The types of these structures are classified by the notations I, II, III, IV, and V. This classification obeys the order of stability in the structural type of CuN. The symbols L, P, O, and C after I, II, III, IV, and V indicate linear, planar, opened, and closed structures, respectively. For a detailed analysis of the correlation between the structural type and the energetical stability of the clusters, these structural types should be further classified according to the symbols. Both opened and closed structures are three-dimensional. The coordination number (CN) is a necessary concept for the classification of these three-dimensional structures. Although the CN can also be defined for linear and planar structures, it is not required for the classification in this study. An opened structure is defined as one without atoms whose CNs are greater than or equal to 11. Other three-dimensional structures are defined as closed structures. The three values listed after the symbols L, P, O, and C represent the relative energies of the most stable structures of NaN, CuN, and AgN, respectively. A value of 0.000 is assigned to the most stable structure, and the relative energies of the meta-stable structures are expressed in electron volts.
We consider the case of as an example. As shown in FIG.1, the structural type of the most stable structure in Na6 is II, while that in Cu6 and Ag6 is I. The structural types of the 2nd stable structures I in Na6 are I and in Cu6 and Ag6, II. The structural type of the 3rd stable structures in Cu6 and Ag6 is III. However, structure III is not found in Na6. A symbol N indicates a structural type that has not been found. The two different figures of structure II show the same cluster structure viewed from different angles. Such different figures for the same structure are also shown for the other values of . Structural type IV at corresponds to Plato’s polyhedron. The numerous highly symmetric structures including Plato’s polyhedron are labeled as TETRA, OCTA, ICO, CUBO, and DECA, and they respectively represent a tetrahedron, octahedron, icosahedron, cuboctahedron, and decahedron, respectively. As shown in FIGS.2 and 3 the three structures composed of blue, red, and silver spheres represent the structures of NaN, CuN, and AgN, respectively These structures are shown to emphasize the relatively large structural differences from the relation of similarity.
The following conclusions are obtained from the most and meta-stable structures of the clusters. The optimized structures of the NaN, CuN, and AgN clusters are almost identical if the most and meta-stable structures are simultaneously considered. In particular, the most stable structure of the three clusters for can be identified with high probability. For and , all of the most stable structures of the three clusters are different. For , the most stable structures of alkali and noble metal clusters clearly differ. For , all of the three different clusters favor structural type I (icosahedral structure) for their most stable structure. The 2nd and 3rd stable structures at include an atomic vacancy in an icosahedral flame Itoh-2 . For all of the three different metal clusters, these meta-stable structures are more stable than the higher symmetric structures such as a decahedron and cuboctahedron. Generally, it is difficult to define an atomic vacancy in a cluster because it is a system without periodicity in the structure. However, an icosahedral structure can be considered to be a structure that is cleaved from a quasicrystal. In fact, is the minimum number that shows an atomic vacancy stability in the cluster structure. For , with increasing , structures of the clusters approach the periodic bulk crystal structure. Therefore, it is expected that the probability of vacancy formation will increase in finite cluster systems.
An overview of the structural type transition of the most stable structures in NaN, CuN, and AgN clusters with increasing is described below. The structures of NaN, CuN, and AgN clusters are stable in a linear structure at , planar structure at (Na), (Cu, and Ag), opened structure at (Na), (Cu and Ag) (Na and Cu), (Ag), and closed structure at (Na and Cu), (Ag). Systems comprising for or more atoms can possibly assume three-dimensional structures such as a tetrahedron and trigonal pyramid. However, for all of the three different metal clusters, the most stable structures are not three-dimensional at (Na), (Cu, and Ag). At , the 3 dimensional structures are not stable for these systems. Instead, a rhombus structure is stable at . A three-dimensional structure such as a tetrahedron is realized in other metal clusters such as Mg4 Mg .
The stable cluster structures obtained in this study can be roughly understood from knowledge of the electronic states using the spherical jellium model. The main difference between the first principles model used in this study and the spherical jellium model is the manner in which the atomic configuration in the cluster is treated. In the spherical jellium model, only the outermost valence electrons in the each atom composing the cluster are considered as valence electrons. The other electrons and nuclei are unified into an uniform positive charge distribution with a spherical surface boundary. Therefore, the valence electrons in the spherical jellium model reside in the central force field. As a result, each degenerated valence electronic state is specified with a monoangular momentum: , in a manner similar to the case of electrons in an atom and protons and neutrons in a nucleus. The stable structures of the metal cluster obtained in this study can be roughly considered as those satisfying the cluster shapes followed by the valence electronic density distribution that originates from the occupied orbitals in the spherical jellium model.
III.2 dependence of the averaged nearest neighbor distance and coordination number
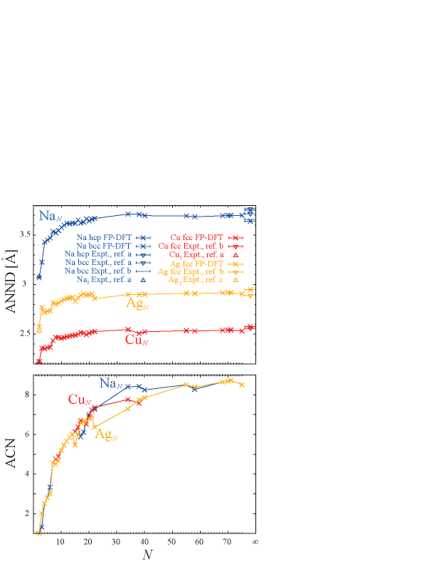
Figure 4 (a) shows the averaged nearest neighbor distance (ANND) of the most stable structures of NaN, CuN, and AgN clusters for . ANND is defined as the sum of the nearest neighbor atomic distances divided by the number of bonds in a cluster. As shown in the figure, the ANND value of the cluster reaches approximately 90 of the bulk value at for all of the three different clusters. However, the ANND does not converge to the bulk value at , and the values are approximately of the bulk ones. Over the entire range of , the ratio of ANND among the three different clusters agrees well with that of the bulk crystals.
Figure 4 (b) shows the averaged coordination number (ACN) of the most stable structures of NaN, CuN, and AgN clusters over the range of . ACN is defined as the sum of the nearest neighbor coordinated atomic number for all atoms composing the cluster divided by . The dependence of ACN for the three different clusters is similar; it should be noted that the ACN values do not reach 9 (75 of the bulk value of 12) even at . This is attributable to the existence of a surface in the cluster.
III.3 Difference between planar structures of sodium, copper, and silver clusters
As described in section III. A., the most and meta-stable structures of the three different metal clusters are quite similar. Here, the cluster structures having the same structural type are compared quantitatively using structure III at as an example. FIG. 5 shows the details of the structures, represented by the Cu7 structure as an example. The three values represent the angle or interatomic distance of Na7, Cu7, and Ag7, respectively. These values are expressed in degrees or angstroms, respectively. The blue and green values in parentheses represent the relative angle ratios: angle (distance)/angle(distance) and angle(distance)/angle(distance), respectively.
Structure III in Na7 belongs to the point group, while in Cu7 and Ag7, it belongs to the point group; all of these structures are 3rd stable structures. These structures have a Jahn-Teller deformation JT in the equilateral hexagon in the point group. As expected, the relative angle ratio of Ag7 is closer to 1 than that of Na7. This is a typical example that indicates the stronger similarity between the two noble metal clusters. However, there are several exceptions in clusters having a larger value of . This may occur due to the increase in the number of degrees of freedom in the atomic positions. Therefore, it is not possible to present an oversimplified picture of the degree of similarity in these cluster structures.
III.4 dependence of the averaged atomic density
The averaged atomic volume of cluster is defined as
| (1) |
Here, indicates the an averaged distance between each atomic coordination and center of mass in a cluster. In other words, is given as
| (2) |
To compare the dependence of for the different metal clusters, each is normalized to that of a dimer. i.e., .
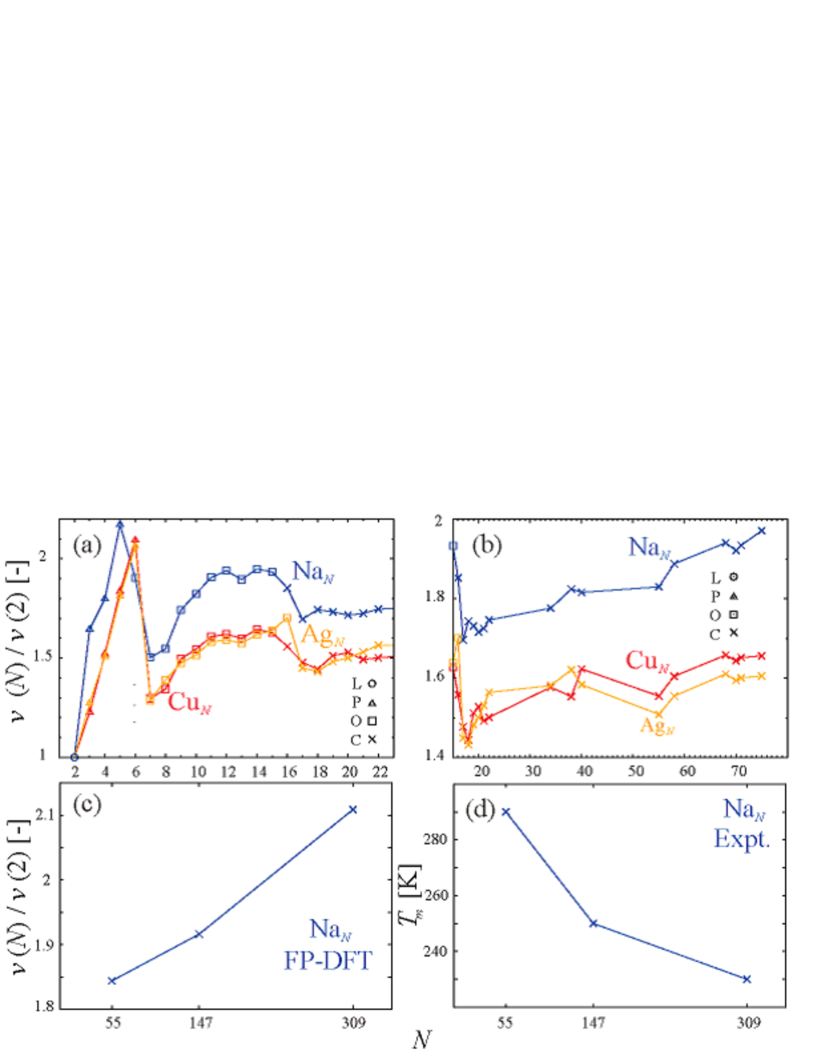
Figure 6 (a) shows the dependence of a normalized volume for the most stable structures of NaN, CuN, and AgN for . The dependence of the normalized volume is very similar in the three metal clusters. The trends of the change in the dependence at transition sizes between different structural types are indicated using the symbols L, P, O, and C. decreases significantly at from P to O. Further, significant decreases are observed at from O to C.
Figure 6 (b) shows the volumes of the most stable structures in the range of . Here, the scale of is expanded to show the change clearly. In general, for , increases monotonically with for all of the three metal clusters. However, it should be noted that the values decrease significantly with increasing between Cu40 (Ag40) and Cu55 (Ag55), unlike the case of Na40 and Na55. This can be attributed to the effect of d electrons in that they may shrink the interatomic distances of the quasi-spherical structure-an icosahedron which is the most stable structure at .
Figure 6 (c) shows of the most stable structure (icosahedron) of NaN for , and obtained in our previous study Itoh-2 . Here, increases monotonically with . FIG. 6 (d) shows the melting points of the NaN cluster at , and , as observed by Haberland et al. Haberland-2005 , to discuss the relationship with cluster volumes. decreases monotonically with increasing . This dependence of is in contrast to the trend observed in the case of the cluster volume. Aguado et al. showed that the volume and of the most stable structures of the NaN cluster exhibited an opposite trend for from the molecular dynamics calculations based on DFT-LDA Aguado . This conclusion supports the existence of a relationship between the dependence of as evaluated by us and that of the observed by Habarland et al. Further, the more precise DFT-LDA molecular dynamics calculations predict that of Na40 is higher than that of Na55 Lee . of Na40 has not yet been observed experimentally. Our calculation results of do not contradict with the result of the DFT-LDA molecular dynamics study Lee with regard to the relationship between Na40, and Na55.
If the conclusion about the relation between the cluster or and in NaN holds for CuN and AgN for , it is expected that of Cu40 and Ag40 are lower than that of Cu55 and Ag55, respectively. For , the volume of the most stable cluster changes significantly with the structural type transitions (L P O C) described in section III. A. Therefore, for , the dependence of the cluster is expected to reflect this change.
IV dependence of the calculated cluster energy for and
IV.1 Overall aspects of the cluster binding energy
As described in section III. A., the most stable structures of the three metal clusters were searched over the range and the ground state cluster energies were evaluated. In general, it was observed that of the metal clusters increased with and approached , which corresponds to the value of the bulk cohesive energy. Interestingly, exhibited higher or lower values at a particular value of . To investigate the aspects of in datail, the dependence of the difference between and the liquid drop model (LDM) LDM average , defined as
| (3) |
is evaluated. Here, is expressed by a linear combination of three terms as shown below;
| (4) |
The first, second, and third terms denote the volume, surface, and curvature energy, respectively. The fitting parameters , , and ac were determined as described below. Here, the averaged cluster binding energy per atom , defined as
| (5) |
must be calculated to evaluate .
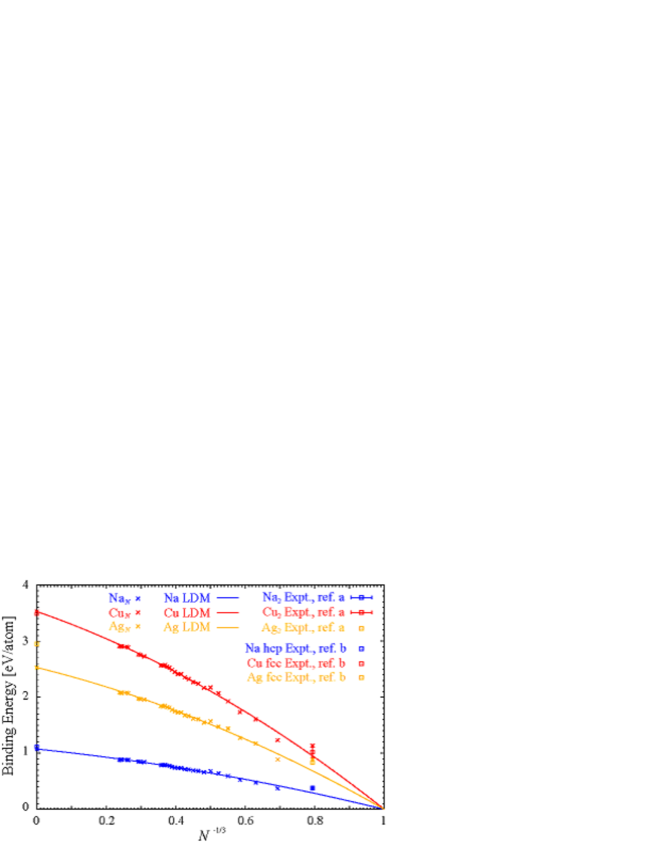
was uniquely determined from the cohesive energy of the bulk crystal that corresponds to at . and were determined as coefficients of the fitting curve to the cluster binding energy over the range of by applying the least squares method and minimizing those values under the threshold . FIG. 7 shows the cluster binding energy per atom and the LDM average as functions of . and the average of NaN, CuN, and AgN at and are presented. and correspond to , and , respectively.
We now consider the difference between and the LDM average . With an increasing in from to and then , a significant similarity is observed in the difference among the NaN, CuN, and AgN clusters in which each element has one s electron in the outermost shell. For the sake of comparison, the experimental bulk cohesive energy and binding energy of a dimer CRC ; Kittel ; expt are also shown in FIG. 7. The values of the bulk cohesive energy and binding energy obtained through our calculations and experiments are in good agreement. However, in an Ag bulk crystal, the calculated cohesive energy does not agree well with the experimental value. This disagreement may be attributable to the incompleteness of the description of the Ag () atom. As reported in previous studies Ag , the disagreement originates from the treatment method of the relativistic effect through the pseudopotential, the exchange-correlation energy functional - GGA, and the basis set for the electrons - plane waves. Although an improvement in the description is desired, we expect that the qualitative feature of the growth behavior of an Ag cluster from an atom to bulk shown in this study will not change.
IV.2 Detailed analysis of the dependence of cluster binding energy
In section IV. A., a strong similarity is pointed out for NaN, CuN, and AgN clusters in the dependence of the difference between the cluster binding energy per atom-- and the LDM average-. In this section, we analyze this similarity in detail. FIG. 7 shows that the difference for each of the three clusters approaches 0 with increasing .
However, it is difficult to compare them for large value of . Therefore, the dependence of the multiplied values are noted for the detailed analysis.
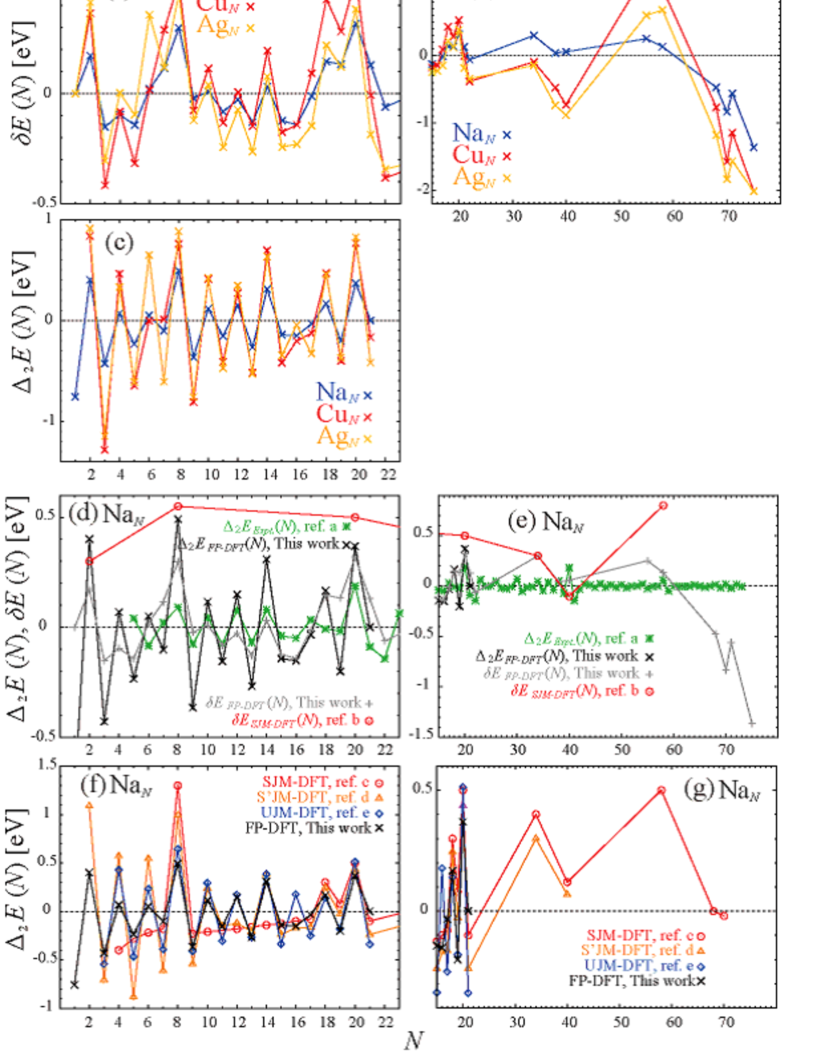
Figure 8 (a) and (b) show the dependence of for the three metal clusters over the ranges and , respectively. In FIG. 8 (a), a strong similarity is observed in the dependence of for . These values indicate an odd-even alternation in . In other words, increases from an odd to the next even , and then decreases from an even to the next odd . In many cases, is positive at even and negative at odd . In FIG. 8 (b), a significant similarity is observed in the dependence of for . is larger at (Na), , and and smaller at (Cu and Ag), , , , and are compared to those at the neighborhood considered in this study. The amplitudes of for CuN and AgN are much larger than that for NaN. Further, the values of CuN and AgN are closer. This is attributable to the effect of d electrons in noble metal clusters.
IV.3 Definition of the cluster magic number and identification
In many previous studies of clusters, an value that gives a special cluster stability has been frequently called as the magic number. To understand the -dependent system stability, it is necessary to evaluate the magic number based on first principles calculations, because it can be a standard magic number. However, the magic number has not yet been defined. Therefore, to understand the -dependent system stability, we must first define the magic numbers.
First, the curvature of the cluster energy for -, defined as
| (6) |
is discussed. If exhibits a positive peak at , may be a magic number because might be a local minimum for . FIG. 8 (c) shows the dependence of for the three metal clusters. Here, the magic numbers of the three clusters can be identified as (Na, Ag), and . For these values of , an odd-even alternation is clearly observed. All of these values of are even numbers and it is natural to consider that the odd-even alternation originates from the shell closing of each electronic state in the clusters. In addition, the dependences of the peak intensities are similar in the three clusters, although the absolute values of the peaks are larger in the noble metal clusters than in the alkali metal cluster for most values of . As in the case of described in IV. B., the values of are closer in the noble metal clusters.
Although it is possible to derive other conclusions from the absolute values of , only may not be a sufficient criterion for the evaluation of magic numbers. In general, additional information is required for the identification.
can be a criterion for identifying magic numbers because of its definition: the energy difference between a real cluster and the continuously averaged energy model, LDM. The magic numbers should satisfy the condition . This condition is satisfied for (Ag), (Cu), (Cu), , and (Na).
If only and are considered, magic numbers can be defined as
| (7) |
If this definition is employed for the magic numbers in NaN, CuN, and AgN clusters for , the common magic numbers (Ag), , and are identified.
In this study, for is not evaluated. For , magic numbers are identified only from . For these values of , we consider those that satisfy
| (8) |
to be magic numbers. Therefore, (Na), (Na), (Na), , and are identified as magic numbers. In this definition, the odd number is also considered to be a magic number.
In our first principles calculations, the common feature of the magic numbers in NaN, CuN, and AgN can be attributed to the delocalized s valence electrons. The localized d electrons in the noble metal clusters increase the stability difference between magic and not-magic clusters.
IV.4 -dependent stability of NaN clusters from the experiment and total energy calculations
The dependence of the peak intensity in the experimentally observed abundance spectra, and the cluster energy evaluated from the first principles calculations have not yet been compared quantitatively. This comparison is important for understanding the magic number observed in the experiment. On the basis of several assumptions, semi-quantitative comparison method Knight-deHeer ; deHeer-RMP has already been developed for an experimental result of NaN Knight and for the theoretical total energy calculations. Although experimental results for CuN and AgN Katakuse-1 ; Katakuse-2 are available, they cannot be easily compared with our calculation results quantitatively. Therefore, in this section, we only focus on the magic numbers of NaN.
With regard to experiments with NaN, only the result of Knight et al. Knight is discussed. As shown in other experiments with NaN such as those by Bjrnholm et al. Bjornholm , Rabinovitch et al. Rabinovitch , etc., main peaks were also observed at , and . Therefore, without significant improvements in the experimental method, these abundance spectra and magic numbers appear to remain unchanged. Obviously, if the experimental results remain unchanged, the theory itself must be reconsidered.
Here, the curvature of evaluated from our calculations and the peak intensity in the abundance spectra were semi-quantitatively compared based on the method described below. The abundance spectra of NaN clusters reported by Knight et al. are considered to be attributed as follows. First, Na atomic vapor is formed by heating Na bulk solid in an Ar-gas-filled closed space in the experimental apparatus Knight-Ar . Then, NaN clusters are formed by the adiabatic cooling of the mixture after passing through the skimmer in the apparatus. Then, -distributed neutral charged NaN clusters were assumed to be obtained in a thermal equilibrium condition. If the assumption for the NaN distribution is true, the relationship
| (9) |
must be satisfied. Here, the , , , and denote the number density of neutral charged NaN, a constant, Boltzmann constant, and the absolute temperature, respectively. These clusters were ionized by light and then accelerated by an electric field for mass selection. In these steps, the -distribution of is assumed to remain unchanged. Finally, these clusters were detected and the -distribution of the neutral charged clusters was observed using the detector. Therefore, finally,
| (10) |
holds. Here, is a constant. From equations (6), (9), and (10), the following equation is derived.
| (11) |
Namely, can be evaluated from of the experimental abundance spectra.
Figures 8 (d) and (e) show the dependence of evaluated experimentally by Knight et al.- and by the first principles calculations in this study- for and , respectively. For the latter discussion, evaluated from the first principles calculations in this study, , and from the DFT-based spherical jellium model (SJM) calculations by Genzken et al. Genzken , , are also shown in these figures.
We first compare the dependence of and . Generally, there is a good agreement between them. However, contrasting trends are observed in two rows of : (1) and and (2) and . The peak intensity of and is relatively strong at and . For , is not evaluated in this study.
As shown in Figures 8 (d) and (e), there is a similarity in the dependence between and . Considering this similarity, instead of , can be considered as a comparative value to .
In a manner similar to , exhibits good agreement with with regard to the dependence. However, in a manner similar to the case of , exhibits a different dependence as compared to in two rows of : (1) and and (2) and . Here, it should be noted that the order of peak intensity at and of exhibits better agreement with than with . Based on these results, is compared with for .
In , distinctive peaks are formed at and . Similar to the case of , is relatively large at . However, at is not particularly so distinctive. Although is remarkably distinctive at , the value of is similar to that of . Further, for and , exhibits distinctive peaks and these values are larger than and . In addition, for , and , has negative values, and these features are not exhibited by .
As shown here for NaN, although the dependence of exhibits good agreement with that of in the range of , the same is not necessarily true in the range of . This point is discussed in the next subsection.
IV.5 Improvement of the magic number description for NaN clusters from first principles calculations
We evaluate the source of this disagreement in the dependence of obtained from theoretical total energy calculations and obtained from the experiment. In this subsection, we review the -dependent system stability of NaN by the improvement of theoretical models.
As shown in Figures 8 (d) and (e), obtained by Genzken et al. Genzken exhibits an dependence similar to that of for . However, the dependence of exhibits a better agreement with that of for , and as compared to that of . This resut suggests that the consideration of the explicit ionic configuration in the total energy calculation is significant to realize a better agreement with the experiment with regard to the -dependent system stability of NaN.
Figures 8 (f) and (g) show the dependence of for NaN evaluated from various DFT-based models such as the spherical jellium model (SJM-DFT) by Chou et al. Chou , spheroidal jellium model (S’JM-DFT) by Ekardt et al. Ekardt-1988 , ultimate jellium model (UJM-DFT) by Koskinen et al. UJM , and the first principles model (FP-DFT) in this study for and , respectively. These values are denoted as , , , and , respectively. The various jellium models are differ from the first principles calculations in the treatment of the ionic configuration and the exchange-correlation energy.
As shown in Figures 8 (f) and (g), all of the calculation results exhibit distinctive peaks at , and . In these figures, remarkable differences are obtained in the number of peaks between of the spherical models, SJM-DFT, and non-spherical models, S’JM-DFT, UJM-DFT, and FP-DFT. From these figures, it is apparent that the improvement in the dependence in from the jellium models to the first principles model that explicitly treats the ionic configuration is smaller as compared to that from the spherical models to the non-spherical models.
In a manner similar to the case of and for , as shown in Figures 8 (e) and (g), the dependence of is similar to that of over the range of . Here, it is assumed that there is a similarity between the dependence of and that of for .
As shown in Figure 8 (e), () is positive. However, it is smaller than , , and (, , and ). On the other hand, as shown in FIG. 8(g), for is negative. Therefore, based on the definition of the magic number given in equation (7), is not a magic number in SJM-DFT. However, may be a magic number in S’JM-DFT and FP-DFT although has a small positive value. Although the magic feature at is expected to be weak in S’JM-DFT and FP-DFT, it is also expected that the consideration of the deviation from central force field in the total energy calculation is significant for obtaining a better agreement in -dependent system stability with the experiment.
Here, it should be noted that is nearly 0 eV. As shown in FIG. 8 (e), there is a large difference between 0 eV and eV. From the similarity between the dependence of and , is expected to differ significantly from as compared to . Therefore, it can be said that the dependences of and are not necessarily more similar to that of as compared to those of and .
We now consider the possibilities for reducing the difference between the theoretically and experimentally obtained -dependent system stability. First, we discuss the possibility of improving has the magic number description based on the evaluation of the ground state energy. In the case of NaN, it has already been shown that the dependence of the experimental abundance peak at , and cannot be expressed even in terms of of the configuration interaction calculations Koutecky-1 ; Koutecky-2 . Therefore, it is expected that the improvement of the ground state energy evaluation will never lead to and improvement in the agreement for small values of .
Thus for, several researchers have shown stable structures of Na40 Na40 ; Lee ; Ghazi . In previous studies, a nearly spherical structure with high symmetry has not yet been obtained as the most stable structure. Instead of such a structure, we have found a structure with low symmetry (III) that is 0.320 eV more stable than structure (II), which is similar to the most stable structure found thus far Lee . Since the energy differences between these structures are small, the most stable structure, III, did not exhibit a strong peak for in . Therefore, we expect that will not realize a strong magic feature even if a more stable structure is found in Na40.
Within SJM, the dependence of the energy per valence electron for NaN was evaluated from a more precise first principles calculation method called the diffusion Monte Carlo (DMC) calculation Tao . A weak magic feature was obtained for as a dip in the total energy vs. curve. From the result a weak magic feature is expected for in the dependences of and , in a manner similar to the cases of SJM-DFT and FP-DFT. However, by considering the explicit geometrical structure in DMC, the magic feature for will be strengthened as compared to that for and .
Second, we discuss the possibility of realizing improvements by a more proper evaluation of the system stability. In the experiments, the temperature in the apparatus is expected to be related to the final results. However, in the cluster study based on the total energy calculations, the temperature of the system is 0 K. If the consideration of the temperature is critical for the -dependent system stability, instead of the internal energy , the free energy must be considered. Further, the most stable and meta-stable structures of NaN must both be considered properly for the -dependent system stability. To consider the contribution of meta-stable structures, information about the potential energy surface or free energy landscape is required.
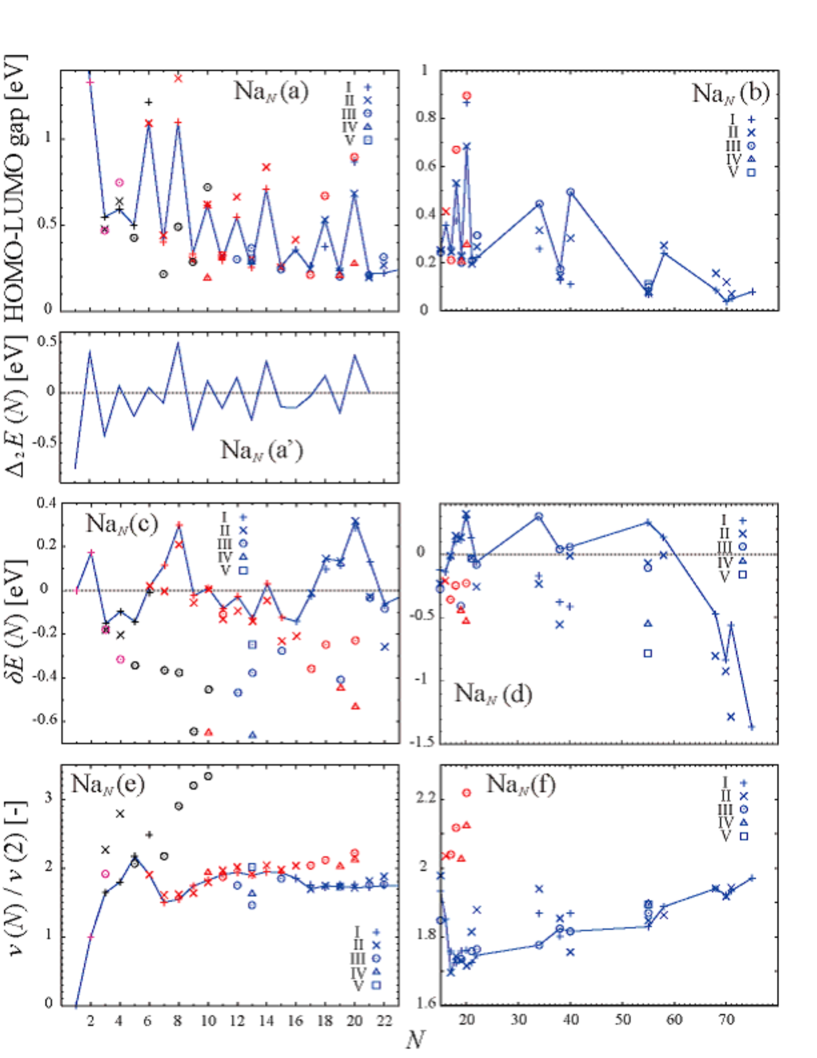
Finally, we discuss the possibility of realizing improvements from other viewpoints. In the case of NaN, various shell models such as the Woods-Saxon type Knight ; Nishioka and harmonic oscillator type Clemenger that neglect the Coulomb interactions between electrons exhibit a magic feature at in the dependence of the shell correction energy and the curvature for the sum of the electronic eigenvalues. These dependences are strongly affected by the dependence of the energy gap between the highest occupied molecular orbital (HOMO) and the lowest unoccupied molecular orbital (LUMO), i.e., the HOMO-LUMO gap. As shown in FIG. 9, within FP-DFT, the HOMO-LUMO gap for the most stable structure of Na40 is larger than that of Na34. The absolute value of the HOMO-LUMO gap may be larger if the quasi-particle energy evaluated from GWA is considered Yoshizaki . The improvement is significant if in the abundance spectra of NaN is a value that is more strongly related to the shell correction energy and the curvature of the sum of electronic eigenvalues as compared to or evaluated from .
As described in this section, by a more proper treatment of the system within the total energy calculations, discrepancies in the description of the -dependent system stability with the experimental results in the description of can be reduced. However, this is difficult even in the case of the simplest metal cluster NaN shown here. For discussing the -dependent cluster stability, various problems must first be solved. However, the magic number for the ground state, which avoids empirical parameter, is significant because it can be a standard to understand the -dependent system stability. Further, for practical reasons, the evaluation method based on first principles calculations is expected to retain the value in predictions of the experimental values of magic numbers.
V Electronic Structures
V.1 Evolution of the electronic structure from atom to bulk
As described before, remarkable similarities are observed in the dependence of the most and meta-stable structures and in the ground state energies of NaN, CuN, and AgN clusters. These similarities are attributed to the dependence of the electronic structure. In this section, -dependent electronic structures for the most stable structures of each metal cluster are discussed.
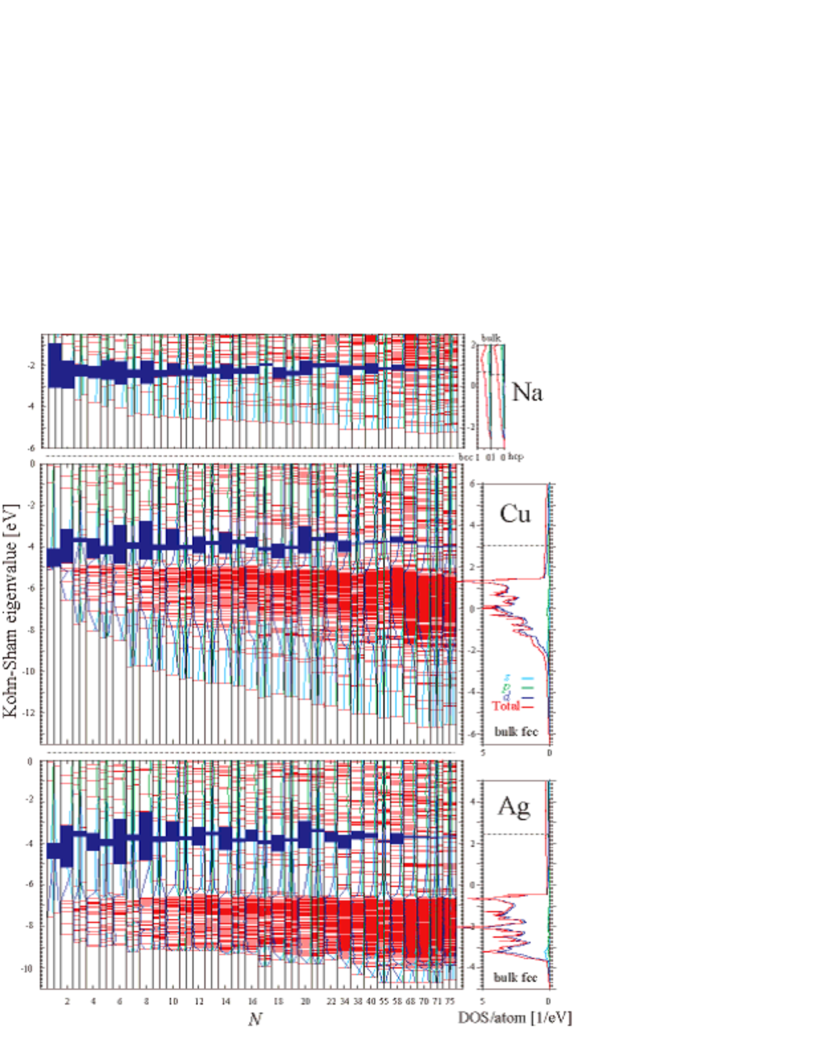
Figures 9 (a), (b), and (c) show the Kohn-Sham energy spectra for the most stable structures of the three metal clusters over the range of and (bulk). The density of states of the bulk crystal obtained from the band calculation is shown in the right-hand side space of each figure for the sake of comparison. Each Fermi level of the bulk crystal is set to the next HOMO-LUMO gap for the cluster. For all of the three figures, the space between HOMO and LUMO is colored blue. The red lines represent the occupied and unoccupied electronic energy levels.
For most values of , the HOMO-LUMO gaps are small at odd values of and large at even values of , which results in the odd-even alternation of the HOMO-LUMO gaps. However, the HOMO-LUMO gap is large for several odd values of and small for even values of . It should be noted that the odd-even alternation of the HOMO-LUMO gaps in CuN and AgN are significantly larger than that of NaN for the benefit of d electrons. Further, the similarity in the odd-even alternation is more distinctive between the noble metal clusters. Generally, the HOMO-LUMO gap of each metal cluster converges to the Fermi level of the bulk crystal with increasing .
For all of the metal clusters, with increasing , the feature of each bulk energy band gradually appears in the electronic states. The energy width between the bottom and top of the occupied energy levels almost converges to that of the bulk crystal at . In the case of NaN, over a wide energy range, the states are characterized by s and p. In CuN and AgN, in addition to the s, and p characterized states similar to those shown in NaN, energetically localized d band type states also appeared. It should be noted that the features of localized d band in the bulk crystals already appeared at a rather small value of in the width of the d states and the energetical distance from the top of the d states to the Fermi level. With increasing , the strongly d characterized states gradually expand and almost converge to the width of the d band in each bulk crystal at .
For the same type of geometrical structures as those described in section II. A., distinctive simiralities were also observed in the underwent splitting manner in which electronic states that are strongly characterized by s and p. As shown in FIG. 9, the energetical distances for the adjacent states strongly characterized by s and p are larger in NaN than those of CuN and AgN. This relationship can be roughly understood from the relationship between the energetical distance for the adjacent states and the width of a well in the quantum well model, as described in the previous paper Itoh-1 . In this case, the s and p characterized electrons correspond to the quantum in the well. As shown in FIGS. 4 (a), 5, and 6 (a) and (b), for the existence of spatially and enegetically localized d electrons, closer interatomic distances are obtained in noble metal clusters as compared to those in alkali metal clusters. Namely, the width of the well is narrower in the noble metal clusters. As a result, larger energetical distances are realized in the noble metal clusters.
The stability of the spin polarized state of the clusters is summarized as given below. For any odd clusters, the stability of the spin-polarized state is higher than that of the spin-unpolarized state. On the other hand, for most even clusters, the energy of the spin-unpolarized state is lower than that of the spin-polarized state. However, several structures that have high denegeracy in the neighborhood of the HOMO in the electronic state are exceptions. For a geometric structure with high symmetry, such as an icosahedron at and , cuboctahedron at , capped icosahedron at , and Marks decahedron at , the energy levels around HOMO are highly degenerated. Therefore, the high-spin states exhibit a higher stability than the low-spin states in systems such as an icosahedron for Na55 Itoh-2 and Cu55, although the case is opposite for Ag55. However, for all of them, the energy differences between the high- and low-spin states are very small-0.033, 0.022, and 0.012 eV, respectively. The system is stabilized by lowering the symmetry from to in the structures based on the Jahn-Teller theorem JT .
V.2 HOMO-LUMO gap, , and for the most and meta-stable clusters
In section V. A., only the electronic structure of the most stable cluster structure is discussed. In this section, the electronic structures of the most and meta-stable cluster structures are compared to understand the relationship between the geometric and electronic structures of the clusters. To save space, only the result of NaN is presented. FIG. 10 shows the HOMO-LUMO gap ((a) and (b)), (a’), ((c) and (d)), and ((e), and (f)) of the most and meta-stable structures of NaN clusters for and , respectively. The values of the most stable structures are connected by a line. Several important features are observed from the comparison of the most and meta-stable structures, as described below.
A close correlation is observed between the HOMO-LUMO gap and of the most stable structure. As shown in FIGS. 10 (a) and (a’), there is a strong correlation in the dependence between them for a range of . Although the HOMO-LUMO gap considered in this study is the Kohn-Sham HOMO-LUMO gap, originally, the HOMO-LUMO gap is a physical value that corresponds to the difference between the ionization potential and the electron affinity in the system. The ionization potential of a neutral charged cluster composed of atoms is defined as the energy difference between the total energy of the neutral cluster energy-- and the one electron detached charged cluster-. The electron affinity of a neutral charged cluster composed of atoms is defined as the energy difference between the total energy of the neutral cluster-- and the one electron attached charged cluster-. Therefore, the HOMO-LUMO gap of a cluster composed of atoms- is defined as . On the other hand, the energy curvature of a cluster composed of atoms-- is defined as . Although they are clearly different physical values, the forms of these two types of values are very similar. The close correlation described above should be studied in detail in the future.
Generally, as shown in Figures 10 (a) and (b), the most stable structures exhibit a relatively large HOMO-LUMO gap. Further, as shown in FIG. 9, a cluster that has a large HOMO-LUMO gap tends to have a lower HOMO and higher LUMO in the electronic structures, as described in section V. A. However, from a comparison with the energy differences between the most and meta-stable structures from shown in FIGS. 10 (c) and (d), it is apparent that a large HOMO-LUMO gap is not a necessary condition for the most stable structure. For example, in Na4, the meta-stable structure III exhibits a larger HOMO-LUMO gap than that of the most stable structure I. Although it is not shown in this paper, the same type of example can also be shown for CuN and AgN.
Finally, the dependence of the normalized cluster volume of the most and meta-stable structures, and the relation to the total energy and the HOMO-LUMO gap is noted. As shown in FIGS. 10 (e) and (f), it is apparent that the cluster volume is directly dependent on the structural type, namely, L, P, O, and C. From the system stability, as shown in FIGS. 10 (c) and (d), it is apparent that the most stable structures do not necessarily have a minimum value of . Further, the dependence of for does not change significantly if energetically closed structural isomers to the most stable structures are also considered. As shown in the figure, it is apparent that the relationship between the HOMO-LUMO gap and for the most and meta-stable structures cannot be simplified.
VI Conclusions
The -dependent geometric structure, system stability, and electronic structures of NaN, CuN, and AgN metal clusters are studied in detail for a range of based on the density functional theory. Strong similarities are observed between the three different metal clusters. These similarities originate from the outermost is s electron in the alkali and noble metal atoms composing the each cluster. Much stronger similarities are observed between the two noble metal clusters for the benefit of d electrons. The most stable structures are the same for the three different metal clusters for approximately half the cluster sizes considered in this study. Even if the most stable structures are different, the same type of structures are obtained if the meta-stable structures are also considered. For all of the three clusters, the structural type of the most stable structure changes in the order L P O C with increasing . This structural type transition leads to a deviation from the monotonic increase in volume with . A remarkable similarity is also observed for the dependence of cluster energy for the most stable geometric structures. This similarity is related to the similarity in the electronic structures. The amplitude of this energy difference is larger in the two noble metal clusters than in the alkali metal cluster. This is attributed to the contribution of the electrons to the bonds. The magic number is defined in the framework of total energy calclations for the first time. In the case of NaN, a semi-quantitative comparisson between the experimental abundance spectra Knight and the total energy calculations is carried out. For the improvement of the agreement with the experimental result, several possiblities arise for the total energy calculations. The changing aspects of the Kohn-Sham eigenvalues from to are presented for the three different metal clusters. The features of the bulk density of states already appeared at for all of the three clusters. With increasing values of , the HOMO-LUMO gap clearly exhibits an odd-even alternation and converges to 0. This alternation is a specific feature of alkali and noble metal clusters in which each element has one s electron in the outermost shell. It is also found that in some cases, the HOMO-LUMO gap is large at odd value of and small at even value of . Although there is similarity in the dependence of the HOMO-LUMO gap between the three metal clusters, it is much stronger between the two noble metal clsuters. The spatially localized d electrons in the noble metals are energetically localized. The growth aspect of the d band below the Fermi level of the noble metal clusters with increasing is presented. A good correspondence is obtained in the characteristic of the electronic states between the cluster composed of 75 atoms and the bulk metal.
Acknowledgements
The authors gratefully acknowledge the kind hospitality at the Institute for Materials Research
and the staff of the Center for Computational Materials Science for allowing the use of the Hitachi SR8000/64 supercomputing facilities.
The authors are grateful to Prof. Bernd von Issendorff for sharing his results prior to publication.
M. I. deeply acknowledges valuable information about group theory from Dr Kenta Hongo
and molecular dynamics simulation for clusters from Dr Tamio Ikeshoji.
M. I. deeply acknowledges valuable discussions with Dr Hiroshi Yasuhara.
M. I. deeply acknowledges Dr Koichi Yoshizaki for allowing us to refer to his thesis prior to publication.
Appendix
| Element | Type of data | d (Å) | (eV/atom) | (1011N/m2) | ||
| Dimer | Bulk | Dimer | Bulk | Bulk | ||
| Na | This study | 3.07 | 3.64 | 0.38 | 1.07 | 0.074 |
| Expt. | 3.079 CRC | 3.659 Kittel | 0.379 CRC | 1.113 Kittel | 0.068 Kittel | |
| Cu | This study | 2.22 | 2.57 | 1.14 | 3.53 | 1.396 |
| Expt. | 2.220 CRC | 2.55 Kittel | 0.915 CRC | 3.49 Kittel | 1.37 Kittel | |
| Ag | This study | 2.58 | 2.95 | 0.89 | 2.53 | 0.876 |
| Expt. | 2.531 expt | 2.89 Kittel | 0.831 CRC | 2.95 Kittel | 1.007 Kittel | |
References
- (1) P. Hohenberg and W. Kohn, Phys. Rev. 136, 864 B (1964).
- (2) W. Kohn and L. J. Sham, Phys. Rev. A. 140, 1133 (1965).
- (3) W. D. Knight, K. Clemenger, W. A. de Heer, W. A. Saunders, M. Y. Chou and M. L. Cohen, Phys. Rev. Lett. 52, 2141 (1984).
- (4) K. Clemenger, Phys. Rev. B. 32, 1359 (1985).
- (5) M. Y. Chou, A. Cleland and M. L. Cohen, Solid. State. Commun. 52, 694 (1984).
- (6) W. Ekardt, Phys. Rev. B. 29, 1558 (1984).
- (7) M. Koskinen, P. O. Lipas and M. Manninen, Z. Phys. D. 35, 285 (1995).
- (8) V. Kumar, K. Esfarjani and Y. Kawazoe, in Clusters and Nanomaterials, edited by Y. Kawazoe, T. Kondow and K. Ohno, Springer, 9 (2002).
- (9) M. Brack, J. Damgaard, A. S. Jensen, H. C. Pauli, V. M. Strutinsky and C. Y. Wong, Rev. Mod. Phys. 44, 320 (1972).
- (10) C. A. Utreras-Díaz and H. B. Shore, Phys. Rev. B. 40, 10345 (1989).
- (11) H. Nishioka, K. Hansen and B. R. Mottelson, Phys. Rev. B. 42, 9377 (1990).
- (12) S. Bjrnholm, J. Borggreen, O. Echt, K. Hansen, J. Pedersen and H. D. Rasmussen, Phys. Rev. Lett. 65, 1627 (1990).
- (13) O. Genzken and M. Brack, Phys. Rev. Lett. 67, 3286 (1991).
- (14) M. Brack, Rev. Mod. Phys. 65, 677 (1993).
- (15) W. A. de Heer, Rev. Mod. Phys. 65, 611 (1993).
- (16) W. A. de Heer, W. D. Knight, M. Y. Chou and M. L. Cohen, Solid State Physics, edited by H. Ehrenreich and D. Turnbull, 40, 93 (1987).
- (17) L. Kronig, I. Vasiliev, M. Jain and J. R. Chelikowsky, J. Chem. Phys. 115, 4322 (2001).
- (18) M. Itoh, V. Kumar and Y. Kawazoe, Int. J. Mod. Phys. B. 19, 2421 (2005).
- (19) References in Ref. Itoh-1 .
- (20) M. Yang, K. A. Jackson, C. Koehler, T. Frauenheim and J. Jellinek, J. Chem. Phys. 124, 024308 (2006).
- (21) M. Yang, K. A. Jackson, and J. Jellinek, J. Chem. Phys., 125, 144308 (2006).
- (22) J. P. Perdew, J. A. Chevary, S. H. Vosko, K. A. Jackson, M. R. Pederson, D. J. Singh and C. Fiolhais, Phys. Rev. B. 46, 6671 (1992).
- (23) D. Vanderbilt, Phys. Rev. B. 41, 7892 (1990).
- (24) P. Ewald, Ann. Phys. 64, 253 (1921).
- (25) P. Pulay, Chem. Phys. Lett. 73, 393 (1980).
- (26) D. M. Wood and A. Zunger, J. Phys. A. 18, 1343 (1985).
- (27) M. C. Payne, M. P. Teter, D. C. Allan, T. A. Arias, and J. D. Joannopoulos, Rev. Mod. Phys. 64, 1045 (1992).
- (28) Cambridge cluster data base, http://www-wales.ch.cam.ac.uk/CCD.html.
- (29) G. Wrigge, M. A. Hoffmann and B. v. Issendorff, Phys. Rev. A. 65, 063201 (2002).
- (30) O. Kostko, N. Morgner, M. A. Hoffmann and B. v. Issendorff (private communication).
- (31) H. Häkkinen, M. Moseler, O. Kostko, N. Morgner, M. A. Hoffmann and B. v. Issendorff, Phys. Rev. Lett. 93, 093401 (2004).
- (32) O. Kostko, N. Morgner, M. A. Hoffmann and B. v. Issendorff, Euro. Phys. J. D. 34, 133 (2005).
- (33) O. Kostko, B. Huber, M. Moseler and B. v. Issendorff, Phys. Rev. Lett. 98, 043401 (2007).
- (34) H. J. Monkhorst and J. D. Pack, Phys. Rev. B. 13, 5188 (1976).
- (35) G. Kresse and J. Furthmüller, Phys. Rev. B. 54, 11169 (1996).
- (36) M. Itoh, V. Kumar and Y. Kawazoe, Phys. Rev. B. 73, 035425 (2006).
- (37) V. Kumar and R. Car, Z. Phys. D. 19, 177 (1991).
- (38) H. A. Jahn and E. Teller, Proc. Roy. Soc. London. A. 161, 220 (1937).
- (39) H. Habarland, T. Hippler, J. Donges, O. Kostko, M. Schmidt and B. v. Issendorff, Phys. Rev. Lett. 94, 035701 (2005).
- (40) A. Aguado and J. M. Löpez, Phys. Rev. Lett. 94, 233401 (2005).
- (41) M-S. Lee, S. Chacko and D. G. Kanhere, J. Chem. Phys. 123, 164310 (2005).
- (42) Handbook of Chemistry and Physics, 85th edtion, 2004-2005, edited by D. R. Lide, CRC PRESS (2004).
- (43) N. Takeuchi, C. T. Chan and K. M. Ho, Phys. Rev. B. 40, 1565 (1989); P. H. T. Philipsen and E. J. Baerends, 61, 1773 (2000); T. Nautiyal, S. J. Youn and K. S. Kim, Phys. Rev. B. 68, 033407 (2003); B. Zhou and E. A. Carter, 122, 184108 (2005).
- (44) I. Katakuse, T. Ichihara, Y. Fujita, T. Matsuo, T. Sakurai and H. Matsuda, Int. J. Mass. Spectrom. Ion. Proc. 67, 229 (1985).
- (45) I. Katakuse, T. Ichihara, Y. Fujita, T. Matsuo, T. Sakurai and H. Matsuda, Int. J. Mass. Spectrom. Ion. Proc. 74, 33 (1986).
- (46) R. Rabinovitch, C. Xia and V. V. Kresin, Phys. Rev. A. 77, 063202 (2008).
- (47) From Figure 2 in reference Knight , we confirmed that is not changed significantly by changing the Ar gas pressure in the first step in the experiment.
- (48) W. Ekardt and Z. Penzar, Phys. Rev. B. 38, 4273 (1988).
- (49) V. Bonačic-Koutecký, P. Fantucci and J. Koutecký, Phys. Rev. B. 37, 4369 (1988).
- (50) V. Bonačic-Koutecký, I. Boustani, M. Guest and J. Koutecký, J. Chem. Phys. 89, 4861 (1988).
- (51) A. Rytkönen, H. Häkkinen and M. Manninen, Phys. Rev. Lett. 80, 3940 (1998).
- (52) S. M. Ghazi, M-S. Lee and D. G. Kanhere, J. Chem. Phys. 128, 104701 (2008).
- (53) J. Tao, J. P. Perdew, L. M. Almeida, C. Fiolhais and S. Kümmel, Phys. Rev. B. 77, 245107 (2008).
-
(54)
K. Yoshizaki, Master Course Thesis, Tohoku Univ., Japan (1996).
In this thesis, based on various approximations to the exchange-correlation functional within SJM-DFT (LDA and GWA (time dependent LDA (TDLDA) and random phase approximation (RPA)) are applied for the screened interaction), the HOMO-LUMO gaps of NaN clusters are evaluated in a range of . For and , the HOMO-LUMO gaps are evaluated as 0.45 (LDA), 1.45 (TDLDA), 1.50 (RPA) and 0.20 (LDA), 1.10 (TDLDA), 1.30 (RPA), respectively. If the ionic configurations are considered, the values are expected to be changed. - (55) C. Kittel, Introduction to Solid State Physics, (John Wiley & Sons, Inc., New York. 1996).
- (56) B. Simard, P. A. Hackett, A. M. James and P. R. R. Langridge-Smith, Chem. Phys. Lett. 186, 415 (1991).