A Spitzer Study of 21 and 30 Micron Emission in Several Galactic Carbon-rich Proto-Planetary Nebulae
Abstract
We have carried out mid-infrared spectroscopy of seven Galactic proto-planetary nebulae (PPNs) using the Spitzer Space Telescope. They were observed from 1036 m at relatively high spectral resolution, R600. The sample was chosen because they all gave some evidence in the visible of a carbon-rich chemistry. All seven of the sources show the broad, unidentified 21 m emission feature; three of them are new detections (IRAS 065300213, 07430+1115, and 19477+2401) and the others are observed at higher S/N than in previous spectra. These have the same shape and central wavelength (20.1 m) as found in the ISO spectra of the brighter PPNs. The 30 m feature was seen in all seven objects. However, it is not resolved into two separate features (26 and 33 m) as was claimed on the basis of ISO spectra, which presumably suffered from the noisy detector bands in this region. All showed the infrared aromatic bands (AIB) at 11.3, 12.4, and 13.3 m. Five of these also appear to have the C2H2 molecular band at 13.7 m, one in absorption and four in emission. This is extremely rare, with only one other evolved star, IRC10216, in which C2H2 emission has been observed. Four also possessed a broad, unidentified emission feature at 15.8 m that may possibly be related to the 21 m feature. Model fits were made to the spectral energy distributions for these PPNs to determine properties of the detached circumstellar envelopes. The 21 m feature has been seen in all Galactic carbon-rich PPNs observed, and thus its carrier appears to be a common component of the outflow around these objects.
1 INTRODUCTION
The study of infrared emission features in evolved stars provides an important avenue to study the chemistry of the circumstellar environment. First seen in the IRAS spectra of four sources (Kwok, Volk, & Hrivnak, 1989), a new, broad feature was discovered at 21 m (the so-called “21 m feature”). Subsequently, a small number of additional sources with this feature have been identified based on spectra from IRAS, ISO, and with the CGS on the United Kingdom Infrared Telescope. The total number of such sources is about a dozen (Kwok, Volk, & Hrivnak, 1999a). An ISO study of the strongest sources showed that they all had the same peak wavelength, 20.1 m, and nearly the same shape with no evidence of substructure (Volk, Kwok, & Hrivnak, 1999).
The 21 m sources all possess two characteristics in common. First, the 21 m sources are all carbon rich. This was first deduced based on the presence of molecular C2 and C3 in their visible spectra (Hrivnak & Kwok, 1991a; Hrivnak, 1995; Bakker et al., 1997) and later confirmed in detailed high-resolution abundance studies (Van Winckel & Reyniers, 2000; Reddy et al., 2002). The second common characteristic of the 21 m sources is that they are nearly all proto-planetary nebulae (PPNs), objects in transition between the asymptotic giant branch (AGB) and planetary nebula (PN) stages of the evolution of intermediate-mass stars. During this stage, the extensive AGB mass loss has ceased and the central star is surrounded by a detached, expanding envelope of molecular gas and dust. This stage can last several thousands of years (Blöcker, 1995b), during which the central star evolves from spectral type late-G to early-B, after which time it becomes hot enough to photoionize the gas and produce a PN. (The 21 m feature also appears to be present but weak in a few young PNs; Hony, Waters, & Tielens, 2001; Volk, 2003).
There has been an active search for the carrier of the 21 m feature and many candidates have been suggested, including PAHs, fullerenes, and nanodiamonds. Most but not all of the proposed carriers involve carbon. A good match to the feature is produced by TiC (von Helden et al., 2000), but this requires severe formation constraints due to the low abundance of Ti, even in stars like these that have enhanced s-process elements. SiC also provides a fit in this region and without the severe abundance constraints (see Speck & Hofmeister (2004) and references therein). However, most carriers suggested have associated emission features at other wavelengths that are absent or unconfirmed in these sources.
A very broad, so-called “30 m feature” has been know for several decades to exist in the spectra of evolved C-rich AGB stars and PNs (Forrest, Houck, & McCarthy, 1981). It has been attributed to MgS (Goebel & Moseley, 1985), which peaks in the range of 3035 m depending on the temperature of the grain. Subsequent studies have supported this identification (Szczerba et al., 1999; Hony, Waters, & Tielens, 2002). It has been seen with ISO in a number of objects ranging from AGB stars to PPNs to PNs (Hony, Waters, & Tielens, 2002; Volk et al., 2002) on a dust continuum that peaks at monotonically longer wavelengths in the transition between these stages. On the basis of recent ISO spectra, it has been claimed that the feature has been resolved into two features centered at 26 and 33 m in PPNs, PNs, and extreme-AGB stars (Hrivnak, Volk, & Kwok, 2000; Volk et al., 2002).
A family of emission features at 3.3, 6.2, 7.7, 11.3, 12.4, and 13.3 m (historically known as unidentified infrared [UIR] bands) is commonly observed in the diffuse ISM. Although the specific carriers are not identified, it is quite certain that these arise from the stretching and bending modes of carbonaceous materials with an aromatic component, such as polycyclic aromatic hydrocarbons (PAHs). We will refer to these as aromatic infrared bands (AIBs). Since these AIBs are also observed in carbon-rich PNs and PPNs, the carriers of these bands are likely to be synthesized in the circumstellar environment of late-type stars. These are often accompanied in PPNs by features at 3.4 and 6.9 m attributed to aliphatic groups attached to the aromatic hydrocarbons (Hrivnak, Geballe, & Kwok, 2007). The 11.3, 12.4, and 13.3 m features lie within the wavelength range of the Spitzer spectrographs.
In this study, we have obtained Spitzer spectra of seven PPNs to further study the 21 m, 30 m, and AIB features. These targets were selected with the goal of completing the mid-infrared study of carbon-rich PPNs. In addition to new targets that met this criterion (IRAS 065300213, 07430+1115, 19477+2401), we included some carbon-rich PPNs known or suspected to possess the 21 m feature based on low S/N ISO or ground-based spectra. Also included for comparison was one additional object that was well observed with ISO but faint enough for Spitzer observations.
2 OBSERVATION AND DATA REDUCTION
The target objects were observed with the Infrared Spectrograph (IRS; Houck et al., 2004) on the Spitzer Space Telescope (Spitzer; Werner et al., 2004). Most were observed as part of program No. 20208, PI: B. Hrivnak. The targets were all relatively bright for Sptizer and consequently were all observed in the high resolution modes, Short-High (SH) and Long-High (LH). These modes consisted of ten overlapping orders, and ranged in wavelength from 1019.6 m for SH to 1937 m for LH. The slit sizes for the two modes are 4.7 11.3 for SH and 11.1 22.3 for LH. Each observation consists of two nod positions, located at one-third and two-thirds of the way across the slit; at each nod position three scan cycles were carried out. The spectral resolution is R 600. No off-source background measurements were made for these bright targets. An observing log is given in Table 1.
Two of the targets were initially observed using inaccurate coordinates and were re-observed during Director’s Discretionary time. Three of the objects were not observed in this program in the SH mode because they were on the GTO program no. 93, PI: D. Cruikshank. Data for these were obtained from the Spitzer archive and have been incorporated into this study. Their observations were made in a similar manner to those described above. Details of these additional observations have also been included in Table 1.
Unfortunately, the coordinates of some of the targets were not know accurately and thus the stars were not always centered well on the slits. Accurate positions are important since the slits are relatively small compared to those used in previous mid-infrared spectral observations. In some cases, this meant that the spectrum at one or both of the two nod positions was weak or noisy or could not be extracted properly. Peak up was performed with nearby stars using the PCRS. To avoid such problems in follow-up studies, accurate positions are list in Table 2 for each of the targets as derived from accurate (1) 2MASS positions. For the fainter visible sources, source identifications are based on finding charts determined from our ground-based mid-infrared observations. Finding charts for IRAS 19477+2411111Based on comparison with the 2MASS catalog, it appears that the JHKL magnitudes that we published for IRAS 19477+2401 (Su et al., 2001) were for the nearby source located 8 west and 5 south, 2MASS 19495429+2408481. The 2MASS magnitudes for IRAS 19447+2401 are J=12.61, H=10.75, and K=9.61. and 22574+6609 are shown by Hrivnak et al. (1985) and Hrivnak & Kwok (1991b), respectively.
The data were initially processed using the data reduction pipeline at the Spitzer Science Center (SSC): version 13.2.0 for the earlier data and version 16.1.0 for the two that were re-observed. We then used the software program SMART (Higdon et al., 2004) to reduce the data. We started with the Basic Calibration Data (BCD) files. These were first cleaned for bad pixels using IRSclean. Bad pixels included the so-called rogue pixels, which are identified by observing campaign at the SSC, and other bad data which are flagged in the pipe-line. The spectra were then extracted and defringed. The resulting spectra were examined manually, by order, within each of the individual scan cycles. Bad data were removed from the edges of the orders. Data spikes not present in all the individual scan cycles or in both of the overlap regions in adjacent orders or in both of the nod positions were treated as artifacts, as were some additional large spikes, and these were removed. An average spectrum was composed in each nod position. In some cases we made small shifts in flux (210) to bring the overlapping orders into better agreement. The spectra from the two nod positions were then compared and an average spectrum formed if the two spectra agreed. In some cases, as mentioned above, the spectrum from one of the nod positions was near the edge of the slit and the data were of inferior quality; these spectra were not included. The spectral region 14.514.6 m had lots of spikes in the data and was not a region with overlapping orders; this resulted in particularly noisy spectra in this region. The LH spectra beyond 29 m were more noisy and those beyond 36 m were completely deleted.
The SH and LH spectra for each object were then combined, scaling where necessary based on a comparison of the region of spectral overlap from 19.0 to 19.6 m. In all cases the SH was fainter or similar to the LH; this may be due to the larger slit size of the LH mode, better accommodating small pointing errors. Therefore we scaled the SH when necessary to match the LH in the overlap region to produce a final Spitzer spectrum for reach object covering the region 10 to 36 m.
We note for comparison purposes that previous mid-infrared spectra have been obtained of some of the target objects. Initial observations were at low resolution from space with LRS (7.723 m, R25) on IRAS, or from the air using the Kuiper Airborne Observatory (KAO; 1648 m, R33), or from the ground using CGS3 (7.513 m, R50; 1624 m, R72) on the 3.8-m United Kingdom Infrared Telescope (UKIRT). Higher resolution observations were made more recently with SWS01 (R250) or SWS06 (R6002000) on ISO. Some of these will be referenced in our following discussion of the new higher-resolution, higher signal-to-noise ratio Spitzer spectra.
3 THE SPITZER IRS SPECTRA
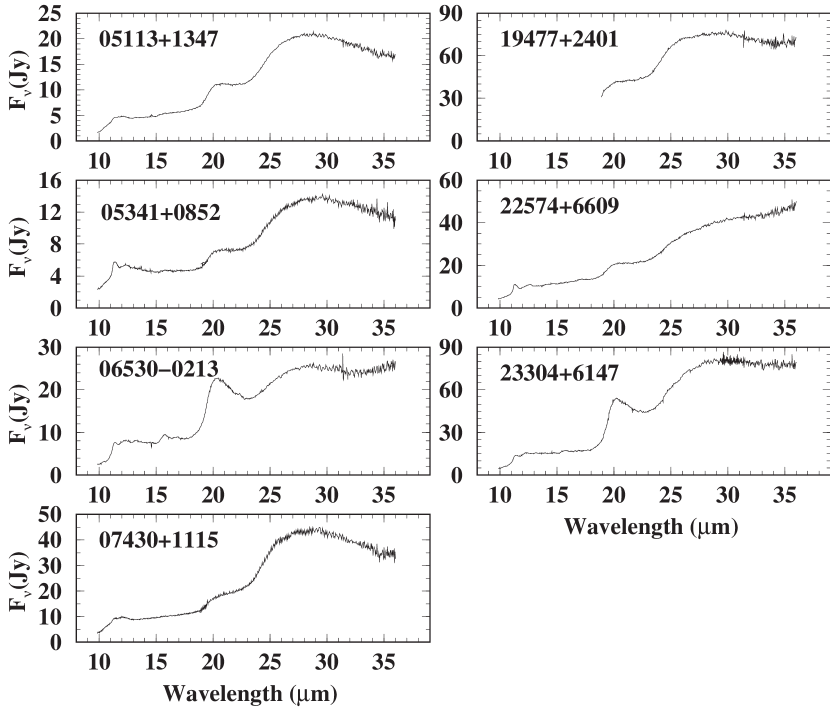
IRAS 23304+6147: The SH and LH spectra in the two nod positions were in good agreement and were averaged. In the LH, the longest wavelength order (LH11: 3436 m) was scaled upward by 5. The complete spectrum is shown in Figure 1. The spectrum shows strong broad 21 m and 30 m emission features. Also seen are medium-width emission features at 11.4, 12.3, 13.2 m, a medium-width feature at 15.9 m and a weak feature at 22.3 m. The short wavelength SH region is shown separately in Figure 2, where the features in that wavelength region can be seen more clearly.
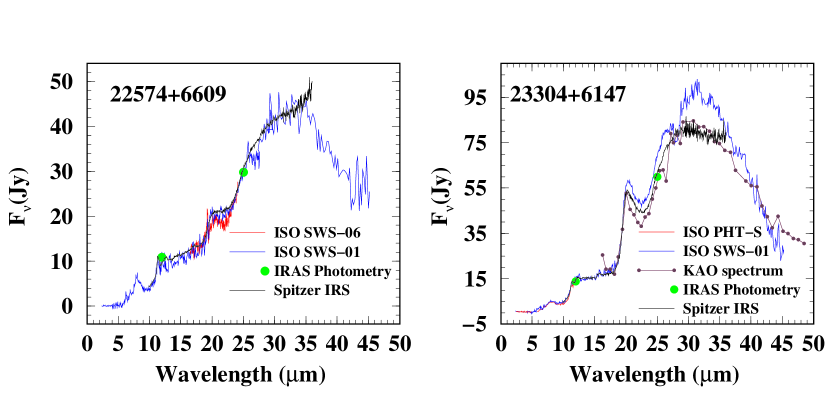
IRAS 23304+6147 is a well-documented 21 m source, being one of the original four IRAS sources in which this feature was detected (Kwok, Volk, & Hrivnak, 1989). The 30 m feature was discovered by Omont et al. (1995) using the KAO. Good observations were subsequently carried out with ISO (Volk, Kwok, & Hrivnak, 1999; Volk et al., 2002), and we observed it again partly for comparison purposes. Shown in Figure 3 are the ISO SWS01 (345 m) and PHOT-S (38 m) and the KAO (1648 m) spectra along with the Spitzer spectrum. It can be seen that the spectra are very similar in intensity from 1019.5 m and similar in shape from 1027.5 m. Beyond this, out to 36 m, the ISO spectrum is about 10 higher. The KAO spectrum is roughly similar in flux to the Spitzer spectrum beyond 27 m, but neither it nor the ISO spectrum shows the flattening seen in the Spitzer spectrum beyond 33 m. The new Spitzer spectrum is noticeably flat between 30 and 35 m.
The Spitzer spectrum was convolved with the IRAS bands to calculate synthetic IRAS photometry. This resulted in a 25 m flux of 59.9 Jy, in excellent agreement with the IRAS 25 m flux of 59.1 4 (53.7 Jy color-corrected). The color-corrected IRAS 12 and 25 m flux measurements have also been included for comparison in Figure 3.
IRAS 05113+1347: The spectra in each of the two nod positions in SH and LH agreed with each other and were averaged. To combine SH and LH smoothly required that we increase the SH spectra by 7. The spectrum shows a moderately strong 21 m feature and a strong 30 m feature. At the shorter wavelengths are seen emission features at 11.4 and 12.1 m and perhaps weak features at 13.3 and 15.8 m, along with a weak feature at 22.3 m.
The 21 m feature was first detected in this object in a low S/N CGS3 spectrum from UKIRT following the suggestion of it in the IRAS spectra (Kwok, Hrivnak, & Geballe, 1995), but the source was not observed with ISO. The Spitzer synthetic IRAS photometry resulted in a 25 m flux of 14.2 Jy, 7 lower than the IRAS 25 m flux of 15.3 6 (12.6 Jy color-corrected).
IRAS 05341+0852: The SH and LH spectra in the two nod positions agreed reasonably well with each other and were averaged. The flux levels in most of the SH orders were scaled by a few percent to agree with the adjacent orders, but the data for the first three orders (1012 m) agreed well without any shifts. The SH and LH spectra were then combined without any shift in flux. The spectrum shows a strong 11.3 m feature, a moderately strong 21 m feature, and a strong 30 m feature.
The 21 m feature in this source was also first detected in CGS3 spectra from UKIRT (Kwok, Hrivnak, & Geballe, 1995); the source was not observed with ISO. Present is a feature at 12.4 m, and a broad but weak feature at 15.8 m. Also seen is a very narrow emission feature at 13.7 m that agrees with the position of the C2H2 molecular band seen in absorption in carbon stars. The simulated IRAS photometry value was found to be 9.4 Jy at 25 m, compared to the observed IRAS value of 9.9 7 Jy (8.7 Jy color-corrected).
IRAS 065300213: The spectrum was good at only one nod position in each of SH and LH. The longest wavelength order in LH was scaled up by 8 to match the rest of the LH spectrum. The SH spectrum was scaled up by 24 to merge the two spectra; this is presumably to correct for flux missed due to poor centering of the SH spectrum. (Note that if poor centering is indeed the cause of the flux loss, the proper correction is wavelength dependent and not simply a constant scale factor. However, we do not have enough information to make such a correction; thus this likely results in an uncertainty of several percent in the shape of the SH spectrum.) The 21 m feature is strong; the 30 m feature is not as relatively strong as in IRAS 23304+6147 and it shows an unusual inflection around 33 m. Also seen are AIB emission features at 11.4 (strong), 12.3, and 13.2 m, a strong, medium-width feature at 15.8 m, and a weak feature at 22.3 m; the apparent feature at 14.6 m is likely an artifact. There appears to be a weak, very narrow emission feature at 13.7 m, the position of the molecular C2H2 band.
This object had no previous mid-infrared spectrum, so this is the discovery spectrum of the 21 and 30 m emission features in this object. The Spitzer flux is noticeably lower than the IRAS flux, with a synthetic 25 m flux of 21 Jy as compared with the IRAS flux of 27.4 4 Jy (25.7 Jy color-corrected). This large difference in flux is attributed to flux loss in the Spitzer spectrum due to the non-optimal centering of the object in the slit.
IRAS 07430+1115: In both the SH and LH spectra the two nod positions are in good agreement and were averaged. The SH and LH spectra were combined with no shift in flux, but the very shortest part of the LH spectra was removed due to lack of agreement with the SH in part of the region of overlap. Seen is a 21 m feature and a strong 30 m feature. The 11.3 m feature is seen a broad plateau extending out to 12 m. The Spitzer flux is close to the IRAS flux, with a synthetic 25 m flux of 27.9 Jy, close to the IRAS flux of 29.9 5 Jy (24.7 Jy color-corrected).
The earlier UKIRT CGS3 spectrum did not reveal the 21 m feature Hrivnak & Kwok (1999), but since the CGS3 spectrum only extended to 24 m and at lower S/N, it is not surprising that this weak feature was not detected. This target was not observed with ISO. Thus this is the discovery spectrum of both the 21 and 30 m features. Based on the earlier CGS3 spectrum, it had appeared that IRAS 07430+1115 was an exception to the rule that all C-rich PPNs are 21 m sources. This exception is now removed.
IRAS 19477+2401: Only one of the LH nod positions contained a good spectrum. Neither of the SH nods had a useable spectrum; it was on the edge of the slit and appeared very faint. These problems were traced to poor positioning of the object in our spectrum and mis-identification of the source in the SH archival observation. The originally published coordinates were not of sufficient accuracy, but a correct finding chart was shown (Hrivnak et al., 1985). In the one LH spectrum that we used, there was still a need to scale some of the individual orders by a few percent before combining them.
The resulting spectrum is shown in Figure 1. It shows 21 m feature and a strong 30 m feature. In addition, there is a weak feature emission at 22.3 m and possible weak emission features at 28.6, 29.8, 32.6, and perhaps even 34.9 m. At 31.4 m there is a narrow dip followed by a narrow peak; since it appeared in two separate orders, we did not remove it from the spectrum. However, it would be quite unusual to see a P Cygni profile at this spectral resolution. The 30 m feature shows a slight inflection in the spectrum around 33 m. The synthetic IRAS 25 m flux is 50.5 Jy, 8 less than the IRAS value of 54.9 4 (51.2 Jy color-corrected).
IRAS 19477+2401 was observed with CGS3 but the 21 m feature was not seen in the noisy 20 m spectrum (Kwok, Hrivnak, & Geballe, 1995), and the ISO spectrum shows flux problems also attributed to an inaccurate position (Hrivnak, Volk, & Kwok, 2000). This Spitzer spectrum is the discovery spectrum for the 21 m and the 30 m emission features in this source.
IRAS 22574+6609: In both SH and LH, the spectra in the two nod positions agree well and were averaged. In the LH, we shifted the longest order (LH11) up by 6 to match with the previous order, and the SH was scaled up by 2 to match with the LH. The spectrum shows a moderately strong emission features at 21 m and 30 m. A very strong emission feature is seen at 11.3 m, along with a medium-width feature peaking at 12.6 m and another one at 17 m (about 0.5 m wide). The is evidence of a weak absorption feature at 13.7 m that may be the molecular band due to C2H2.
The 21 m feature was first detected in this object in the IRAS LRS spectrum (Hrivnak & Kwok, 1991b), followed by observation of the 21 and 30 m and AIB features with ISO SWS01 (Hrivnak, Volk, & Kwok, 2000) and SWS06 spectra (Volk, Kwok, & Hrivnak, 1999; Volk et al., 2002). These previous spectra were rather noisy and the new Spitzer spectra show the 21 and 11.3 m features at much higher S/N. In Figure 3 are compared the Spitzer and ISO spectra. They have the same general shape out to 35 m, but the Spitzer spectrum is 20 higher shortward of 23 m. The spectral features differ in the region 12 to 14 m; the Spitzer spectrum shows a feature at 12.6 m while the noisier ISO spectrum shows features at 12.0 and 13.3 m. The Spitzer synthetic 25 m flux is again less than the IRAS flux, 27.3 Jy compared with 29.5 4 Jy (29.8 Jy color-corrected).
We note that in most of the sources (IRAS 065300213, 07430+1115, 19477+2401, 22574+6609, 23304+6147) the spectra are flat or even show an upturn in flux beyond 33 m. In the previous spectra of IRAS 23304+6147 and 22574+6609 this was not seen. As mentioned in the discussion of the individual sources, the longest wavelength order, LH11 (3436 m), was scaled upward by 58 of some cases to match the rest of the LH spectrum. Although the data are of high S/N, we maintain some skepticism about the accuracy of the shape of the spectra in the 3336 m region. Perhaps slit losses make some contribution the the suspected problem, since some of the sources are know to be extended in the N band.
4 DISCUSSION OF THE SPECTRAL FEATURES
4.1 21 m Emission Feature
Volk, Kwok, & Hrivnak (1999) used ISO spectra to examine the 21 m feature in eight PPNs, including IRAS 23304+6147 and 22574+6609. They found the feature to have a peak wavelength of 20.1 0.1 m with a rather similar shape in all eight sources. However, they found a large range in the relative strength of the feature (peak-to-continuum ratio).
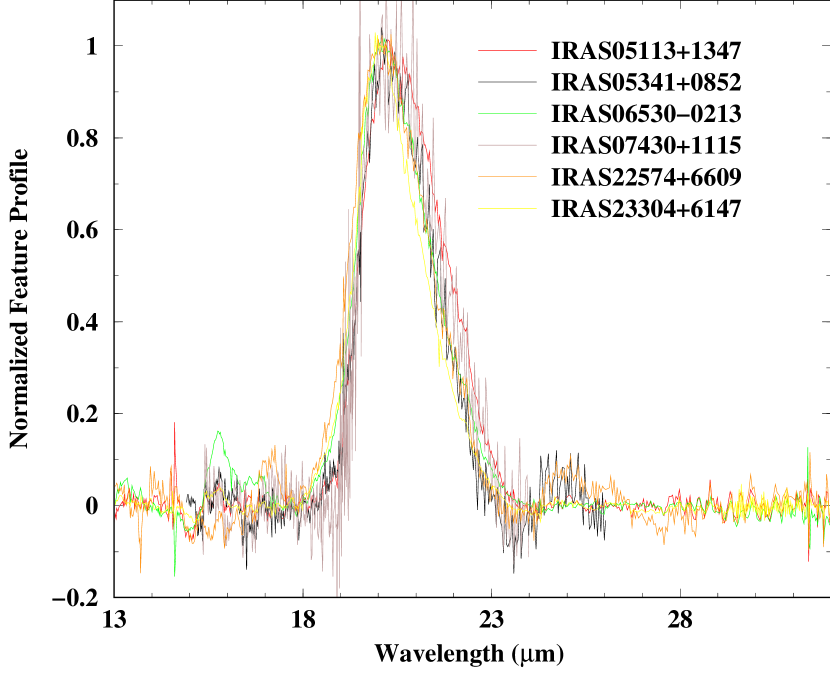
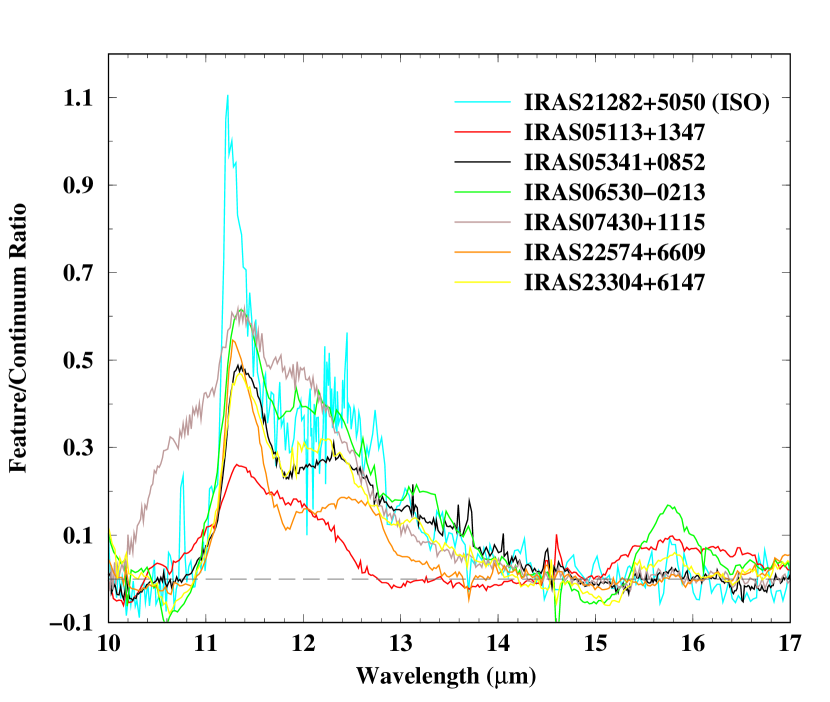
We can similarly compare the feature profile in these new, higher S/N Spitzer spectra. This was done for the six objects with spectra in both SH and LH modes (for continuum fitting). To determine the continuum, we used the flux at the shorter and longer wavelength sides and fit it with a spline function that gave a good smooth fit to this continuum; these ranged in order from 5 to 8. For three of the sources, IRAS 065300213, 22574+6609, and 23304+6147, we treated as the continuum the flux at 1318 m and at 2433 m (which also includes the part of the 30 m feature), while for the other three, for which there was a more steeply rising continuum on the long-wavelength side, we used a smaller range about the feature. This function was then divided into the spectrum to produce the feature profile. The relative strength of the feature varied quite a bit, from 0.21 to 1.46. An approximately similar range was determined in previous studies of the brighter objects (Volk, Kwok, & Hrivnak, 1999; Hrivnak, Volk, & Kwok, 2000; Volk et al., 2002); however these present spectra are superior due to their higher S/N. These peak-to-continuum ratios are listed in Table 3, along with the feature width and peak wavelength for each source. The feature profiles are similar; this is shown graphically in Figure 4, where the profiles have been normalized to 1.000 and the continuum removed. The long wavelength side of the feature differs slightly among the sources, especially for IRAS 05113+1347. However, this depends sensitively on the 30 m feature, and the assumption that there is a region of continuum between the two features and thus that the 30 m feature does not contribute flux between 21 and 24 m. The short wavelength side of the 21 m feature is less susceptible to contamination by strong features and appears to be relatively consistent among the sources. The peak wavelength of the feature is 20.10.1 m, the same as found for the sources in the earlier ISO study. The feature width we find is greater than in the earlier study, but this is likely due to the fact that we had more continuum to work with. IRAS 23304+6147 was included in both studies, and its 21 m feature is wider by 20 in the Spitzer spectrum.
In all of the 21 m sources studied in detail, this feature appears to have a relatively similar central wavelength and profile shape in each, but different strengths. Uncertainties arise in defining the feature since it sits upon a continuum and adjacent to a very broad 30 m feature, both of which are rising steeply toward longer wavelengths.
All carbon-rich PPNs that have been observed possess the 21 m emission features (Hrivnak et al., 2008). The sole exception to this statement may be IRAS 01005+7910 (OBe). The low S/N ISO spectrum of this source may or may not possess the 21 m feature; it does possess the 30 m and AIB features (Hrivnak, Volk, & Kwok, 2000). Since this is the hottest know carbon-rich PPN and since the feature appears to be absent or weak in PNs, it may be that IRAS 01005+7910 is displaying the expected weakening of this feature with evolution toward a hotter central star. The next hottest carbon-rich PPN star is IRAS 165944656 (B7e), and it clearly shows the feature (García-Lario et al., 1999).
The carrier of this feature is still not identified. There have been many suggestions, including PAHs, hydrogenated fullerenes, nanodiamonds, and more recently TiC nanoclusters (von Helden et al., 2000), doped SiC (Speck & Hofmeister, 2004; Jiang et al., 2005), and the interaction of Ti atoms with fullerenes (Kimura et al., 2005). (For a review of these and other potential carriers and additional references, see Posch et al., 2004). Some of these predict features at other wavelengths, but none of them have been confirmed. SiC does indeed produce an observed feature at 11.3 m, but it does not have the correct flux ratio with the 21 m feature (Jiang et al., 2005). We note below a possibly correlated feature at 15.8 m in our observed spectra.
4.2 30 m Emission Feature: Two Components?
We have previously used ISO spectra to study the 30 m feature in PPNs (Hrivnak, Volk, & Kwok, 2000; Volk et al., 2002). In these ISO spectra it appeared that this very broad feature was resolved into two separate features at 26 and 33 m, seen with varying strengths in PPNs. These new Spitzer spectra do not support this claim. This can be seen by the comparison of the Spitzer spectrum with the ISO spectrum for IRAS 23304+6147 as shown in Figure 3a. The apparent downward inflection in the ISO spectrum at 27.529.5 m is evidently due completely to the unreliable flux of ISO band 3E (27.529.5 m). Also, the data in ISO band 4 (29.545 m) are known to be very noisy due to the many cosmic ray hits and the flux calibration is less reliable. A similar effect is seen in the comparison of the Spitzer spectrum of IRAS 22574+6609 with its ISO spectrum as shown in Figure 3b. The downward inflection in the ISO spectrum between 26 and 33 m is not seen in the Spitzer spectrum of IRAS 22574+6609, nor is it seen in any of our other Spitzer spectra of sources with the 30 m feature. Low-resolution Spitzer spectra of evolved carbon stars in the LMC also do not show an indication of the 30 m feature being resolved (Buchanan et al., 2006), although this feature does appear to be significantly weaker in these LMC sources than in similar objects in the Milky Way Galaxy or in these PPNs. Hony, Waters, & Tielens (2002) used ISO spectra to study the 30 m feature in a large sample (63) of carbon-rich evolved stars AGB, post-AGB, and PN. They treated it as a single feature and found that a good fit to the 30 m profile could be obtained using MgS grains with a temperature differing from the continuum temperature. However, in 40% of these a residual excess existed at 26 m. Whether this excess is also an artifact due to the above problems in the ISO spectra might be further investigated using Spitzer spectra of these ISO targets. In a recent paper, Zhukovska & Gail (2008) present a strong case for the feature to be due to MgS as a coating on SiC grains. They go on to show how the feature shape and peak would change with the relative thickness of the coating, with the main peak at 2528 m and predicting a sub-peak at 3338 m when the coating is not too thick.
4.3 AIB Emission Features
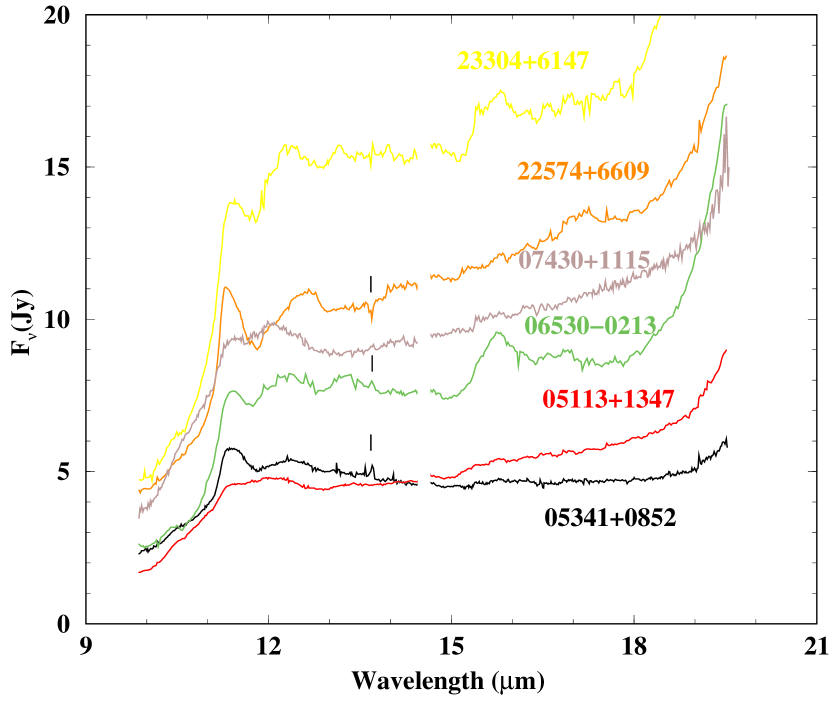
A strong 11.3 m feature, along with several corresponding features in the 1214 m region and an underlying plateau. The known features at 11.3, 12.1, 12.4, and 13.3 m are due to out-of-plane bending modes of aromatic compounds with peripheral H atoms attached to the aromatic rings. Although the carriers of these features are frequently attributed to PAH molecules, the strong associated underlying broad continuum suggests that the carrier of the continuum emission cannot arise from small, gas-phase molecules, and has to be emitted by solid-state grains or very large molecules with thousands of C atoms.
To investigate the shapes of these features, we show in Figure 5 the 1017 m spectral region with the continuum removed (by division of a fourth-order cubic spline fitted from 10.010.5 m to 1418 m). The strong 11.3 m feature has a relatively consistent peak wavelength of 11.33 0.03 m (ranges from 11.27 to 11.36 m in these six PPNs), Shown for comparison is the ISO spectrum of IRAS 21282+5050, a young PN with a [WC] central star. Its spectrum in this region has a general similarity to that of the PPNs. However, the 11.3 m feature is narrower and peaks at a shorter wavelength, 11.21 m. The peak of the 11.3 m feature at shorter wavelengths is what is also seen in most other sources. From a sample of 15 objects, consisting of HII regions, young stellar objects, and PNs, Hony et al. (2001) found that they all had a profile peak very near to 11.23 m. van Diedenhoven et al. (2004) defined a classification scheme for the 11.3 m feature that depended upon the shape and peak wavelength of the feature, but all three of their classes (A, AB, B) had peak wavelengths ranging from 11.20 to 11.25 m. However, Sloan et al. (2007) found in a sample of objects with cooler central stars that the central wavelengths are shifted to the red relative to the above peaks found for the class A and B sources. They include class C AIB features, based on the classification of Peeters et al. (2002), and these peak at wavelengths similar to what we find. Sloan et al. (2007) attribute the difference in the class C AIB spectra as due to the fact that “the carbonaceous material has not been subject to a strong ultraviolet radiation field, thus allowing the relatively fragile aliphatic materials to survive.” Our targets all have cool central stars and aliphatic features (see below), and thus are consistent with this suggestion.
Around 12 m, a broader emission feature is seen in all of these spectra, with a peak wavelength ranging from 12.0 to 12.6 m. In IRAS 065300213 and 23304+6147 and perhaps 05113+1347, a weaker emission feature is seen at 13.213.3 m. The features at 12.1, 12.4, and 13.3 m have been identified as the duo, trio, and quatro out-of-plane bending modes of CH bonds and are associated with the 11.3 m solo-CH feature (Hudgins & Allamandola, 1999). In previous studies of the infrared spectral characteristics of PPNs, we found that unlike PNs and HII regions, PPNs show aliphatic emission features at 3.4 m (Hrivnak, Geballe, & Kwok, 2007) and 6.9, in addition to the features at 12.1, 12.4 and 13.3 m which are uncommon in PNs or in other galactic nebulae. This spectral difference is suggested to be the result of chemical evolution, with a progressive formation of larger and larger clusters of aromatic rings and the removal of peripheral aliphatic groups (Kwok, Volk, & Hrivnak, 1999b). Absent in these PPNs is the relatively strong, asymmetric 12.7 m feature found in many objects with AIB features, including IRAS 21282+5050 (Hony et al., 2001; Sloan et al., 2005, 2007). In this sample, it is found only in IRAS 065300213.
The existence of broad plateau emission features at 8 and 12 m are also a common feature among the PPNs but not PNs and objects with hot central stars (Hony, Waters, & Tielens, 2001). This emission plateau is attributed to a collection of out-of-plane bending modes of a miscellaneous mixture of aliphatic side groups attached to the aromatic rings (Kwok, Volk, & Bernath, 2001). From Figure 5, we can see that the 12 m plateau feature is present among most of the PPNs observed here, with IRAS 05113+1347 perhaps being an exception. The width of this feature is estimated to be about 2 m. An exception here is IRAS 07430+1115, which appears to have a broader width extending to 10 m, although it is hard to set the continuum at the short end of this spectrum.
4.4 15.8 m Emission Feature
A relatively strong and medium-wide (1.3 m) feature is seen at 15.8 m in two of the sources, IRAS 23304+6147 and 065300213. The feature also appears to be present but weak in IRAS 05113+1347 and 05341+0852. Moutou et al. (1999) point out features at 15.8 and 16.4 m in their spectrum of NGC 7023, noting that their widths of 0.15 m are similar to that of the 11.3 m feature. In the more extensive discussion of sources with features between 15 and 20 m by Van Kerckhoven et al (2000), this feature can be seen in two or three sources but is not particularly distinct and is usually weaker than the apparently associated feature at 16.4 m, which is not present in our spectra. These and the complex of other features which are thought to make up a 1520 m emission plateau in carbon-rich sources are attributed to C-C-C bending modes in PAHs. Sellgren, Uchida, & Werner (2007) point out additional emission features in NGC 7023 at 17.4 and 17.8 m, along with a broad plateau feature at 17 m and a weaker features at 18.9 m. Our C-rich PPNs show 3.3, 6.2, 11.3 m features similar to those seen in NGC 7023 but none of these other, new features. The 15.8 m features seen in their spectra are not nearly as broad or strong as the 15.8 m features seen in several of our new PPN spectra, and thus they are not the same.
The width of this feature suggests that it is made up of a larger molecule than that producing the AIB features and perhaps is due to a solid-state feature. To quantify the properties of this feature, we determined it peak wavelength and the relative strength of the feature (peak-to-continuum ratio). For the weaker sources, we determined only an upper limit to the relative strength. The values are as follows: IRAS 065300213 (15.75 m, 0.22), 23304+6147 (15.79 m, 0.12), 05341+0852 (15.77 m, 0.06), 05115+1347 (…, 0.03), 22574+6609 (…, 0.03), and 07430+1115 (…, 0.02). In the source with the strongest feature, IRAS 065300213, it has a width of 1.3 m (15.1 to 16.4 m). The shape in IRAS 23304+6147 is consistent with this and the shape in the weaker sources is also consistent, but the feature in these is of much lower S/N.
As can be seen by comparison with Table 3, the two sources with the much stronger 15.8 m feature are also the sources in our study with the much stronger 21 m feature. This raises the possibility of a possible relationship between these two features. An examination of the lower S/N ISO spectra of other 21 m sources shows that the 15.8 m feature is likely present in IRAS 22272+5435, 195001709, 165944656, 23304+6147 (as confirmed in this Spitzer spectrum), and in the low S/N spectrum of IRAS 07134+1005, the source with the relatively brightest 21 m feature (Volk et al., 2002; Hrivnak, Volk, & Kwok, 2000). This possible relationship is based on only a few objects and so is only tentative, but it would certainly be worthwhile to investigate it for more of the 21 m sources. The presence of a feature correlated with the strength of the 21 m feature would provide an important clue to help identify the carrier and could at minimum help to constrain the viable suggestions.
4.5 13.7 m C2H2 Feature
We have previously mentioned a narrow (unresolved) feature at 13.7 m in three of these PPNs, in absorption in one (IRAS 22574+6609) and in emission in two (IRAS 05341+0852 and 065300213). This is at the wavelength of the molecular C2H2 (acetylene) 5 bandhead feature commonly seen in absorption in carbon stars (Willems, 1988; Cernicharo et al., 1999; Volk, Xiong, & Kwok, 2000). This feature may also be present in IRAS 23304+6147 in both absorption and emission (P Cygni profile; see Figure 5) and in IRAS 07430+1115 in emission. This C2H2 feature has previously been reported in absorption in only three galactic PPN, AFGL 618 (Cernicharo et al., 2001), AFGL 2688, and IRAS 134166243 (Kraemer et al., 2006); it has recently been also seen in absorption in the LMC PPN/PN object SMP LMC 11 (Bernard-Salas et al., 2006) and the SMC PPN object MSX SMC 029 (Kraemer et al., 2006). Kraemer et al. (2006) and Sloan et al. (2007) point out that when the C2H2 absorption feature appears in sources with PAH emission, the sources are those classified as the rare class C PAH sources (Peeters et al., 2002). Our sources with C2H2 would all be classified as class C PAH sources based on their broad 8 m features and secondarily based on the longer wavelength of their 11.3 m feature, and thus this claimed correlation is supported by our new observations.
To our knowledge, C2H2 has previously been seen in emission in only one evolved stellar object, the AGB star IRC+10216 (Keady & Ridgway, 1993). Thus this is the first report of the molecule in emission in a post-AGB object. One might consider the emission to be due to collisional excitation. However, collisionally-excited H2 emission is not seen in any of these three PPNs at 2.12 m (10 S(1)) (Kelly & Hrivnak, 2005), nor is H2 emission seen in any objects in this study at 12.27 m (00 S(2)) or 17.03 m (00 S(1)). (Only for IRAS 22574+6609, with a 13.7 m absorption feature, is a (weak) 2.12 m H2 emission feature seen.) We have recently confirmed the presence of C2H2 5 lines having P-Cygni profiles in three of these objects using high resolution spectroscopy, as will be discussed in more detail elsewhere. This feature has the potential to serve as a diagnostic of the physical conditions in the circumstellar envelope.
4.6 Summary of Spectral Features
We summarize the presence of these spectral features in our targets in Table 4. Also included are the carbon-to-oxygen (C/O) abundance ratio and observations of AIB features at shorter wavelengths as found in other studies. It can be seen that all of the sources in this sample with the 21 m feature are carbon-rich, possess the 30 m emission feature, and also possess AIB emission features in the 314 m range (except IRAS 19477+2401, which has not been observed in high S/N spectra in this range). These spectral features appear to accompany the presence of the 21 m feature. All of the sources in this study that have visible spectral types also possess C2 and in most cases C3 in absorption. In addition to the in-some-cases-strong emission feature at 15.8 m, there is an unidentified weak feature seen at 22.3 m in four of these sources.
5 MODELING OF THE SEDS
To learn more about the physical conditions under which these features arise (T, ), and also to determine the mass loss rates () and expansion time scales (tdyn), we carried out modeling of the circumstellar envelopes. Model fits to the spectral energy distributions (SEDs) were carried out for the six sources with complete 1036 m spectra. The continuum was assumed to be due to amorphous carbon (AC) grains, with optical constants by Rouleau & Martin (1991, type AC2) and an assumed size of 0.1 m. The radiation transfer code by Leung (1976), DUSTCD, was used to produce one-dimensional models. The dust envelope is assumed to have an inner radius rin, a dust density profile of 1/rα, and to extend to 0.75 pc (somewhat arbitrarily set at the distance reached in 5 x 10⁴ yrs with an expansion rate of 15 km s-1). The temperature of the central star (T∗) was initially set at the value derived in published atmospheric model analyses and then adjusted slightly (250 K) to fit the SED at shorter wavelengths. A Kurucz model atmosphere (Kurucz, 1993) with log g = 1.0 was used for the central star, and this was the assumed energy source for the nebula. The interstellar extinction AV was treated as an adjustable parameter. The other parameters that were initially adjusted were the temperature (Td) and inner radius of the cool dust shell, the optical depth (o), and the exponent of the density law (). These were adjusted by trial-and-error fits of the calculated to the observed SEDs until a “best fit” was determined. We began by fitting the mid-infrared continuum at 18 m and 100 and/or 60 m; we set Td to the highest value that did not go above the continuum and adjusted rin and . We then adjusted the optical depth in the near-infrared, along with AV and T∗, to fit the near-infrared and also the visible as well as possible. These parameters are not strongly coupled, with each primarily effecting a distinct aspect of the SED. More details of the basic model are given by Hrivnak, Volk, & Kwok (2000).
After initial attempts with this basic model to fit the SEDs of these PPNs, the model was adjusted in two ways. First, in some cases it was found that a single dust shell with the high density needed to fit the mid-infrared SED and a large radial extent produced flux that was too high to fit the long wavelength 60 and 100 m IRAS fluxes, even if we assumed a very steep density law (4). Thus we added to the model a discreet thin, dense, cool (c) dust shell of inner and outer radius rin(c) and rout(c), respectively. Second, it was found that for most of the sources, the model produced flux that was too low to fit the observations in the M and L bands. To improve this fit, a component of hot dust was added where needed. This hot (h) component was of low density and mass, and served to bring the model into better agreement with the observed flux in the 35 m region. The hot dust component begins close to the star, with a small value for rin(h). The values for Td(h) and rin(h) were adjusted to fit the M and L observations. The density laws for both the cool and hot components are assumed to have the same exponent. The resulting density ratio of the cool to the hot component ((c)/(h)) ranges among the models from 7700 to 15,000 at a radius of rin(c), and the hot dust contributes only 1.511 of the optical depth at 11.2 m.
The AIB plateau features were not included in the modeling. They are likely produced by some combination of flourescence and non-equilibrium heating, which the dust radiative transfer code does not have the capability to include. However, they do not carry a large part of the total energy emitted in the mid-infrared and presumably therefore would not have much of an effect on the optical depth in the dust shell or the derived parameters. IRAS 22574+6609 is a possible exception to this generalization since it has an unusually high optical depth dust shell.
Empirical fits to the 21 and 30 m features were added to the continuum. The 21 m feature template is the same one we used previously to fit ISO spectra, derived from the ISO high-resolution SWS06 spectra of carbon-rich PPNs. The 30 m feature template is derived from the fitting of the IRS spectrum for IRAS 05113+1347, since this source has a strong and relatively well-defined 30 m feature. The long wavelength end of the feature was defined by a linear extrapolation of the observed feature shape from 32 to 36 m, which goes to zero at 43 m; that is reasonably consistent with the ISO long wavelength limit of the feature in PPN (Volk et al., 2002; Hony, Waters, & Tielens, 2002). (The extent to which this template fits or does not fit for the other objects is either telling us something about problems in the IRS data at long wavelengths or is indicating that there are variations in the feature shape.) We did not attempt to empirically fit the AIB plateau features.
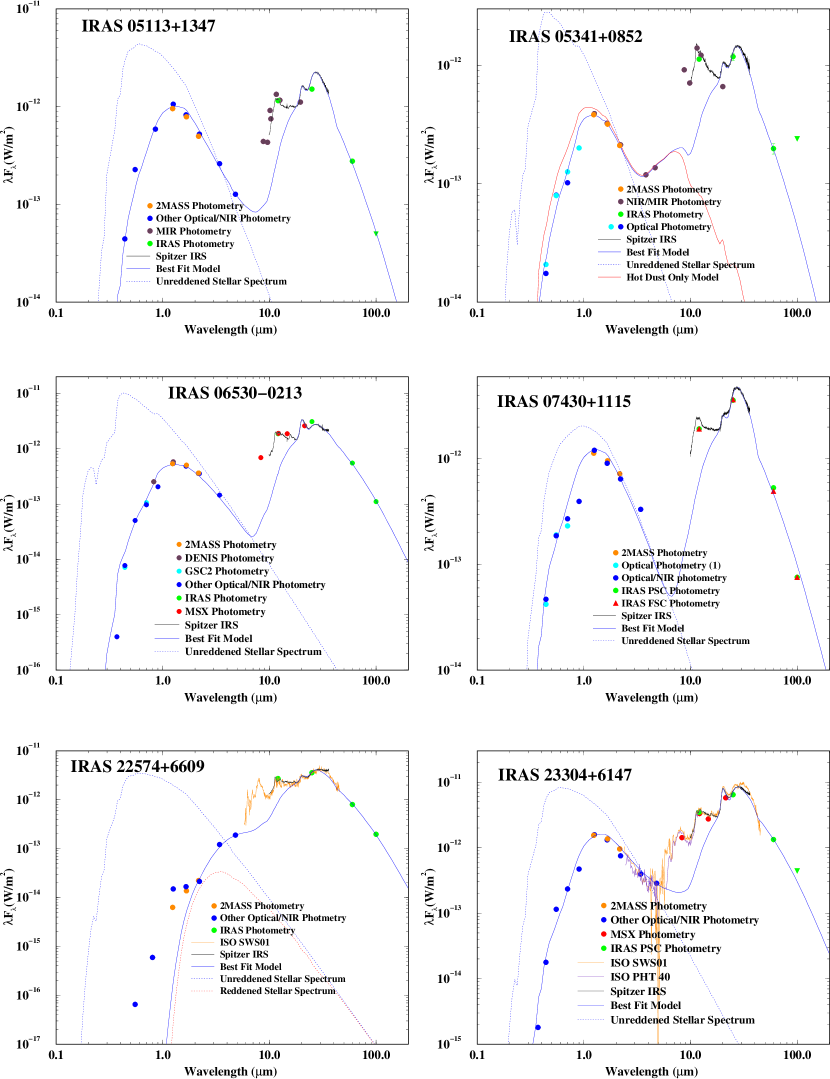
These model results are listed in Table 5 and the fits are shown in Figure 6. In calculating the mass loss rate, a gas-to-dust density ratio of 330 was assumed. Note that while the total mass of the enhanced shell is well determined, the mass loss rate is less so, since a similar model fit could probably be obtained using a narrower or wider shell of the same mass. Below we discuss briefly the model for each object separately.
IRAS 05113+1347. The fit to the SED of this object required a discrete cool shell. Initial attempts to fit it with an extended dust shell required a very high density exponent of = 5, and even then the fit was not as good as with a discrete shell. The hot dust component is needed to fit the M-band flux. This hot component is of low mass, and contributes only 3 of the optical depth at 11.2 m. The model provides a good fit to the SED, except for the emission plateau from 8 to 14 m and the 15.8 m emission feature which were not included in the modelling. The visible image shows only the star, suggests that we may be looking pole-on to the nebula (Ueta et al., 2000).
IRAS 05341+0852. The SED of this object was fitted by an extended, detached cool dust shell with a high density exponent of = 3.5. To fit the L and M flux, a hot dust component is also needed. This hot component contributes 11 of the optical depth at 11.2 m but less than 0.03 of the total mass in the envelope. The model fit to the SED is good, except for the emission plateau from 8 to 14 m and some excess emission observed from 30 to 36 m. The hot dust component leads to a particularly good fit to the L and M flux. The visible image (Ueta et al., 2000) shows an elongated elliptical nebula around the central star and suggests that one is looking at a bipolar nebula at some intermediate orientation.
IRAS 065300213. The SED of this object can be fitted by a normal, detached and extended cool dust shell with no extra hot dust component. The emission plateau from 8 to 14 m and the strong 15.8 m emission feature were not fitted. The visible image (Ueta et al., 2000) suggests that one is looking at a bipolar nebula at some intermediate orientation.
IRAS 07430+1115. The modeling of the SED of this object was more difficult than most. An adjustment of the density exponent to its best value resulted in = 1, implying a decreasing mass loss rate. This is both unlikely and contrary to the results for the others, so we chose to fix = 2, implying a constant mass loss rate. The resulting model fit was only slightly inferior to that with = 1. The SED was fitted with a low density envelope and a high density cool shell region. The observational excess in the L band suggests the presence of a hot component for this object also, but without an M-band observation, it is too unconstrained to model. The model fit is not as good as most of the other sources. The visible and near-infrared photometry cannot be fit by a normal model atmosphere with reddening; the resulting compromise fit includes more uncertainty in AV than in most of the models. The model fit falls below the observations at 60 m, is not good on the long wavelength side of the 21 m features, and falls below the L-band flux, as mentioned above. Again, some excess emission is observed from 30 to 36 m and the emission plateau from 8 to 14 m is not included in the model fit. The visible image (Ueta et al., 2000) shows an approximately circular nebula around the central star.
IRAS 22574+6609. This source is very faint in the visible (V=21.3) and it lacks a visible spectrum, so we assumed a typical PPN stellar temperature of 5500 K. The model requires a much higher optical depth () for this object than the others, by a factor of 10100. The fit of the model to the SED of this object is good from 18 to 28 m and then from 60 to 100 m. The emission plateau rises above the continuum from 8 to 18 m. Beyond 28 m, the IRS spectrum continues to rise. An attempt to fit the IRS spectrum to 34 m leads to a very poor fit to the 60 and 100 m data. Without spectra extending to 45 m, it is hard to know exactly where the continuum lies. To fit the K, L, and M band data, a hot component was added to the model, which contributes less than 2 of the optical depth at 11.2 m. While this brings these data into agreement, we are still left with poor agreement at the shorter wavelengths, with extra flux observed below 2.2 m and through the visible.222The near-infrared measurements of IRAS 22574+6609 by Hrivnak & Kwok (1991b) made with a 15 aperture likely include the nearby (5 south) source 2MASS 22591874+6625430, which is brighter in J but fainter in H and K. Such behavior in dust shell models has been seen previously in one-dimensional models of extreme carbon stars including IRC+10216 and AFGL 3068, and it is attributed to a non-spherical dust shell geometry. This may also be the cause in IRAS 22574+6609. The visible images show a faint, edge-on bipolar nebula with a dark dust lane (Ueta et al., 2000; Su et al., 2001). We suggest that the extra short wavelength emission is due a low optical depth path (hole) out of the dust shell through which some scattered light is escaping, similar to the situation in IRC+10216 (Men’shchikov, Hofmann, & Weigelt, 2002). This may be consistent with the off-center intensity peak seen by Sánchez Contreras et al. (2006) in their high resolution near-IR images of IRAS 22574+6609. They show that this peak is not at the center of the nebula and thus is not the central star seen directly. We have not tried to add extra complexity to the model simply to fit the visible wavelength portion of the SED. These new model parameters are significantly different from our previous model for this source. However, those were based on much poorer quality ISO spectra, in which we chose to disregard the observed ISO spectrum from 27 to 45 m (Hrivnak, Volk, & Kwok, 2000). The new model was best fit with AV = 0.0; however, galactic extinction studies by Neckel & Klare (1980) suggest a value 2.5, so we fixed AV = 3.0. The fit was slightly worse, but at a level that is negligible on Figure 6.
IRAS 23304+6147. The model gives a good fit to the SED apart from the emission plateau shortward of 18 m. A hot dust component is required to fit the M-band excess. This hot dust contributes less than 2 of the optical depth at 11.2 m. The visible image (Sahai et al., 2007) is similar to that of IRAS 065300213, and also suggests a bipolar nebula at some intermediate orientation. This new model for IRAS 23304+6147 differs slightly from the one that we previously published based in ISO spectra (Volk et al., 2002), due primarily to the adoption of a stellar model rather than a black body for the central star.
Thus it can be seen that the model fits are generally good (excluding the unmodelled AIB emission plateau from 8 to 14 m), except for IRAS 22574+6609 and perhaps IRAS 07430+1115. Observations in the 510 m range are needed to better constrain the continuum on the short wavelength side of the AIB emission plateau. Although most of these PPNs are known to have a bipolar morphology, the assumption of spherical symmetry will have little effect on the fitting of the mid-infrared emission and the calculated mass-loss rate. This is the case because the dust shells are optically thin in the infrared where the dust is detected. The only exception to this might be IRAS 22574+6609, where the derived optical depth is much higher than for the other objects. In this case, the morphology might affect the mid-infrared emission and the resulting observed flux would then depend upon observing orientation.
The cool dust temperatures are similar in these models, with values in the range 120150 K at the inner radius of the cool dust shell. Including an additional six 21 m sources modelled earlier based on ISO spectra, the full range of Td(c) is 140 to 210 K (disregarding the earlier model of IRAS 22574+6609; Hrivnak, Volk, & Kwok, 2000). The absence of C-rich PPNs with higher values of Td(c) arises partly from the absence of cooler, spectral type K central stars with smaller detached dust shells, even though there is no bias in detecting these (Volk & Kwok, 1989). The absence of lower values of Td(c) at the inner radius of the 21 m sources suggests that either the carrier is not excited at these lower dust temperatures or that it is destroyed due to the presence of the harder UV radiation field found when the central star has evolved to high temperatures. The value of Td(c) observed in a particular source depends sensitively on the rate of evolution of the central star as well as the expansion velocity of the detached shell. The temperatures for the hot dust are in the range 500800 K. For IRAS 05113+1347, 05341+0852, and 23304+6147, the density of the cool dust is 10,00015,000 times that of the hot dust, but for IRAS 22574+6609, the ratio is only 200, due to the relatively larger amount of hot dust.
Many of the values in Table 5 are scaled to the distance (D), and the mass loss rate () is also scaled to the expansion velocity (V). Assuming a luminosity of 8300 L☉, appropriate for a core mass of 0.63 M☉ (Blöcker, 1995a) and published expansion velocities, the distances and mass loss rates for each object were calculated. These are listed in Table 6. The mass loss rates range from a 10-4 M to as high as a 6 10-3 M. These later values are very high and cannot be sustained very long in medium and low mass stars. The total mass of the cool dust shells (M) range from 0.22 to 0.95 M⊙. The total mass of the enhanced shell is a more robust value than the mass loss rate since the width of the shell is not tightly constrained. The duration of the intense mass loss was calculated based on the shell radii and the expansion velocity, and ranges from 160 to 820 years; again, these values, based on the width of the shell, are not tightly constrained. Thus the results of the model fits to the SEDs imply that these post-AGB objects lose most of their ejected mass in a short duration of time, 102103 years.
A kinematical age since the end of the end of the high mass-loss phase was calculated based on the inner radius of the cool dust shell and the expansion velocity; this ranges from 1000 to 3000 yr for five of the objects but is only 300 yr for IRAS 22574+6609. These values are consistent with the evolutionary ages for post-AGB stars Blöcker (1995b). The results suggest that IRAS 22574+6609 may be more massive than the other sources, based on its larger value of the ejected mass, the larger expansion velocity, and the apparently shorter time scale of evolution. The kinematical ages also provide a time scale for the formation of the carrier of the 21 m feature.
These new results for the mass loss rate and mass of the ejected shell can be compared with other published values determined in other ways. Here we have confined ourselves to two different approaches that also involve either discrete denser inner shells or steep density laws.
Ueta and Meixner have recently modeled the mid-infrared emission from the dusty envelopes of two carbon-rich PPNs based on high-resolution images. They used a model that had an extended AGB envelope combined with an equatorially-enhanced discrete shell ejected during a later superwind phase. Both of these are sources with 21 m emission, although they are among the brighter ones and were not included in our present study. For IRAS 22272+5435, the values determined were = 4 10-6 M and t = 1500 years (Ueta et al., 2001). For IRAS 07134+1005 (HD 56126), for which their model was based on CO interferometric observations in addition to mid-infrared images, they determined = 3 10-5 M and t = 840 years (Meixner et al., 2004). These mass loss rate values are a factor of 10 to 100 lower than what we have determined here.
Hrivnak & Beiging (2005) determined mass loss rates and shell masses based on their measurements of CO gas in several transitional states, which allowed them to sample the CO emission further out and closer in to the star. The observations were modelled with a one-dimensional statistical equilibrium, radiative transfer code. They did not use a discrete shell with inner and outer boundary, as we have done here, but they did use a steep density law (=3), which produces a dense inner shell. Their values for the mass loss range from a few 10-4 M to a few 10-5 M, a factor of 10 less than we find here. For three objects in common, our values for the mass loss rate larger by factors of two to 100.
A comparison of our new model results for mass loss rates with two different studies reveals that our rates are a few to 100 times larger, but are confined to a thinner shell. As mentioned above, our mass loss rates are not as certain as we would like because the shell widths are not well constrained and assumed to be thin. Similar model fits could likely be produced with somewhat thicker shells with approximately the same total mass. Future higher resolution (0.1) imaging than is presently available in the mid-infrared will better constrain these shell widths. It is the total mass that is the better determined parameter from our models. Indeed, comparing the dust masses determined in these studies with our values of 0.72.8 10-3 M☉ (M/330 from Table 6), one finds much better agreement. Meixner et al. determined a similar value of 0.8 10-3 M☉ for IRAS 07134+1005, while Ueta et al. determined a value 20 times smaller, 0.03 10-3 M☉ for IRAS 22272+5435. If we compare with the Hrivnak & Bieging mass loss values based on CO gas and adjust with our gas-to-dust ratio of 330, we find dust masses 24 times smaller than ours, 0.24 10-3 M☉ and 0.42 10-3 M☉ for IRAS 07134+1005 and IRAS 22272+5435, respectively. However, if our gas-to-dust mass ratio is overestimated by a factor of 24, then the agreement would be excellent. Note that Meixner et al. determined a gas-to-dust mass ratio of 75 for IRAS 07134+1005.
6 RESULTS AND CONCLUSIONS
Our targets were selected with the goal of completing the sample of carbon-rich PPNs studied with mid-infrared spectroscopy. However, three additional carbon-rich PPNs were identified in the past few years that were not included (Reyniers et al., 2004, 2007). Therefore the sample of carbon-rich PPNs that have been observed in mid-infrared spectroscopy is complete except for these three objects. Below are listed results based primarily on the targets of this study, supplemented by more general results for the sample.
1. Three new 21 m sources were discovered: IRAS 065300213, 07430+1115 and 19477+2401. This brings to 16 the total of 21 m sources among the PPNs (Hrivnak et al., 2008). Improved spectra of this feature were obtained for four others.
2. The shape and central wavelength (20.10.1 m) of the the 21 m feature agrees with that found previously for the brighter sources using ISO spectra.
3. These spectra do not show the resolution of the 30 m feature into two features as was claimed based on ISO spectra. The suggested separation apparently was caused by a bad detector band in the ISO spectra and is not real.
4. The 11.3 m AIB feature is seen in all of the sources. The feature has a relatively consistent peak wavelength of 11.330.03 m. However, the presence of the features at 12.3 and 13.3 m and their peak wavelengths and shapes vary among the sources.
5. These results strengthen the correlation between the presence of the 21 m feature and evidence of carbon-rich nature of the sources. In particular, all of the 21 m sources are carbon-rich (C/O1.0), possess molecular carbon absorption features (C2, C3), and possess AIB features (Hrivnak et al., 2008).
6. All carbon-rich PPNs that have been observed possess the 21 m, 30 m, and AIB emission features. An exception may be IRAS 01005+7910 (OBe), the PPN with the hottest carbon-rich central star, which may or may not possess a weak 21 m feature. We also note that IRAS 195001709 is unusual in possessing the 21 m (weak) and 30 m (strong) features but weak or few AIB features (Volk et al., 2002).
7. The 21 m feature is present in all (but perhaps one) of the Galactic carbon-rich PPNs but is absent or weak in extreme carbon stars and PNs. This suggests that the carrier is a common part of the outflow during the PPN phase and that the radiation field is important to the presence of the feature. We propose (or This supports the idea) that the 21 m carrier is produced in the extreme mass loss near the end of the AGB phase, is excited during the PPN phase, and is then destroyed in the more extreme UV radiation field of the subsequent PN phase.
8. A narrow feature at 13.7 m due to C2H2 is observed in the spectra of five objects; it is seen in one source in absorption, in three in emission, and possibly one in both emission and absorption. These represent the first observations of C2H2 emission in a post-AGB object. C2H2 absorption is commonly seen as a strong feature in the preceding AGB stage of stellar evolution. While most may be incorporated into larger molecules in the evolution to PN, at least some is still present in some region around the star in the PPN phase. Studies of C2H2 provide a potential diagnostic of the physical conditions in the circumstellar envelope and should be followed up with high-resolution spectroscopy.
9. At 15.8 m a broad (1.3 m), unidentified emission feature is seen in the Spitzer spectra of four sources. This feature also appears to be present in ISO spectra of several additional 21 m sources. It is particularly strong in the two Spitzer sources with the relatively strongest 21 m feature. This suggests a possible correlation between the two features which, if confirmed, could be a valuable aid in the identification of the 21 m feature.
10. 1-D modeling of the SEDs indicates a dense cool (120150 K) shell of dust around the stars and also low density hot (500800 K) dust closer to the star. The mass-loss rates when the shells detached are high, ranging from a 10-4 M to a 6 10-3 M but the highest rates were not sustained for long. These result in shell masses of 0.2 to 1.0 M⊙, ejected over intervals of 160 to 820 years.
11. The results of the modeling of the dust shells imply ages since the termination of extensive mass loss of 10003000 years for all of the sources except IRAS 22574+6609. These ages for the expansion of the shell are consistent with the evolutionary ages of low-mass, post-AGB central stars (Blöcker, 1995b), as they should be. IRAS 22574+6609 appears to have only relatively recently left the AGB, 300 years ago.
References
- Bakker et al. (1997) Bakker, E. J., van Dishoeck, E. F., Waters, L. B. F. M., & Schoenmaker, T. 1997, A&A, 323, 469
- Bernard-Salas et al. (2006) Bernard-Salas, J., Peeters, E., Sloan, G.C., Cami, J., Guiles, S., & Houck, J.R. 2006, ApJ, 652, L29
- Blöcker (1995a) Blöcker, T. 1995a, A&A, 297, 755
- Blöcker (1995b) Blöcker, T. 1995b, A&A, 299, 727
- Buchanan et al. (2006) Buchanan, C. L., Kastner, J. H, Forrest, W.J., et al. 2006, AJ, 132, 1890
- Cernicharo et al. (2001) Cernicharo, J., Heras, A. M., Tielens, A. G. G. M., et al. 2001, ApJ, 546, L123
- Cernicharo et al. (1999) Cernicharo, J., Yamamura, I., González-Alfonso, E., et al. 1999, ApJ, 526, L41
- Forrest, Houck, & McCarthy (1981) Forrest, W. J., Houck, J. R., & McCarthy, J. F. 1981, ApJ, 248, 195
- García-Hernández et al. (2002) García-Hernández, D.A., Manchado, A., García-Lario, P., Domíngueq-Tagle, C., Conway, G.M., & Prada, F. 2002, A&A, 387, 955
- García-Lario et al. (1999) García-Lario, P, Manchado, A., Ulla, A., & Manteiga, M. 1999, ApJ, 513, 941
- Goebel & Moseley (1985) Goebel, J. H., & Moseley, S. H. 1985, ApJ, 290, L35
- Higdon et al. (2004) Higdon, S. J. U., et al. 2004, PASP, 116, 975
- Hony et al. (2001) Hony, S., Van Kerckhoven, C., Peeters, E., Tielens, A. G. G. M., Hudgins, D.M., & Allamandola, L.J. 2001, A&A, 370, 1030
- Hony, Waters, & Tielens (2001) Hony, S., Waters, L. B., F. M., & Tielens, A. G. G. M. 2001, A&A, 378, L41
- Hony, Waters, & Tielens (2002) Hony, S., Waters, L. B., F. M., & Tielens, A. G. G. M. 2002, A&A, 390, 533
- Houck et al. (2004) Houck, J. R., et al. 2004, ApJS, 154, 18
- Hrivnak (1995) Hrivnak, B.J. 1995, ApJ, 438, 341
- Hrivnak, Geballe, & Kwok (2007) Hrivnak, B.J., Geballe, T. R., & Kwok, S. 2007, ApJ, 662, 1059
- Hrivnak & Kwok (1991b) Hrivnak, B.J., & Kwok, S. 1991b, ApJ, 368, 564
- Hrivnak & Kwok (1991a) Hrivnak, B.J., & Kwok, S. 1991a, ApJ, 371, 631
- Hrivnak & Kwok (1999) Hrivnak, B.J., & Kwok, S. 1999, ApJ, 513, 869
- Hrivnak et al. (1985) Hrivnak, B.J., Kwok, S., & Boreiko, R.T. 1985, ApJ, 294, L113
- Hrivnak et al. (2008) Hrivnak, B.J., Volk, K., Geballe, T.R., & Kwok, S. 2008, in IAU Symp. 251: Organic Matter in Space, eds. S. Kwok, S.A. Sanford, in press
- Hrivnak, Volk, & Kwok (2000) Hrivnak, B.J., Volk, K., & Kwok, S. 2000, ApJ, 535, 275
- Hudgins & Allamandola (1999) Hudgins, D.M., & Allamandola, L.J. 1999, ApJ, 516, L41
- Jiang et al. (2005) Jiang, B.W., Zhang, K., & Li, A. 2005, ApJ, 630, L77
- Keady & Ridgway (1993) Keady, J.J., & Ridgway, S.T. 1993, ApJ, 406, 199
- Kelly & Hrivnak (2005) Kelly, D. M., & Hrivnak, B. J. 2005, ApJ, 629, 1040
- Kimura et al. (2005) Kimura, Y., Nuth, J.A., III, & Ferguson, F.T. 2005, ApJ, 632, L159
- Kraemer et al. (2006) Kraemer, K., Sloan, G.C., Bernard-Salas, J., Price, S.D., Egan, M.P., & Wood, P.R. 2006, ApJ, 652, L25
- Kurucz (1993) Kurucz, R. L. 1993, “ATLAS9 Stellar Atmosphere Programs and 2 km/s Grid,” Kurucz CD-ROM No. 13. Cambridge, Mass.: Smithsonian Astrophysical Observatory
- Kwok, Hrivnak, & Geballe (1995) Kwok, S., Hrivnak, B.J., & Geballe, T. R. 1995, ApJ, 454, 394
- Kwok, Volk, & Bernath (2001) Kwok, S., Volk, K., & Bernath, P. 2001, ApJ, 554, L87
- Kwok, Volk, & Hrivnak (1989) Kwok, S., Volk, K., & Hrivnak, B.J. 1989, ApJ, 345, L51
- Kwok, Volk, & Hrivnak (1999a) Kwok, S., Volk, K., & Hrivnak, B.J. 1999a, in IAU Symp. 191: Asymptotic Giant Branch Stars, ed. T. Le Bertre, A. Lèbre, C. Waelkens (San Francisco: ASP), 297
- Kwok, Volk, & Hrivnak (1999b) Kwok, S., Volk, K., & Hrivnak, B.J. 1999b, A&A, 350, L35
- Leung (1976) Leung, C.M. 1976, ApJ, 209, 75
- Men’shchikov, Hofmann, & Weigelt (2002) Men’shchikov, A.B., Hofmann, K.-H., & Weigelt, G. 2002, A&A, 392, 921
- Meixner et al. (2004) Meixner, M., Zalucha, Z., Ueta, T., Fong, D., & Justtanont, K. 2004, ApJ, 614, 371
- Moutou et al. (1999) Moutou, C., Sellgren, K., L’eger, A., Verstraete, L., & Le Coupanec, P. 1999, in Solid Interstellar Matter: The ISO Revolution, ed. L. d’Hendecourt, C. Joblin, A. Jones (Springer-Verlag: Berlin), 89
- Neckel & Klare (1980) Neckel, Th., & Klare, G 1980, A&AS, 42, 251
- Omont et al. (1995) Omont, A., Moseley, S. H., Cox, P., et al. 1995, ApJ, 454, 819 5 Oppenheimer, B. D., Bieging, J. H., Schmidt, G.D., Gordon, K.D., Misselt, K.A.,
- Peeters et al. (2002) Peeters, E., Hony, S., Van Kerckhoven, C., Tielens, A.G.G.M., Allamandola, L.J., Hudgins, D.M., & Bauschlicher, C.W. 2002, A&A, 390, 1089
- Posch et al. (2004) Posch, Th., Mutschke, H., & Andersen, A. 2004, ApJ, 616, 1167
- Reddy et al. (2002) Reddy, B. E., Lambert, D. L., Gonzalez, G., & Yong, D. 2002, ApJ, 564, 482
- Reyniers et al. (2007) Reyniers, M., Van de Steene, G.C., van Hoof, P.A.M., & Van Winckel, H. 2007, A&A, 471, 247
- Reyniers et al. (2004) Reyniers, M., Van Winckel, H., Gallino, R., & Straniero, O. 2004, A&A, 417, 269
- Rouleau & Martin (1991) Rouleau, F., & Martin, P.G. 1991, ApJ, 377, 526
- Sahai et al. (2007) Sahai, R., Morris, M., Sánchez Contreras, C., & Claussen, M. 2007, AJ, 134, 2200
- Sánchez Contreras et al. (2006) Sánchez Contreras, C., Le Mignant, D., Sahai, R., Chaffee, F.H., & Morris, M. 2006, in IAU Symp. 234: Planetary Nebulae in our Galaxy and Beyond, ed. M.J. Barlow, R.H. Méndez (Cambridge: Cambridge University Press), 71
- Sellgren, Uchida, & Werner (2007) Sellgren, K., Uchida, K.I., & Werner, M.W. 2007, ApJ, 659, 1338
- Sloan et al. (2007) Sloan, G.C., Jura, M., Duley, W.W., et al. 2007, ApJ, 664, 1144
- Sloan et al. (2005) Sloan, G.C., Keller, L.D., Forrest, W.J., et al. 2005, ApJ, 632, 956
- Speck & Hofmeister (2004) Speck, A. K. & Hofmeister, A. M. 2004, ApJ, 600, 986
- Su et al. (2001) Su, K.Y.L., Hrivnak, B.J., & Kwok, S. 2001, AJ, 122, 1525
- Szczerba et al. (1999) Szczerba, R., Henning, Th., Volk, K., Kwok, S., & Cox, P. 1999, A&A, 345, L39
- Ueta et al. (2000) Ueta, T., Meixner, M., & Bobrowsky, M. 2000, ApJ, 528, 861
- Ueta et al. (2001) Ueta, T., Meixner, M., Hintz, P.M., et al. 2001, ApJ, 557, 831
- van Diedenhoven et al. (2004) van Diedenhoven, B., Peeters, Van Kerckhoven, C.,E., Hony, S., Hudgins, D.M., Allamandola, L.J., & Tielens, A. G. G. M., 2004, ApJ, 611, 928
- Van Kerckhoven et al (2000) Van Kerckhoven et al. 2000, A&A, 357, 1013
- Van Winckel (2003) Van Winckel, H. 2003, ARA&A, 41, 397
- Van Winckel & Reyniers (2000) Van Winckel, H. & Reyniers, M. 2000, A&A, 354, 135
- Volk (2003) Volk, K., 2003, in IAU Symp. 209: Planetary Nebulae Their Evolution and Role in the Universe, ed. S. Kwok, M. Dopita, R. Sutherland (San Francisco: ASP), 281
- Volk & Kwok (1989) Volk, K., & Kwok, S. 1989, ApJ, 342, 345
- Volk, Kwok, & Hrivnak (1999) Volk, K., Kwok, S., & Hrivnak, B.J. 1999, ApJ, 516, L99
- Volk et al. (2002) Volk, K., Kwok, S., Hrivnak, B.J., & Szczerba, R. 2002, ApJ, 567, 412
- Volk, Xiong, & Kwok (2000) Volk, K., Xiong, G. Z., & Kwok, S. 2000, ApJ, 530, 408
- von Helden et al. (2000) von Helden, G., et al. 2000, Science, 288, 313
- Werner et al. (2004) Werner, M., et al. 2004, ApJS, 154, 11
- Willems (1988) Willems, F.J.1988, A&A, 203, 51
- Zhukovska & Gail (2008) Zhukovska, S., & Gail, H.-P. 2008, A&A, 486, 229
| IRAS ID | LH | SH | ||
|---|---|---|---|---|
| Date | TimeaaNumber of scan cycles times the on-source integration time in seconds. | Date | TimeaaNumber of scan cycles times the on-source integration time in seconds. | |
| 05113+1347 | 2006 Mar 17 | 3 14 | 2004 Oct 03bbObserved in GTO93, PI: D. Cruikshank. | 3 30 |
| 05341+0852 | 2007 Apr 16 | 3 14 | 2004 Mar 22bbObserved in GTO93, PI: D. Cruikshank. | 3 30 |
| 065300213 | 2006 Apr 25 | 3 14 | 2006 Apr 25 | 3 30 |
| 07430+1115 | 2007 Apr 27 | 3 14 | 2007 Apr 27 | 3 30 |
| 19477+2401 | 2005 Oct 16 | 3 6 | 2004 May 13bbObserved in GTO93, PI: D. Cruikshank. | 3 6 |
| 22574+6609 | 2005 Oct 12 | 3 6 | 2004 Aug 10bbObserved in GTO93, PI: D. Cruikshank. | 4 30 |
| 23304+6147 | 2005 Dec 15 | 3 6 | 2005 Dec 15 | 3 30 |
| IRAS ID | 2MASS ID | RA | Decl. |
|---|---|---|---|
| 05113+1347 | 051407751350282 | 05:14:07.76 | 13:50:28.3 |
| 05341+0852 | 053655060854087 | 05:36:55.06 | 08:54:08.7 |
| 065300230 | 065531810217283 | 06:55:31.82 | 02:17:28.3 |
| 07430+1115 | 074551391108196 | 07:45:51.39 | 11:08:19.6 |
| 19477+2401 | 194954912408532 | 19:49:54.91 | 24:08:53.3 |
| 22574+6609 | 225918356625482 | 22:59:18.36 | 66:25:48.2 |
| 23304+6147 | 233244796203491 | 23:32:44.79 | 62:03:49.1 |
| Relative | |||
|---|---|---|---|
| Feature | Width (FWZL)aaFull width at zero level. | bbWavelength of feature peak in a plot of Fν vs. . | |
| IRAS ID | Strength | (m) | (m) |
| 05113+1347 | 0.49 | 5.4 | 20.2 |
| 05341+0852 | 0.35 | 5.4 | 20.1 |
| 065300230 | 1.12 | 6.0 | 20.1 |
| 07430+1115 | 0.21 | 4.6 | 20.2 |
| 22574+6609 | 0.37 | 5.7 | 20.1 |
| 23304+6147 | 1.46 | 5.7 | 20.1 |
| IRAS ID | SpT | C/OaaReferences to C/O abundances: Multiple objects - Van Winckel & Reyniers (2000), Reddy et al. (2002); IRAS 065300213 - Reyniers et al. (2004). | AIB Features (39 m)b,cb,cfootnotemark: | RefddReferences for AIB features: (1) Hrivnak, Geballe, & Kwok (2007); (2) Hrivnak, Volk, & Kwok (2000); (3) review of ISO archival spectrum. | 11.3 m | 21 m | 30 m | 13.7 meeE = emission; A = absorption feature; N = no feature. | Other Features in Spitzer SpectrabbColons indicate an uncertain detection; mw = medium-wide feature; abs = absorption feature. |
|---|---|---|---|---|---|---|---|---|---|
| 05113+1347 | G8 Ia | 2.4 | 3.3:, 3.4: | 1 | Y | Y | Y | N | 12.1, 13.3: 15.8(mw):, 22.3 |
| 05341+0852 | G2 0-Ia | 1.6 | 3.3, 3.4, 6.2, 6.9, 8(br) | 1,2 | Y | Y | Y | E | 12.4, 15.8(mw), (no LH Spitzer spectrum) |
| 065300213 | F5 I | 2.8 | 3.3 | 1 | Y | Y | Y | E | 12.3, 13.2, 15.8(mw), 22.3 |
| 07430+1115 | G5 0-Ia | 3.3, 3.4 | 1 | Y | Y | Y | E: | 12(mw) | |
| 19477+2401 | ggFaint, with no visible spectra. | ggFaint, with no visible spectra. | ffNot observed in the 3 m spectral region. | 1 | hhNot observed in this spectral region with Spitzer. | Y | Y | hhNot observed in this spectral region with Spitzer. | (no SH spectrum), 22.3, 28.6:, 29.8:, 32.6: |
| 22574+6609 | ggFaint, with no visible spectra. | ggFaint, with no visible spectra. | ffNot observed in the 3 m spectral region. , 6.2, 6.9, 7.7, 8(br) | 1,2 | Y | Y | Y | A | 12.6, 17(mw) |
| 23304+6147 | G2 Ia | 2.8 | 3.3, 3.4:, 6.2, 6.9, 7.7, 8.6 (8br) | 1,3 | Y | Y | Y | A/E: | 12.3, 13.2 15.9(mw), 22.3 |
| Cool Dust | Hot Dust | ||||||||||||||||
|---|---|---|---|---|---|---|---|---|---|---|---|---|---|---|---|---|---|
| IRAS ID | (c)aaDust temperature at rin. | (h)aaDust temperature at rin. | /bbDensity ratio at r. | ||||||||||||||
| (11.22 m) | (V) | (K) | (/kpc2) | (K) | ( pc/kpc) | (( pc/kpc)) | () | (K) | ( pc/kpc) | () | (ISM) | ||||||
| 051131347 | 0.0085 | 1.2 | 2.0 | 5500 | 170 | 132 | 4.2 | 5.4 | 4.5 | 714 | 0.043 | 3.4 | 12,500 | 2.8 | |||
| 053410852 | 0.0067 | 0.94 | 3.5 | 6500 | 126 | 146 | 2.5 | 1.0 | 486 | 0.117 | 6.7 | 15,000 | 3.7 | ||||
| 065300213 | 0.0052 | 0.73 | 3.0 | 7000 | 280 | 130 | 5.4 | 1.6 | 5.0 | ||||||||
| 074301115 | 0.018 | 2.5 | 2.0ccIncluded also are aliphatic infrared bands at 3.4 and 6.9 m. | 5500 | 187 | 139 | 2.8 | 3.3 | 1.1 | 1.5 | |||||||
| 225746609 | 0.39 | 55 | 2.0 | 5500 | 145 | 148 | 1.0 | 1.6 | 3.0 | 765 | 0.029 | 4.9 | 7700 | 3.0ccFixed value. | |||
| 233046147 | 0.030 | 4.2 | 2.5 | 5500 | 320 | 122 | 5.0 | 6.4 | 2.0 | 609 | 0.083 | 1.7 | 10,000 | 1.8 | |||
| DaaDistance based upon assumed luminosity of 8300 L☉. | VbbExpansion velocities as found in the literature and averaged in some cases. | rin(c) | M | t(M)ccDuration of enhanced mass loss, determined from (rout(c) - rin(c))/V. | tkinddKinematical age, determined from rin(c)/V. | ||
|---|---|---|---|---|---|---|---|
| IRAS ID | (kpc) | (km s-1) | (M⊙ yr-1) | (pc) | (M⊙) | (yr) | (yr) |
| 051131347 | 7.0 | 10 | 3.2 | 0.030 | 0.25 | 820 | 2900 |
| 053410852 | 8.2 | 12 | 1.0 | 0.020 | 0.27 | 1600 | |
| 065300230 | 5.4 | 14 | 1.2 | 0.030 | 0.22 | 2100 | |
| 074301115 | 6.7 | 15 | 1.1 | 0.019 | 0.27 | 180 | 1200 |
| 225746609 | 7.6 | 26 | 5.8 | 0.008 | 0.95 | 160 | 280 |
| 233046147 | 5.1 | 12 | 1.2 | 0.025 | 0.66 | 580 | 2000 |