Anisotropy Studies with the Pierre Auger Observatory
Abstract
An anisotropy signal for the arrival directions of ultra-high energy cosmic rays (UHECR) of more than 99% confidence level was established using data collected by the Pierre Auger Observatory. Cosmic rays with energy above eV show a correlation with the positions of extragalactic nearby active galactic nuclei (AGN), being maximum for sources at less than 100 Mpc and angular separation of a few degrees. The evolution of the correlation signal with the energy shows that the departure from anisotropy coincides with the flux suppression observed in the spectrum, being therefore consistent with the hypothesis that the correlated events have their origin in extragalactic sources close enough to avoid significant interaction with the cosmic microwave background (the Greisen-Zatsepin-Kuz’min effect). Even though the observed signal cannot unambiguously identify AGNs as the production sites of UHECRs, the potential sources have to be distributed in a similar way. A number of additional statistical tests were performed in order to further understand the nature of the correlation signal.
I Introduction
The origin of the highest energy cosmic rays (above eV), as far as their mass composition and production mechanisms are concerned, is still undetermined. However, the recent Auger results, which include limits on the diffuse flux of neutrinos [1], bounds on the flux of photons above eV obtained with the Surface Detector (SD) and Fluorescence Detector (FD) together [2] and with the SD only [3], have put stringent bounds on top-down models, favoring, therefore, the hypothesis of production by acceleration process in powerful astrophysical sources [4].
Anisotropy studies play an important role in the identification of the sources and can even provide valuable information on the chemical composition. Detectors like the large Auger surface array are sensitive to showers with energies around above eV, but the detector reaches 100% efficiency only above eV. Given the steep falling spectrum, even taking into account the rapidly falling efficiency of the detector below this threshold, the Auger Surface Detector sample is dominated by below-saturation showers. In this energy region, despite the higher statistics, the myriad of systematic effects associated to the detector exposure makes large scale anisotropy analysis a very challenging task [5]. Weather induced effects, like seasonal and diurnal trigger rate modulations [6], geometric effects associated to the particular arrangement of the SD array and the influence of the local geomagnetic field on the air shower development are some of the examples of systematic effects which one has to deal with in order to extract reliable information on anisotropies over extended regions of the sky. For energies above eV, the Pierre Auger Collaboration has already published some results on one-dimensional analyzes, that is, right-ascension first harmonic analysis, Fourier development in modified sidereal time [7] and the East-West method [8]. The galactic centre is a natural candidate for searches of anisotropy, since there are a number of evidences that it harbors, as essentially every galaxy in the universe, a massive black hole, which would be associated to the strong radio emissions from Sagittarius A*, and the -rays detected by H.E.S.S. [9]. However, above eV, the Auger results in the galactic centre region show no signs of anisotropy [10], despite claims in the past of large excesses in this region of the sky [11, 12].
At the very edge of the cosmic ray spectrum measured so far, the systematic effects are no longer so dominant, however, now the extremely low statistics is the challenge to be faced. On the other hand, it has been long since people realized that at such extreme energies, charged particles magnetic rigidity, both in galactic and extra-galactic fields, should be large enough to avoid a complete isotropisation of their arrival directions. In fact, the Auger Collaboration has recently demonstrated that its highest energy events, that is, above 60 EeV (1 EeV = eV), are anisotropic [13, 14]. The result has been established by means of a correlation found between the arrival directions of the showers and a catalog of AGNs. The result has demonstrated the feasibility of charged particle astronomy. This conference paper contains a discussion of the results presented in the two papers mentioned above and some remarks on their implications to the cosmic ray physics as well as on issues they have raised after publication.
II Current Array Status and the Data Set Used
The Pierre Auger Observatory has now reached completion with all of its 1600 surface detector stations deployed on ground and the FD with all 24 telescopes taking data together since February 2007. The surface detector has been taking data stably since January 2004. The data presented in this conference contribution corresponds to showers detected by the SD in the period 1 January 2004 up to 31 August 2007, amounting for a total integrated exposure of 9000 km2 sr yr. In this period, the surface detector has continuously grown in size from only 154 to 1388 stations.
In order to avoid border effects, which tend to be important during the detector growing process, when the array has a non negligible number of holes, we consider only events where the station with the highest signal is surrounded by at least 5 other active tanks, that is, stations actually taking data when the shower reaches the ground. To further constrain the impact of dead stations in the event reconstruction, the estimated shower core position is required to fall inside a triangle of active stations.
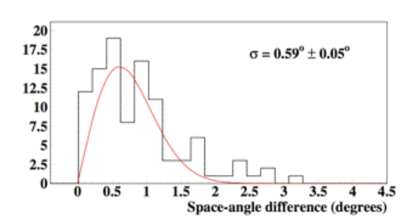
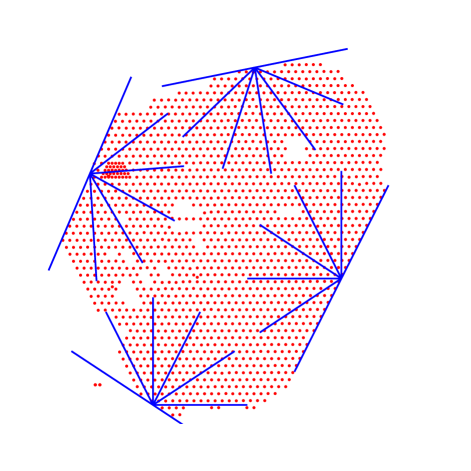
Obviously, for anisotropy studies, the accuracy with which one reconstructs the shower direction plays a special role. The reconstruction of the event direction is done by fitting the arrival times predicted by a certain shower front model (either a plane or a curved form) propagating at the speed of light to the measured arrival times in the tanks triggered by a shower. The accuracy achieved in such a reconstruction is limited essentially by the clock resolution of the station and the intrinsic fluctuations of the arrival time of the first particle [15]. The Auger SD angular resolution (AR) above 1019 eV, is estimated to be better than 1∘, as defined by the angular window which would contain 68% of all reconstructed showers produced by primaries coming from a point source [16]. Figures 2 and 2 show two different estimations of the AR in Auger, using a sub-array of doublets111Doublets are pairs of tanks deployed very close to each other (11 m), so that they sample essentially the same part of the shower., through which is possible to reconstruct the same shower with two independent sets of tanks and using the hybrid events, by comparing the SD and SD+FD reconstructions.
By profiting from the unique hybrid nature of the Auger detector, the so called hybrid events, the ones detected simultaneously by the SD and the FD, are used to inter-calibrate these two detectors, providing an energy estimation which is almost independent of Monte Carlo simulations. Firstly, we have identified a SD observable which could be used to estimate the shower energy, and this was taken be the estimated signal 1000 m () from the reconstructed shower core. Secondly, as such a signal is attenuated by the atmosphere, a correction is applied using the so called Constant Intensity Cut (CIC) [17]. After the correction, is normalized to a reference angle (38 degrees) and the final observable () can then be correlated to the calorimetric energy measurement performed by the FD [18]. Once such a calibration curve is built for the hybrid events, it can be used for the whole high statistics sample measured by the SD.
III Establishing the Anisotropy of the Highest Energy Sample
III-A The source catalog and the scan method
The Veron-Cetty (V-C) catalog [19] is a compilation of different surveys and its 12th edition contains 85221 quasars, 1122 BLLacs and 21737 AGNs (of which 694 are less than approximately 100 Mpc from us). By considering only its closest sources (), the probability for chance correlations with sources from the catalog, already taken into account the Auger exposure, is as high as approximately 70% for angular windows of 7∘. In other words, it is still possible to look for anisotropies. As farther sources are aggregated, of course, chance correlation becomes essentially 100%, making searches for deviations from isotropy impossible.
Anisotropy signals in the cosmic ray arrival directions might be identified with the help of an intermediate source catalog through which a correlation signal might be established using an appropriate set of parameters such as: the typical angular scale of the correlation signal, the maximum redshift of the candidate sources and the minimum energy of the events. A scan over these parameters can then be performed looking for the typical values leading to a minimum of the probability for such a data-catalog correlation has been produced by chance. Given events above a certain energy threshold , and a set of sources (limited by a maximum redshift ), the probability that at least of them are at less than a certain angular distance from one of the catalog’s sources, just by chance, is given by the cumulative binomial probability
| (1) |
where is the probability for an event, drawn uniformly on the sky (but taking into account the detector exposure), to be at an angular distance less than from at least one of the sources with .
III-B The exploratory scan
A potential anisotropy signal in a subset of the Auger SD data, collected between 1 January 2004 and 27 May 2006, was identified through a scan over the 3 parameters mentioned above. Angular windows from 1∘ to 6∘, V-C sources up to and showers with energies above 40 EeV were considered. The minimum and maximum values for the windows are limited by the detector angular resolution and the constraint of moderate chance correlation probabilities with sources up to a certain maximum redshift, respectively. The soil energy was chosen in order to cope with the fact that typical magnitudes for the galactic and extra-galactic magnetic fields, will imprint deviations on low energy primaries, even protons, larger (in average) than the angular interval considered. The minimizing parameters for this exploratory scan were: , and EeV. For such a configuration, 12 out of 15 events were correlated with V-C sources when only 3.2 were expected by chance (21% of chance correlation probability).
III-C The signal confirmation
The Pierre Auger Collaboration has an internal policy which states that any potential anisotropy signal should be tested on an independent data set [20]. Therefore, a prescription was established in order to confirm or to reject the potential signal. Given the very low statistics at the energies considered, the Collaboration decided to proceed through a sequential analysis with a predefined stopping rule, since such tests can give an answer at earlier stages in the sequence. We have chosen isotropy as our null hypothesis, adopting a % Type I error, that is, the allowed probability for a false claim of anisotropy, and a Type II error of %, that is, the probability for an incorrect claim that the data was isotropic. The error determines the power of the test (), that is, %. By moving the bounds of the exploratory scan, the correlation power could drop from 80% (12/15) to values as low as 60% (8/14). In order to keep the test power above the 95% threshold, even in the case of such a lower correlation power, the total length of the test was set to 34 additional detected events above 40 EeV (the predefined stopping rule).
This prescription was fulfilled almost a year later on 25 May 2007, with the detection of 8 new events above 40 EeV, of which 6 were at less than 3.1∘ from AGNs up to 75 Mpc from us. We could then claim that the hypothesis of isotropy for the highest energy Auger events ( EeV) was rejected with at least 99% CL.
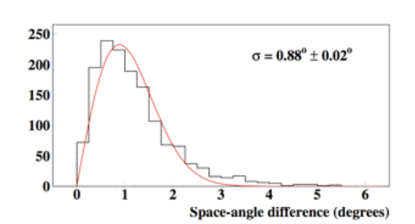
Hypothesis tests done via a classical sequential analysis have to deal with the fact that a penalty factor should be included at each intermediate step where the hypothesis has been tested, simply due to the fact that by performing the test several times, the probability for fulfilling it by chance is enhanced. Such a penalty factor will therefore depend on the total length of the test, introducing an undesirable dependence of the corresponding probability being monitored on data actually not taken. These classical tests drawbacks can be avoided by the use of a likelihood ratio test [21]. In figure 3 one can see the evolution of the likelihood ratio 222The numerator is the probability to get a particular data set in case the anisotropy hypothesis is true and the denominator the corresponding probability when the isotropy hypothesis is true. Notice that since we do not know the true correlation power in case of anisotropy, we have integrated over this variable. [22]
| (2) |
as a function of time and the rejection of the isotropy hypothesis after the collection of 10 events out of which 7 were correlated with AGNs for the prescription parameters.
III-D Combining the full data set
Once the anisotropy signal has been confirmed with the independent data set, all the data collected since 1 January 2004 was submitted to the same scan, using as well a new calibration available at the time. The minimum was achieved for the 27 events above 57 EeV, of which 20 were at less than 3.2∘ from AGNs of the V-C catalog up to approximately 71 Mpc (). Only 5.6 events are expected to correlate by chance under such conditions, and the probability for that to have happened by chance (already penalizing for the scan procedure) is approximately .
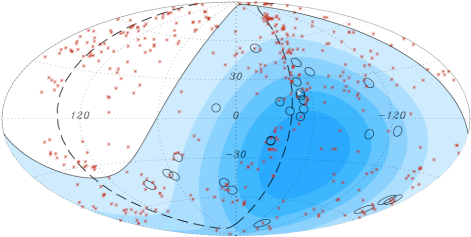
Figure 4 contains a sky map in galactic coordinates with the 27 events above 57 EeV for the full data set with circles of 3.2∘ around each of them, as well as the positions of the 442 AGNs with . The color code indicates the Auger relative exposure in each direction of the sky. A clear property of the events distribution is the concentration close to the supergalactic plane (dashed line), following the local anisotropic matter distribution in our neighborhood. Notice as well the two events at less than 3∘ from Centaurus A, one of the closest AGNs.
IV Signal Properties
A closer look at the signal behavior in the vicinity of the minimum in the parameter space, shows the presence of additional secondary minima, indicating that the minimizing parameters shown above should not be taken at their face values, but only as indicative of the true correlation scales. Another distinctive property of the signal evolution as a function of energy is the sharp transition to the global minimum, suggesting that something abrupt happens around and have the effect of enhancing the anisotropy signal.
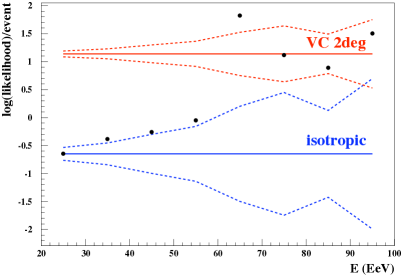
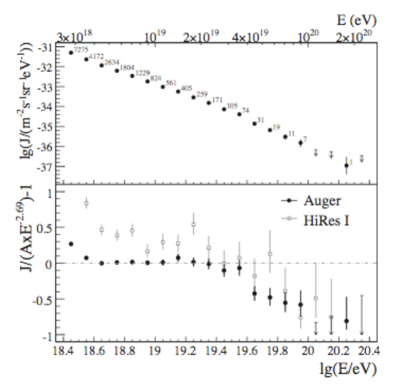
Figure 5 shows the average log-likelihood per event LL as a function of the energy threshold, defined as
| (3) |
where the sum runs over all the events above the energy threshold and is the column density in the direction of the -event of a map built by smoothing out the V-C catalog with Gaussians of 2∘ around each of its sources. The plot shows also the 1 expectation bounds of the log-likelihood for sets of events (consistent with the statistics in the data for the corresponding energy threshold) drawn from the V-C catalog itself (red lines) and from an isotropic distribution (blue lines). One can clearly see the abrupt transition from isotropy to V-C-like anisotropy as the energy reaches 60 EeV from below. Such a sharp transition is accompanied by a 50% drop in the flux, from what would be expected from a simple extrapolation of the measured flux just below the cutoff, in the form of a power law as can be seen in figure 5. This striking coincidence is an additional evidence for the existence of the GZK effect, in which the sudden horizon shrinking, as the energy threshold for pion photo-production is reached, has the immediate consequence of revealing the anisotropies of our clumpy neighborhood. If sources were simply running out of power at energies around 60 EeV, such a sudden appearance of anisotropy would not be expected.
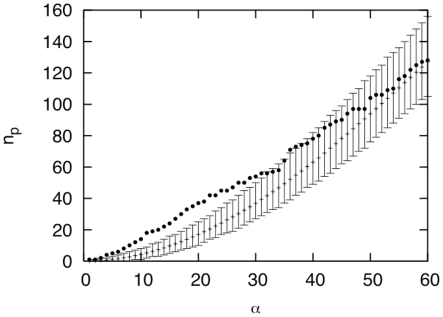
Some idea of the anisotropic nature of the 27 most energetic events detected by the Auger Observatory might be obtained without using the V-C catalog, therefore avoiding the incompleteness issues related to this compilation of sources. One of the most simple intrinsic properties of a given set of arrival directions is given by its auto-correlation function, that is, the number of pairs for different angular scales. The auto-correlation for the highest events identified in the scan over the full data set is shown in figure 6, together with the expectations from isotropic data sets. The departure from isotropy can be seen in a wide range of angles from 9∘ to 22∘, where the data shows a larger number of pairs than the isotropic expectations.
V Additional Remarks
The topology of the galactic magnetic field is highly unknown. The few measurements of polarized light from galactic and extragalactic pulsars seems to point to a field of some G with direction reversals between arms and an exponentially decreasing magnitude as a function of the distance to the galaxy center measured in the galactic plane [23]. With the increasing statistics of the Auger surface detector, the prospects for the detection of multiplets are very promising, which could bring valuable information on the galactic field structure. However, a true knowledge of the field topology should be provided by a dedicated experiment, such as the Square Kilometer Array (SKA) [24], which plans to measure about a million pulsar rotation curves, building a true 3-dimensional map of the regular magnetic field component in our galaxy. This kind of information, combined with the detection of multiplets, would enable us to measure particles rigidity dependence with energy and, in turn, get information on their chemical composition.
As already mentioned, the coincidence in energy between the flux attenuation and the enhancement of the anisotropy signal is an additional evidence for the GZK effect. Therefore, one could naively identify the maximum distance of sources coming from the scan with the horizon at (defined as the distance from us containing the sources responsible for 90% of the protons above a certain energy threshold.). At a first sight, then, the value of 75 Mpc for as compared to Mpc [25] for the proton horizon at 60 EeV (assuming continuous energy losses, a uniform distribution of sources with equal intrinsec luminosities) could be seen as an inconsistency. Nonetheless, and the horizon are not even linearly correlated, chance correlations with foreground sources induce some bias on towards smaller source distances, and the same effect can be obtained in the presence of a large local overdensity.
The HiRes Collaboration [26] has performed a similar analysis, but it does not seem to confirm the Auger result. Above 56 EeV, from a total of 13 events, only 2 are correlated with AGNs with . A difference in energy scale larger than the one envisaged by the Hires Collaboration could explain the discrepance if one believes the Northern and Southern skies are not so much different. On the other hand, an apparent lack of events in the region corresponding to the Virgo cluster seems to be a property of both data sets, an effect which could arise in a scenario where the bulk of the flux reaching us is generated in a very limited number of sources, like has been suggested in [27], in particular, analyzing the possibility of being Cen A the sole source. The construction of the Auger North [28] will allow us to crosscheck the anisotropy results obtained from the South Observatory and from HiRes, to enhance the statistics in the highest energy part of the spectrum, look for multiplets, and even measure individual source spectra.
A detailed study of the sources correlating with the Auger high energy events, shows that they do not constitute the sub-sample with the most powerful sources. It is worth stressing though, that we do not claim the identification of the cosmic rays sources, and given the size of the correlation scale of less than , it is impossible to pinpoint the true ones, and essentially, anything whose spatial distribution, when convoluted with the magnetic deflections, follows the AGNs clustering properties, cannot be excluded so far. An interesting possibility raised in [29] is that, perhaps, some of the Auger events are pointing back to the last scattering centers, instead of their original sources, due to the presence of an inhomogeneously magnetized intergalactic medium.
There have been some concerns with respect to the incompleteness of the V-C catalog, close to the galactic plane (due to dust extinction), at high redshifts and the lack of a selection function, since this is in fact a compilation of surveys and not a survey by itself. However, the demonstration of the anisotropy is not affected by these problems, since the catalog has been used only as an intermediate step in order to establish the typical scale of the anisotropy signal.
VI Conclusion
The Pierre Auger Collaboration has established with more than 99% CL the anisotropy of its highest energy sample. The reconstructed directions of showers with energy above 60 EeV show a correlation on angular scales of less than with the positions of AGNs up to 100 Mpc from us. The evolution of the signal with the energy shows a sharp transition from isotropy to anisotropy at EeV, and such a transition coincides with the flux attenuation observed in the Auger spectrum. This is an additional evidence for the existence of the GZK cutoff, where the abrupt reduction in the particles mean free path as the threshold for pion photo-production in the CMB is achieved, makes the universe essentially opaque at scales much larger than 100 Mpc for particles above 60 EeV. As a byproduct, the small effective horizon at high energies enhances the anisotropies signal, revealing the clumpy aspects of the structures in our local universe. Even though the correlation with the V-C catalog seems to be quite robust, the angular scale of does not make possible to unambiguously identify the sources. Essentially, anything which clusters (after taking into account magnetic deflections) in a similar way as AGNs are cannot be excluded as the true sources. Intrinsic (catalog independent) properties of the events, such as their auto-correlation function, show a clear departure from isotropy in a large angular range.
References
- [1] J. Abraham et al. [The Pierre Auger Collaboration], Phys. Rev. Lett. 100, 211101 (2008) [arXiv:0712.1909 [astro-ph]].
- [2] J. Abraham et al. [Pierre Auger Collaboration], Astropart. Phys. 27, 155 (2007) [arXiv:astro-ph/0606619].
- [3] J. Abraham et al. [Pierre Auger Collaboration], Astropart. Phys. 29, 243 (2008) [arXiv:0712.1147 [astro-ph]].
- [4] D. V. Semikoz and P. A. Collaboration, arXiv:0706.2960 [astro-ph].
- [5] E. M. Santos, C. Bonifazi and A. Letessier-Selvon, Astropart. Phys. 30, 39 (2008) [arXiv:0804.1533 [astro-ph]].
- [6] C. Bleve [Pierre Auger Collaboration], arXiv:0706.1491 [astro-ph].
- [7] P. Billoir and A. Letessier-Selvon, Astropart. Phys. 29, 14 (2008) [arXiv:0706.3705 [astro-ph]].
- [8] E. Armengaud [Pierre Auger Collaboration], arXiv:0706.2640 [astro-ph].
- [9] F. Aharonian et al. [The HESS Collaboration], Astron. Astrophys. 425, L13 (2004) [arXiv:astro-ph/0408145].
- [10] M. Aglietta et al. [Pierre Auger Collaboration], Astropart. Phys. 27, 244 (2007) [arXiv:astro-ph/0607382]. E. M. Santos [Pierre Auger Collaboration], in Proc. 30th ICRC, Merida, Mexico (2007), in press, arXiv:0706.2669 [astro-ph].
- [11] N. Hayashida et al. [AGASA Collaboration], Astropart. Phys. 10, 303 (1999) [arXiv:astro-ph/9807045].
- [12] J. A. Bellido, R. W. Clay, B. R. Dawson and M. Johnston-Hollitt, Astropart. Phys. 15, 167 (2001) [arXiv:astro-ph/0009039].
- [13] J. Abraham et al. [Pierre Auger Collaboration], Science 318, 938 (2007) [arXiv:0711.2256 [astro-ph]].
- [14] J. Abraham et al. [Pierre Auger Collaboration], Astropart. Phys. 29, 188 (2008) [Erratum-ibid. 30, 45 (2008)] [arXiv:0712.2843 [astro-ph]].
- [15] C. Bonifazi, A. Letessier-Selvon and E. M. Santos [Pierre Auger Collaboration], Astropart. Phys. 28, 523 (2008) [arXiv:0705.1856 [astro-ph]].
- [16] M. Ave [Pierre Auger Collaboration], arXiv:0709.2125 [astro-ph].
- [17] J. Hersil, I. Escobar, D. Scott, G. Clark and S. Olbert, Phys. Rev. Lett. 6, 22 (1961).
- [18] J. Abraham et al. [Pierre Auger Collaboration], Phys. Rev. Lett. 101, 061101 (2008) [arXiv:0806.4302 [astro-ph]].
- [19] M.-P. Véron-Cetty, P. Véron, Astron. Astrophys. Volume 455, Issue 2, 773 (2006).
- [20] R. W. Clay [Pierre Auger Collaboration], arXiv:astro-ph/0308494.
- [21] A Wald, Ann. Math. Stat. 16, 117 (1945); ibid. Sequential Analysis, New York, NY, John Wiley and Sons (1947).
- [22] S. Y. BenZvi, B. M. Connolly and S. Westerhoff, arXiv:0711.3937 [astro-ph].
- [23] J. L. Han, R. N. Manchester, A. G. Lyne, G. J. Qiao and W. van Straten, Astrophys. J. 642, 868 (2006) [arXiv:astro-ph/0601357].
- [24] See for example http://www.skatelescope.org/.
- [25] D. Harari, S. Mollerach and E. Roulet, JCAP 0611, 012 (2006) [arXiv:astro-ph/0609294].
- [26] R. U. Abbasi et al., arXiv:0804.0382 [astro-ph].
- [27] D. S. Gorbunov, P. G. Tinyakov, I. I. Tkachev and S. V. Troitsky, arXiv:0804.1088 [astro-ph].
- [28] D. Nitz [Pierre Auger Collaboration], arXiv:0706.3940 [astro-ph].
- [29] K. Kotera and M. Lemoine, Phys. Rev. D 77, 123003 (2008) [arXiv:0801.1450 [astro-ph]].