Non-BCS behavior of optical properties across the cuprate phase diagram
Abstract
The finite-frequency optical properties of the underdoped cuprates, in both the normal and superconducting state, display features which go beyond a Fermi liquid and a BCS description. We provide an understanding of these properties within a simplified analytical model, which has been evolved out of the Hubbard model and ideas based on a resonating valence bond spin liquid. We find that: 1) in underdoped samples, the missing area integrals reveal a second energy scale due to the pseudogap, not present at optimum or overdoping; 2) the real part of the optical self-energy shows a large sharp peak, that emerges with the opening of the pseudogap which exists within the superconducting state and persists in the normal state; and 3) the amount of optical spectral weight which is transferred to the condensate is greatly reduced by the presence of the pseudogap as compared to the Fermi liquid case. These non-BCS features of the superconducting state are in good qualitative agreement with a body of experimental work on different cuprate systems and provide strong evidence from optical conductivity that they are all a manifestation of the pseudogap energy scale.
pacs:
74.72.-h,71.10.-w,78.20.BhUnderstanding the approach to a Mott insulator from a Fermi liquid state is an important question in correlated electron physics. The cuprate superconductors provide a model system for investigating this issue. Indeed, they exhibit non-Fermi liquid and non-BCS behavior throughout an intermediate doping regime between the Mott insulator and the Fermi liquid. In the overdoped regime, the normal state appears to be rather conventional, though the superconducting ground state has d-wave symmetry. By contrast, the underdoped regime exhibits non-Fermi liquid features related to the pseudogap formation, which is thought to be responsible for many of its anomalous normal state properties.timusk In addition, in this regime, there is evidence that the pseudogap and superconducting correlations compete and both provide their characteristic imprints on superconducting properties, such as the two separate energy scales seen in Raman scattering.tacon An important bulk probe of materials is finite-frequency optical conductivity for which a considerable quantity of data has accumulated about the cuprates as a function of doping and in different systems. From this it is clear that the optical properties display anomalous behavior which is non-Fermi liquid and non-BCS-like. This behaviour has not been fully understood from a theoretical point of view nor has it been brought together to provide a conclusive statement about the effect of a pseudogap energy scale in the superconducting state. In this commnication, we demonstrate that the non-BCS behavior can be understood as due to a second competing pseudogap energy scale within the superconducting state. We provide three results in comparison with experiment which support this significant conclusion.
While several approaches to the modeling of the unusual normal state of the cuprates have been proposed and examined, such as d-density waveschakravarty and phase incoherent preformed pairs above emery , few have been able to address successfully the superconducting state or the evolution of properties with doping. Work on the Hubbard (and related models), thought to be a good candidate for describing the cuprate phase diagram, has been largely numerical but recently some progress has been made towards providing analytic approximations to these works which can facilitate ease of calculation and provide a deeper understanding of the underlying physics. In order to examine the issue of the optical conductivity and its non-BCS behavior, we have chosen to adopt an analytical approach proposed by Yang, Rice and Zhangyrz which is evolved out of work that has its basis in the Hubbard modelkonik and the ideas of a resonant valence bond (RVB) spin liquid, proposed by Andersonanderson ; lee . The coherent part of the electronic Green’s function in this theory encodes the antiferromagnetic Brillouin zone with pseudogap formation, as the Mott transition is approached. We use this formalism to calculate the in-plane optical conductivity in order to provide an understanding of the anomalous superconducting behavior seen in quantities such as the partial optical sum and the optical self-energy.
In the analytical model used here, the coherent part of the electronic Green’s function takes the formyrz
| (1) |
with self-energy
| (2) |
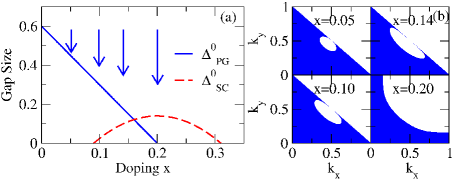
The pseudogap self-energy is given by . In these formulas is the relative weight of the coherent part of the Green’s function, which we set equal to one. There is also an incoherent piece not included here. The superconducting gap and pseudogap are both assumed to have d-wave symmetry, i.e. , within the two-dimensional square CuO2 Brillouin zone. The doping () dependence of their amplitude is given in Ref. yrz for a particular case and is reproduced here in Fig. 1a. Finally, is the electronic dispersion and the first-nearest-neighbor-only version, with defining the antiferromagnetic Brillouin zone. In Fig. 1b, we show the Luttinger surfaces of the theory for the parameters of Ref. yrz . The shaded blue areas correspond to occupied states containing an area proportional to and the white pockets within the first antiferromagnetic Brillouin zone enclose an area proportional to . To compute the in-plane optical conductivity one needs to know, in addition to the Green’s function, the Gorkov anomalous amplitude denoted by and given by
| (3) |
From these, the conductivity follows from the Kubo formula
| (4) |
where is the Fermi-Dirac distribution function at temperature , is the electron velocity, and the spectral functions are given as and . We present results at for the generic band structure and parameters suggested for cuprate systemsyrz .
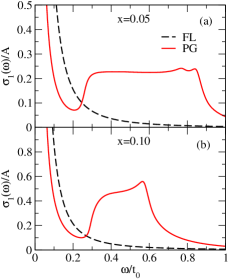
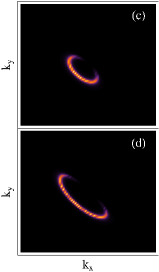
In Fig. 2, we show as a function of photon energy , where sets the energy scale of the first nearest neighbor hopping parameter. The normalization has been defined as the area under the conductivity curve in the normal state for (optimally doped). Fig. 2a is for (highly underdoped) and Fig. 2b is for , just inside the inner edge of the superconducting dome as shown in the phase diagram of Fig. 1a. In Fig. 2c and d, we plot the corresponding color maps of which provide information about the Fermi arcs as a function of doping. In Fig. 2a and b, the dashed black curves contain no pseudogap and are similar to a Drude form, while the solid red curves contain a finite . In all our calculations we have replaced the Dirac delta functions in the spectral densities and with Lorentzians of width . Twice this value gives the corresponding transport width . The solid red curves, in contrast to the dashed curves, deviate strongly from Drude behavior. The optical spectral weight in the Drude-like distribution centered at is greatly reduced, and some, but not all is transferred to the interband transition region.
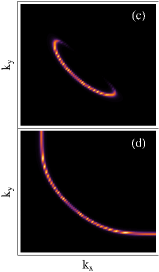
The onset of the region to which this weight is transferred, is close to for , but falls considerably short of for . The reason for this is that the gap value on the Luttinger pockets is much smaller than (see Fig. 2c). For both dopings, the rapid drop denoting the end of the interband region is located at approximately . These onset energies can be traced to peaks in the electronic density of states. Not all the optical spectral weight lost in the Drude region is recovered in the interband region at higher energies. We are dealing here only with the coherent part of the Green’s function. In a more complete theory some of the missing weight could be transferred from coherent to incoherent part. Similar to our result, a two-component optical conductivity has also been found in numerical workkotliar on the model.
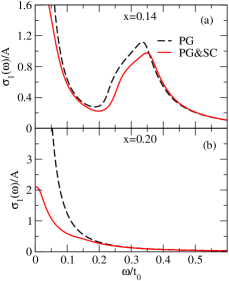
In Fig. 3 we compare the normal state (dashed black curve) with the corresponding superconducting state (solid red curve) for (a) and (b) . In this latter case, so that the corresponding Luttinger surface reduces to the usual large Fermi surface of Fermi liquid theory (Fig. 3d), and the real part of the conductivity, , in the superconducting state behaves in a conventional way. For an s-wave superconductor there would be a gap of in with all optical spectral weight below this energy going into the condensate and at higher energies, the normal state conductivity is recovered. However, here the gap has d-wave symmetry, and some weight remains in the Drude region below .ingrid Fig. 3a is more unusual because the pseudogap, which exists in the normal state, is responsible for depleting the Drude peak and transferring weight to the interband region. Adding superconductivity further depletes the Drude region below , although it does not eliminate it completely. In addition, and this goes beyond the BCS model, it shifts the onset of the interband transitions to higher energies. The differences between the cases with (frame (a)) and without (frame (b)) pseudogap are further emphasized in Fig. 4, where we show the real part of the conductivity for . The residual scattering rate is in both cases.
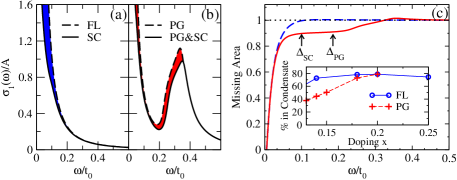
The shaded regions show the missing area under due to the superconducting transition. Frame (a) is conventional d-wave BCS behavior but frame (b) is anomalous. Comparing between (a) and (b), below , is not affected much by pseudogap formation because the remaining absorption (Drude) only involves the nodal direction. However, in this energy region is much larger in (a) than it is in (b) because in this latter case the antinodal direction is gapped out with its spectral weight transferred to the interband transitions. Note that this interband piece contains about 20% of the condensate. This is further elaborated upon in (c) where we show results for the missing area partial optical sum The dashed blue curve is without, while the solid red curve is with a pseudogap. Pseudogap and superconducting energy gap scales are indicated by arrows. The dashed blue curve, normalized to , rises rapidly to its saturation value on the scale of the superconducting gap for the particular residual scattering rate used (a quantity also involved in determining the rate of initial rise). For the solid red curve, this first rise is also clearly visible but in addition there is a second region of slower rise on an energy scale set by the pseudogap which involves about 20% of the condensate. This behavior has been qualitatively verified in the experimental work of Homes et al.homesprb for YBa2Cu3O6.95 (no pseudogap) and YBa2Cu3O6.60 (with pseudogap) [see Fig. 7 of Ref. homesprb ]. A quantative comparison is not possible because in the analysis of the experimental data, the normal state at low temperature is not available and its value just above is used instead. Still the pseudogap scale is seen only in the underdoped case.
In the inset of Fig. 4c, we show the fraction of the total available optical spectral weight that goes into the condensate as a function of doping. For an ordinary s-wave BCS superconductor this amount would be 100% in the clean limit, , as it would also be for a d-wave gap. The entire optical spectral weight condenses and the zero temperature penetration depth depends only on normal state parameters and not on the value of the gap. For finite this no longer holds and the amount in the condensate is reduced with the reduction depending on the relative size of to . However, when a pseudogap is introduced, the condensate fraction is further reduced. This can be traced to the transfer of spectral weight from the Drude to the region above where it is not as susceptible to condensation. Note in particular the points at . The open circle without pseudogap is close to 70% while the opening of a pseudogap reduces this value to roughly 40%, less than half the electrons participate in the condensation. This is an important result associated with the non-BCS behavior of this theory and for which there is experimental evidence.tanner
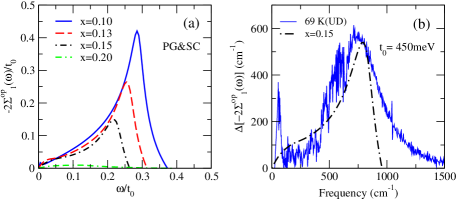
Finally in Fig. 5, we present our results for the real part of the optical self-energy . It has become common in correlated systems to describe the conductivity in terms of a generalized Drude formopqp with , where is the plasma frequency. For the identification of the pseudogap in in-plane optics it was recently found that is a more useful quantityhwanghat than is the conductivity itself, and it shows a prominent “hat”-like structure seen above a large inelastic background. Prominent peaks in can arise from either pseudogap or superconducting gap formationhwang05 ; bi2212opt when the inelastic scattering, described by the incoherent part of the Green’s function, involves sharp boson structure on the same energy scale. In the present work such structures arise even though inelastic scattering is not accounted for. While it is not clear exactly how to separate coherent and incoherent contributions, Hwang et al.bi2212opt have removed a background from their data presented in their Fig. 19 for the Bi2Sr2CaCu2O8+δ (Bi2212) series. The results of our calculations, which are shown in Fig. 5a for various values of doping , are best compared with these data for one of the most underdoped samples studied with K, reproduced in Fig. 5b (solid blue curve). Pseudogap effects are large in this case and dominate the peak formation, which is also hardly affected by superconductivity in both experiment and theory. Taking meV and , the black dot-dashed curve is reproduced in Fig. 5b. The agreement with data is reasonable particularly as we have not used parameters specific to Bi2212 but instead stayed with those for Ca2-xNaxCuO2Cl2 given in Ref. yrz . The subtraction of the incoherent contribution to may also be responsible for some of the discrepancies seen beyond cm-1. As stated the peaks of Fig. 5a are greatly reduced with increasing doping, a trend confirmed in the normal state experimental data.
In summary, we have been able to explain three major anomalous experimental observations from finite-frequency optical conductivity measurements on several different cuprate systems where non-BCS behavior is exhibited as a function of doping. Such non-BCS behavior is understood in our work to result from a pseudogap-type energy scale present in the normal state which also manifests itself within the superconducting state. Comparison of our theoretical results with optical data in the Bi2212 series reveals good qualitative agreement for the evolution with doping of both position in energy and size of the normal state “hat”-like structures seen in the real part of the optical self-energy. In addition, the partial optical sum reveals that a second energy scale related to the pseudogap exists in underdoped samples and is not present in optimally or overdoped samples, as seen in the data of Homes et alhomesprb for YBa2Cu3O7-δ. Another significant result of our analysis is that the opening of a pseudogap greatly reduces the percentage of carriers that condense in the superconducting state as compared to BCS. We stress that optical conductivity is a bulk probe applicable to many cuprate systems, as opposed to surface probes such as scanning tunneling and angle-resolved photoemission spectroscopies which are mainly limited to the Bi2212 system. Consequently our analysis provides strong support that the observed non-BCS behaviors seen in several cuprate systems and their doping dependence can be described via a theory, such as we have used here, based in the Hubbard model and ideas of a RVB spin liquid.
We thank J. Hwang for supplying us with his data and I. Vekhter for his comments. This work has been supported by the Natural Sciences and Engineering Research Council of Canada (NSERC) and the Canadian Institute for Advanced Research (CIFAR).
References
- (1) T. Timusk and B. Statt, Rep. Prog. Phys. 62, 61 (1999).
- (2) M. Le Tacon, A. Sacuto, A. Georges, G. Kotliar, Y. Gallois, D. Colson, and A. Forget, Nature Phys. 2, 537 (2006).
- (3) S. Chakravarty, R. B. Laughlin, D. K. Morr, and C. Nayak, Phys. Rev. B 63, 094503 (2001); L. Benfatto, S. Caprara and C. Di Castro, Eur. Phys. J B 17, 95 (2000).
- (4) V. J. Emery and S. A. Kivelson, Nature (London) 374, 434 (1995).
- (5) K.-Y. Yang, T. M. Rice and F. C. Zhang Phys. Rev. B 73, 174501 (2006); B. Valenzuela and E. Bascones, Phys. Rev. Lett. 98, 227002 (2007); and since completion of our work: K.-Y. Yang, H. B. Yang, P.D. Johnson, T. M. Rice and F. C. Zhang, arXiv:0812.3045v2.
- (6) R. M. Konik, T. M. Rice, and A. M. Tsvelik, Phys. Rev. Lett. 96, 086407 (2006).
- (7) P. W. Anderson, Science 235, 1196 (1987).
- (8) P. A. Lee, N. Nagaoka, and X.-G. Wen, Rev. Mod. Phys. 78, 17 (2006).
- (9) K. Haule and G. Kotliar, Phys. Rev. B 76, 104509 (2007).
- (10) I. Schürrer, E. Schachinger, and J. P. Carbotte, Physica C 303, 287 (1998).
- (11) C. C. Homes, S. V. Dordevic, D. A. Bonn, Ruixing Liang, W. N. Hardy, Phys. Rev. B 69, 024514 (2004).
- (12) H. L. Liu, M. A. Quijada, A. M. Zibold, Y.-D. Yoon, D. B. Tanner, G. Cao, J. E. Crow, H. Berger, G. Margaritondo, L. Forró, Beom-Hoan O, J. T. Markert, R. J. Kelly, and M. Onellion, J. Phys. Condens. Matter 11, 239 (1999).
- (13) J. Hwang, E. J. Nicol, T. Timusk, A. Knigavko, and J. P. Carbotte, Phys. Rev. Lett. 98, 207002 (2007); T. Mori, E.J. Nicol, S. Shiizuka, K. Kuniyasu, T. Nojima, N. Toyota and J.P. Carbotte, Phys. Rev. B 77, 174515 (2008).
- (14) J. Hwang, J. P. Carbotte, and T. Timusk, Phys. Rev. Lett. 100, 177005 (2008).
- (15) J. P. Carbotte, E. Schachinger and J. Hwang, Phys. Rev. B 71, 054506 (2005).
- (16) J. Hwang, T. Timusk, and G. D. Gu, J. Phys. Condens. Matter 19, 125208 (2007).