Quantifying Finite Temperature Effects in Atom Chip Interferometry
of Bose-Einstein Condensates
Abstract
We quantify the effect of phase fluctuations on atom chip interferometry of Bose-Einstein condensates. At very low temperatures, we observe small phase fluctuations, created by mean-field depletion, and a resonant production of vortices when the two clouds are initially in anti-phase. At higher temperatures, we show that the thermal occupation of Bogoliubov modes makes vortex production vary smoothly with the initial relative phase difference between the two atom clouds. We also propose a technique to observe vortex formation directly by creating a weak link between the two clouds. The position and direction of circulation of the vortices is subsequently revealed by kinks in the interference fringes produced when the two clouds expand into one another. This procedure may be exploited for precise force measurement or motion detection.
pacs:
03.75.Kk, 03.75.LmI Introduction
Recent experiments Jo et al. (2007a) have demonstrated the ability to read out the initial relative phase of two Bose-Einstein condensates (BECs) that are subsequently merged on an atom chip Hinds and Hughes (1999); Folman et al. (2000); Reichel (2002); Fortágh and Zimmermann (2007); Schumm et al. (2005). In these experiments, is inferred by measuring its effect on the size of the cloud after free expansion. Theoretical work Scott et al. (2008) explained these findings in terms of the resonant production of a black soliton (or -state) when Scott et al. (2008); Negretti and Henkel (2004); Ichihara et al. (2008). The soliton is unstable, and hence decays via the excitation of stable vortices Scott et al. (2003, 2004, 2005). Analysis of this mechanism highlighted the potential for exploiting the resonance to develop motion detectors Scott et al. (2008), or sensors that could be used to measure weak forces due to gravity, electric, or magnetic fields. The analysis also showed that at finite temperatures, the resonance becomes sufficiently broadened that the number of vortices produced by the merger varies smoothly with , so that all values of can, in principle, be detected. However, the calculations were unable to ascribe specific temperature values to the different behavioral regimes of the interferometer, nor did they account for the zero-temperature mean-field depletion. Consequently, they did not reveal the limits of the interferometer’s sensitivity, nor the temperatures required to achieve precision measurement. Moreover, the proposal for motion detection lacked a mechanism to detect the underlying production of vortices. Further theoretical work is now required to explore the effect of finite temperature on atom-chip interferometry and identify an appropriate read-out protocol for vortex production and motion detection.
The atom clouds in chip traps are typically highly elongated, and can therefore be used to explore a one-dimensional regime, in which and are both less than , where is the temperature of the cloud, is its chemical potential, and is the radial (high) trapping frequency Hofferberth et al. (2007, 2008). For the parameters considered in this paper, and in previous related experiments Jo et al. (2007a), this condition is not satisfied because . This means that radial excitation of the cloud, namely soliton and vortex production, can occur. By varying , we may access different regimes of phase coherence. Global phase coherence in elongated clouds only exists below a characteristic temperature Petrov et al. (2001); Gerbier et al. (2003), which may be much less than the BEC transition temperature . At temperatures below , but not below Petrov et al. (2001); Gerbier et al. (2003), there exists a “quasicondensate” regime, where the phase coherence length is less than the axial length of the atom cloud. The temperature is zero for uniform one-dimensional Bose gases, and increases as the axial length decreases. For interferometry purposes, we require that , so that there is global phase coherence and, as a result, is well-defined. However, even at such temperatures, which are the focus of this paper, we find that low-energy thermal excitations along the axial direction still play a crucial role in the function of the interferometer.
In this paper, we present detailed calculations, which now enable us accurately to characterize the behavior of the interferometer as a function of . This is done by developing a finite temperature truncated Wigner method Ruostekoski and Isella (2005); Isella and Ruostekoski (2005), which includes thermal fluctuations through the excitation of Bogoliubov modes. When , the phase fluctuations are set by the zero-temperature mean-field depletion of the condensate. We show that these fluctuations are small () for the parameters used in the experiment Jo et al. (2007a), and hence the resonant production of vortices is sharply peaked around . Consequently, this type of atom interferometer could be exploited to precisely detect when , which is potentially useful for the measurement of motion, small forces, and spatially-varying phase profiles. We show that for larger , comparable to, yet still below, , global phase coherence is preserved, but axial thermal phase fluctuations are significant. This causes vortex production to vary more smoothly with , thus creating a sensor capable of detecting all values of . For the parameters used in the experiment Jo et al. (2007a), this behavioral regime occurs when nK.
We also propose a technique to detect vortex production directly by performing a partial merge of the atom clouds. This method works by establishing a weak link between the two BECs, which is a topic of broad interest due to its implications for Josephson oscillations, the Sine-Gordon equation, and questions of coherence Bouchoule (2005); DeGrandi et al. (2008); Hofferberth et al. (2007); Whitlock and Bouchoule (2003). The partial merge allows vortices to form in the region of low density between the two BECs. Presence of vortices is then detected after expansion by the appearance of abrupt kinks in the interference fringes, which not only map out vortex production along the cloud, but also provide a mechanism to read out the relative velocity of the two BECs, acting as a motion detector.
The paper is organized as follows. In section II we describe the system and explain our theoretical model. In section III we explore the operation of the interferometer as a function of . In section IV we discuss the partial merge technique and possible applications in motion sensing. In section V we summarize our findings and conclude.
II System and methodology
In the experiments Jo et al. (2007a), a 23Na BEC containing atoms is prepared in an atom chip trap, then split equally into two clouds. We assume that the splitting process is carried out adiabatically, and hence construct two finite initial states foo (a), each containing atoms, for every simulation. We believe this to be a reasonable assumption because the split was carried out over 75 ms in the experiment Jo et al. (2007a).
The trap frequencies in the axial and radial directions are rad s-1 and rad s-1 respectively, creating two clouds of peak density m-3 at in the double-well potential. For these parameters, nK Petrov et al. (2001); Gerbier et al. (2003), where Hz is the chemical potential.
Many models of cold atom clouds have been developed, and each have strengths and weaknesses, meaning that they perform well under different conditions Blakie et al. (2008); Proukakis and Jackson (2008). For example, the traditional zero truncated Wigner method Steel et al. (1998); Sinatra et al. (2001), because of its inclusion of quantum noise, has been very successful in describing spontaneous processes like the formation of scattering halos Scott et al. (2006), or the suppression of Cherenkov radiation Scott and Hutchinson (2008). However, in this study, we must simulate the thermal excitations of elongated atom clouds, which are long-wavelength axial sound-like modes, requiring a finite approach. Firstly, we note that this atom chip system is well-suited to classical-field methods Blakie et al. (2008); Proukakis and Jackson (2008), which include low-energy modes that have an occupation much larger than one particle. Since the modes are highly Bose-degenerate, the matter-wave field behaves much like a classical field. It is therefore valid to model the condensate plus the low-energy excited modes within a Gross-Pitaevskii formalism, which propagates a classical field, and, consequently, can describe all classical aspects of a finite BEC. Secondly, a stochastic approach is appropriate to capture the thermal fluctuations. As a result of these two requirements, three possible methods are: the projected Gross-Pitaevskii equation Blakie and Davis (2005); Weiler et al. (2008), the stochastic Gross-Pitaevskii equation Stoof (1997), or the finite truncated Wigner method Ruostekoski and Isella (2005); Isella and Ruostekoski (2005). All three of these methods are, in principle, applicable. However, they differ in that the projected Gross-Pitaevskii equation and the stochastic Gross-Pitaevskii equation treat all fluctuations thermally in equilibrium, whilst thermal and quantum fluctuations are added explicitly in the finite truncated Wigner method. This means that the finite truncated Wigner method describes the atom cloud well at the low temperatures suitable for performing interferometry. In addition, it can predict the limits of the interferometer sensitivity at (discussed in section III.1). For these reasons, we use the finite truncated Wigner method in this study.
In this paper, we consider only the axial excitations of the BEC, and neglect radial excitations. This approximation is valid if the mean thermal occupation of the first excited state in the radial direction , where
| (1) |
in which is the energy of the first excited radial mode. This condition is satisfied provided
| (2) |
In this paper, we explore the temperature range nK, where inequality 2 is satisfied.
In order to construct the finite state, we first solve the three-dimensional Gross-Pitaevskii equation to obtain the initial density profile of the condensate mode , using the coordinates defined in Fig. 1(a). The low-energy axial excitations are then calculated by solving the one-dimensional Bogoliubov-de Gennes equations
| (3) |
and
| (4) |
where
| (5) |
and , in which is the energy of the Bogoliubov mode, is the mass of a single 23Na atom, and nm is the s-wave scattering length. Since Eqs. 3 and 4 are one-dimensional, the eigenvalue does not include the contribution from the radial kinetic energy, which we calculate as J from the Gross-Pitaevskii equation. Consequently the true eigenvalue of the Bogoliubov mode is .
We find that the low-energy Bogoliubov modes are long-wavelength, phonon-like excitations. This implies that the use of plane-wave noise to model a finite BEC in a previous study Scott et al. (2008) was a reasonable approximate method. However, the use of plane-wave noise meant that, in contrast to the present work, the temperature of the BEC could not be specified.
The Bogoliubov mode is defined as
| (6) |
where
| (7) |
and is a random complex number such that
| (8) |
in which
| (9) |
is the mean thermal occupation of the mode. The in Eq. 8 describes the zero mean-field depletion of the BEC, and the quantum vacuum fluctuations Scott et al. (2006). The finite initial state is then constructed as
| (10) |
This is a finite-temperature truncated Wigner method Ruostekoski and Isella (2005); Isella and Ruostekoski (2005).
We must choose a value at which we truncate the summation in Eq. 10. As increases, decreases, meaning that and, consequently, the average excitation occupation also decreases. In this paper we neglect quantum vacuum fluctuations Scott et al. (2006), since a previous study has shown them to have no effect in this system Scott et al. (2008). Consequently, we stop adding noise once the average excitation occupation drops below one atom.
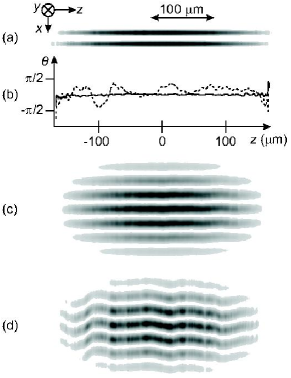
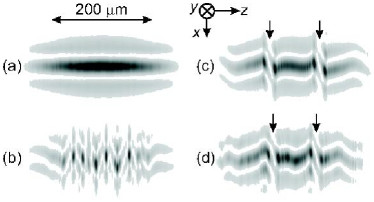
In our simulations, at time the two finite initial states are at rest in a double-well potential foo (a), which has minima at m [Fig. 1(a)]. In Fig. 1(b), we characterize the initial phase fluctuations by plotting typical phase profiles along one BEC’s axis of cylindrical symmetry, for (solid curve) and nK (dashed curve). The phase fluctuations at are due to mean-field depletion of the condensate, and are very small in amplitude (), except at the very edges of the BEC where the atom density is low. The phase fluctuations in the BEC at 90 nK are much larger, typically in the centre of the BEC, but approaching at the extremities. Phase fluctuations of amplitude in each BEC implies a potential relative phase fluctuation of if the local fluctuations in each BEC are of opposite sign, sufficient to switch the system to and from resonance (vortex production at ) and anti-resonance ().
In this paper, we consider three distinct recombination procedures, which generate different dynamics. In this section, we focus on the first of these procedures, henceforth called Process A. We introduce Processes B and C in Sections III and IV respectively.
In Process A, we abruptly release the two BECs from the double-well potential at , and allow them to expand into one other for 8 ms. The resulting interference patterns enable us to relate the phase fluctuations to an experimentally observable effect, specifically the modulation of the fringe positions Jo et al. (2007b). Figure 1(c) shows interference fringes produced, for , by Process A. The fringes are almost straight and at all points parallel to the axial () direction, indicating that the relative phase is approximately constant and the phase fluctuations are small (). In contrast, at nK [Fig. 1(d)] the position of the density nodes and anti-nodes varies along , so that the fringes have an undulating appearance, particularly at the extremities of the cloud where the density is low. The interference pattern in Fig. 1(d) is similar to that shown in experiment Jo et al. (2007b), with comparable variations in fringe positions, suggesting that the temperature of the BEC used in the experiments is nK.
III Production of vortices
In this section, as in experiment Jo et al. (2007a), we merge the two BECs by smoothly transforming the double-well potential into a single-well potential. This merging procedure is referred to as Process B. The operation is performed over 5 ms, since experiments Jo et al. (2007a) and our previous theoretical studies Scott et al. (2008) have shown this to be a suitable timescale to observe vortex formation. However, the merging time is not crucial as similar dynamics occur over a wide range of merging times from to ms. Different behavioral regimes may accessed by selecting merging times outside these limits Scott et al. (2008). We now analyze how the dynamics change with temperature.
III.1 Zero temperature dynamics
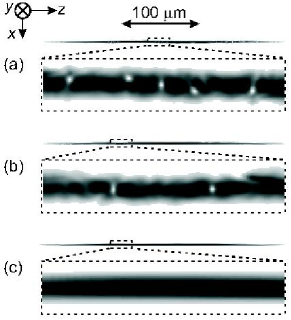
Firstly, we reproduce the resonant production of vortices at reported in Ref. Scott et al. (2008), by smoothly merging the two BECs via Process B. Figure 2(a) shows a typical merged cloud at ms, for . Vortices have been created along the entire length of the cloud. Five of these can be seen as low density (white) spots within the central region shown enlarged within the lower dashed box. When is reduced to , vortices are still present, but they are now concentrated towards the extremities of the cloud, as shown Fig. 2(b). This behavior occurs because the phase fluctuations are larger at the extremities of the cloud [see Fig. 1(b)] and, consequently, the -state may be formed locally, if the phase fluctuations in each BEC combine to create a net relative phase fluctuation exceeding . However, when we reduce to [Fig. 2(c)], no vortices are produced at any point in the cloud. This is because, as shown in Fig. 1(b) (solid curve), the phase fluctuations are of order in this elongated geometry at . Hence we determine the limits of the sensitivity of this interferometry mechanism: for the parameters used in the experiments Jo et al. (2007a), the resonant production of vortices at requires that .
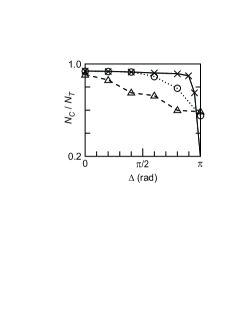
As shown in our previous study Scott et al. (2008), the vortices are described by high momentum plane-wave modes, so their production can be detected by observing a broadening in momentum space. This increased width in momentum space drives an enhanced spreading of the merged cloud when released from trapping potential, as detected experimentally Jo et al. (2007a). We quantify this effect by integrating the atom density of the merged cloud along the and directions [see Fig. 1 for axes], then calculating the one-dimensional Fourier power spectrum, . We then define the quantity , which is the number of atoms in the merged cloud with m-1 Scott et al. (2008), or, equivalently, the number of atoms in the merged cloud moving at speeds less than 0.2 mm s-1 in the direction foo (b). The solid curve in Fig. 3 shows plotted as a function of . When , no vortices are produced in the merged cloud, so the BEC has a low internal kinetic energy, and, consequently, . However, when , the merged cloud contains many vortices. As a result, the BEC has a much larger internal kinetic energy, and hence . The dramatic drop in when approaches indicates the sharp resonant excitation of the cloud due to the formation of vortices.
III.2 Dynamics at finite temperature
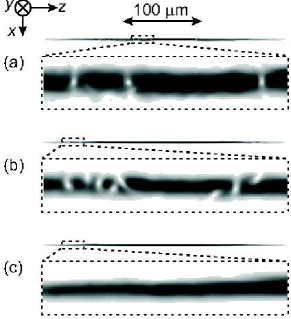
We now increase to 60 nK. Again we find vortex production for , as shown in Fig. 4(a). Vortices form along the entire length of the cloud, and three of these are shown in the enlargement of the region contained within the small dashed rectangle near the center of the cloud. However, as is reduced the number of vortices in the merged cloud decreases much more gradually than for . Even when , vortex formation still persists near the edges of the BEC where the fluctuations are largest [Fig. 4(b)]. Vortex formation is finally suppressed when is reduced to [Fig. 4(c)].
We quantify this smoothing of the resonance in Fig. 3. Since the thermal fluctuations are random, and change from one simulation to another, the number of vortices produced at each value of also changes between simulations. Therefore, we perform the merger five times at each value of with different initial thermal fluctuations, then calculate the mean value of , in order to obtain an averaged result. The dotted curve in Fig. 3 shows how the averaged varies with at nK. The curve reveals that the resonance has been significantly broadened compared to the curve (solid), meaning that, when nK, there is significant excitation of the cloud even for as small as . We also note that the range of has been reduced, indicating that this effect will become more difficult to detect as increases.
Finally, we increase to 90 nK. At this temperature we find that varies smoothly with (see the dashed curve in Fig. 3), and we note that the variation in is again reduced. As approaches nK, this variation continues to decrease, until is independent of at . These results are consistent with the findings of a recent experiment Jo et al. (2007a), which reported a gradual increase in the size of the cloud, after expansion, as approached . The calculations of presented in Fig. 3 suggest that the BEC in the experiment was at nK.
IV Direct detection of vortices
Previous experiments detected the excitation of the BEC by measuring the size of the merged cloud after a free expansion. Excitation was inferred by counting atoms beyond the expanded Thomas-Fermi radius. In order to develop BEC-based atom interferometers as working sensors (see, for example, Refs. Jo et al. (2007a); Scott et al. (2008); Cronin et al. (2008); Estève et al. (2008)), it would be desirable to have a more direct mechanism for detecting vortex production. This is essential for the development of such atom interferometers for motion detection, as suggested in a previous study Scott et al. (2008).
We find that direct detection of vortex formation can be achieved by performing a partial merge, which we refer to as Process C, such that a weak link is created between the two clouds. To achieve this, in our calculations the full merge from the double-well to single-well potential is halted at ms, when the two wells are separated by 3.5 m. The BEC is then held for a further 1.9 ms. Under these conditions, the black soliton may still form, and produce vortices in the low density region between the density peaks located at the two minima of the potential Parke et al. (2008). The advantage of the partial merge is that the two peaks in density may still create interference fringes, albeit with a reduced contrast, as they expand rapidly into one another, 8 ms after release from the trapping potential. The presence of vortices will then be revealed as abrupt kinks in the interference pattern, which have been used to detect the formation of vortices in quasi-two-dimensional BECs Stock et al. (2005).
We initially study this procedure for , at . The resulting expanded cloud is shown in Fig. 5(a). As expected, the two BECs combine to form a cloud with a smooth density profile, and no vortices are formed during the merger. Consequently, the expanded cloud is a simple low-contrast interference pattern.
We now repeat the calculation for . In this case, many vortices form between the two merging BECs. As a result, when the cloud is released from the potential, the interference pattern contains many abrupt kinks [shown in Fig. 5(b)], indicating the position of each vortex. At , so many vortices are produced that the expanded cloud is barely recognisable as an interference pattern. We note that the disruption is limited to the central section of the interference pattern. This is because the weak link is not formed at the extremities of the cloud, where the two initial BECs have a narrower radial width.
This procedure provides a mechanism to detect relative motion of the BECs, possibly in response to a weak force. We consider an example in which the BEC at larger has an initial velocity mm s-1 in the direction. We set the initial phase of the second BEC, at smaller , to be uniformly zero, meaning that . When we perform the partial merge and expansion, we observe two kinks in the final interference pattern [arrowed in Fig. 5(c)], at positions m, where . By measuring the distance, , between these kinks, the initial relative speed of the BECs follows directly from . Furthermore, the orientation of the kink, namely whether it is a displacement in the positive or negative direction, indicates the rotation of the vortex, which in turn indicates the direction of before merging. In Fig. 5(c), both kinks are displacements in the positive direction, indicating abrupt rotations of caused by vortices circulating in an anticlockwise direction. As shown in a previous study Scott et al. (2008), anticlockwise rotation in the plane infers positive , and hence a positive .
This technique is robust to the inclusion of thermal phase fluctuations. To illustrate this, we repeat the above calculation at nK, and present a typical result in Fig. 5(d). Again we see two kinks in the interference pattern at m, although there are some small variations in fringe position compared to the result in Fig. 5(c), particularly at the extremities of the cloud where the phase fluctuations are most significant. At temperatures nK, larger phase fluctuations cause several vortices to be created in extended regions around the two positions m. Motion detection is still possible in this regime, but averaging over many absorption images may be necessary to obtain accurate results.
V Conclusions
Atom chips are a versatile tool which provide the fine control of the splitting and merging of atom clouds required for matter-wave interferometry Jo et al. (2007a); Günther et al. (2005, 2007); Judd et al. (2008). However, the very elongated geometries that they typically produce have both advantages and disadvantages. A large axial () length is desirable because it provides natural averaging over any small fluctuations in the trap potentials, the force to be measured, or thermal fluctuations within the BEC. Consequently, the sensitivity can, in some interferometric schemes, be increased by integrating the atom density along the axial direction. Furthermore, elongated clouds are, in principle, sensitive to very weak forces, which create small phase gradients.
In this paper, we have explored the effect of the elongated geometry on chip-based interferometry by making realistic calculations of the excited states, thus enabling the effect of finite on the action of the interferometer to be quantified. We have shown that finite effects are particularly important for elongated BECs due to the low energy of the axial modes. Consequently, BECs in chip traps allow the initial relative phase of the atom clouds to be measured over a wide range, owing to the thermal broadening of the resonant production of vortices. It remains a challenge for experimentalists to achieve temperatures where the resonance is sharp, and exploit it, either for precise force measurement or motion detection. This regime may be accessed by reducing the aspect ratio, but at the expense of losing the advantages of elongated clouds.
Acknowledgements.
This work is funded by EPSRC, the AFOSR through project AOARD-094016, and by the Government of New Zealand through the Foundation for Research, Science and Technology under New Economy Research Fund contract NERF-UOOX0703. We thank J. Ruostekoski and A.D. Martin for helpful discussions.References
- Jo et al. (2007a) G.-B. Jo, J.-H. Choi, C. A. Christensen, T. A. Pasquini, Y.-R. Lee, W. Ketterle, and D. E. Pritchard, Phys. Rev. Lett. 98, 180401 (2007a).
- Hinds and Hughes (1999) E. A. Hinds and I. G. Hughes, J. Phys. D 32, R119 (1999).
- Folman et al. (2000) R. Folman, P. Krüger, D. Cassettari, B. Hessmo, T.Maier, and J. Schmiedmayer, Phys. Rev. Lett. 84, 4749 (2000).
- Reichel (2002) J. Reichel, Appl. Phys. B 75, 469 (2002).
- Fortágh and Zimmermann (2007) J. Fortágh and C. Zimmermann, Rev. Mod. Phys. 79, 235 (2007).
- Schumm et al. (2005) T. Schumm, S. Hofferberth, L. M. Andersson, S. Wildermuth, S. Groth, I. Bar-Joseph, J. Schmiedmayer, and P. Krüger, Nature Physics 1, 57 (2005).
- Scott et al. (2008) R. G. Scott, T. E. Judd, and T. M. Fromhold, Phys. Rev. Lett. 100, 100402 (2008).
- Negretti and Henkel (2004) A. Negretti and C. Henkel, J. Phys. B. 37, L385 (2004).
- Ichihara et al. (2008) R. Ichihara, I. Danshita, and T. Nikuni, Phys. Rev. A. 78, 063604 (2008).
- Scott et al. (2003) R. G. Scott, A. M. Martin, T. M. Fromhold, S. Bujkiewicz, F. W. Sheard, and M. Leadbeater, Phys. Rev. Lett 90, 110404 (2003).
- Scott et al. (2004) R. G. Scott, A. M. Martin, S. Bujkiewicz, T. M. Fromhold, N. Malossi, O. Morsch, M. Cristiani, and E. Arimondo, Phys. Rev. A 69, 033605 (2004).
- Scott et al. (2005) R. G. Scott, A. M. Martin, T. M. Fromhold, and F. W. Sheard, Phys. Rev. Lett 95, 073201 (2005).
- Hofferberth et al. (2007) S. Hofferberth, I. Lesanovsky, B. Fischer, T. Schumm, and J. Schmiedmayer, Nature 449, 324 (2007).
- Hofferberth et al. (2008) S. Hofferberth, I. Lesanovsky, T. Schumm, A. Imambekov, V. Gritsev, E. Demler, and J. Schmiedmayer, Nature Physics 4, 489 (2008).
- Petrov et al. (2001) D. S. Petrov, G. V. Shlyapnikov, and J. T. M. Walraven, Phys. Rev. Lett. 87, 050404 (2001).
- Gerbier et al. (2003) F. Gerbier, J. H. Thywissen, S. Richard, M. Hugbart, P. Bouyer, and A. Aspect, Phys. Rev. A. 67, 051602(R) (2003).
- Ruostekoski and Isella (2005) J. Ruostekoski and L. Isella, Phys. Rev. Lett. 95, 110403 (2005).
- Isella and Ruostekoski (2005) L. Isella and J. Ruostekoski, Phys. Rev. A. 72, 011601(R) (2005).
- Bouchoule (2005) I. Bouchoule, Eur. Phys. J. D. 35, 147 (2005).
- DeGrandi et al. (2008) C. DeGrandi, R. A. Barankov, and A. Polkovnikov, Phys. Rev. Lett. 101, 230402 (2008).
- Whitlock and Bouchoule (2003) N. K. Whitlock and I. Bouchoule, Phys. Rev. A. 68, 053609 (2003).
- foo (a) It should be noted that in the experiment temperature was measured before splitting, whilst we define temperature after splitting. There may be significant cooling due to the splitting process, during which the volume of the BEC approximately doubles, and hence the energy approximately halves.
- Blakie et al. (2008) P. B. Blakie, A. S. Bradley, M. J. Davis, R. J. Ballagh, and C. W. Gardiner, Advances in Physics 57, 363 (2008).
- Proukakis and Jackson (2008) N. P. Proukakis and B. Jackson, J. Phys. B. 41, 203002 (2008).
- Steel et al. (1998) M. J. Steel, M. K. Olsen, L. I. Plimak, P. D. Drummond, S. M. Tan, M. J. Collett, D. F. Walls, and R. Graham, Phys. Rev. A 58, 4824 (1998).
- Sinatra et al. (2001) A. Sinatra, C. Lobo, and Y. Castin, Phys. Rev. Lett. 87, 210404 (2001).
- Scott et al. (2006) R. G. Scott, D. A. W. Hutchinson, and C. W. Gardiner, Phys. Rev. A. 74, 053605 (2006).
- Scott and Hutchinson (2008) R. G. Scott and D. A. W. Hutchinson, Phys. Rev. A. 78, 063614 (2008).
- Blakie and Davis (2005) P. B. Blakie and M. J. Davis, Phys. Rev. A. 72, 063608 (2005).
- Weiler et al. (2008) C. N. Weiler, T. W. Neely, D. R. Scherer, A. S. Bradley, M. J. Davis, and B. P. Anderson, Nature 455, 948 (2008).
- Stoof (1997) H. T. C. Stoof, Phys. Rev. Lett. 78, 768 (1997).
- Jo et al. (2007b) G.-B. Jo, J.-H. Choi, C. A. Christensen, Y.-R. Lee, T. A. Pasquini, W. Ketterle, and D. E. Pritchard, Phys. Rev. Lett. 99, 240406 (2007b).
- foo (b) As the vortices are approximately cylindrically symmetrical along the -direction, their associated Fourier components are almost identical in the - and -directions.
- Cronin et al. (2008) A. D. Cronin, J. Schmiedmayer, and D. E. Pritchard, ArXiv:0712.3703 (2008).
- Estève et al. (2008) J. Estève, C. Gross, A. Weller, S. Giovanazzi, and M. K. Oberthaler, Nature 455, 1216 (2008).
- Parke et al. (2008) M. I. Parke, N. K. Wilkin, J. M. F. Gunn, and A. Bourne, Phys. Rev. Lett. 101, 110401 (2008).
- Stock et al. (2005) S. Stock, Z. Hadzibabic, B. Battelier, M. Cheneau, and J. Dalibard, Phys. Rev. Lett. 95, 190403 (2005).
- Günther et al. (2005) A. Günther, S. Kraft, M. Kemmler, D. Koelle, R. Kleiner, C. Zimmermann, and J. Fortágh, Phys. Rev. Lett. 95, 170405 (2005).
- Günther et al. (2007) A. Günther, S. Kraft, C. Zimmermann, and J. Fortágh, Phys. Rev. Lett. 98, 140403 (2007).
- Judd et al. (2008) T. E. Judd, R. G. Scott, and T. M. Fromhold, Phys. Rev. A. 78, 053623 (2008).