Spin Determination via Third Generation Cascade Decays
Abstract
Once new particles are discovered at the LHC and their masses are measured, it will be of crucial importance to determine their spin, in order to identify the underlying new physics model. We investigate the method first suggested by Barr and later extended by others to distinguish between Supersymmetry and alternative models, e.g. Universal Extra Dimensions, in a certain cascade decay. This method uses invariant mass distributions of the outgoing Standard Model particles to measure the spin of intermediate particles, by exploiting the quark/anti-quark asymmetry of the LHC as a collider, which is limited for first generation quarks. In this work, we suggest instead to measure the charge of the outgoing quark, in case it is a third generation quark. The resulting asymmetry for a bottom quark is similar to the previous method, while it is independent of hadronic uncertainties. Furthermore, for a top quark, the asymmetry allows better distinction between the models, as demonstrated by a quantitative analysis of model discrimination. We also show that the top’s decay products can be used instead of the top itself, when the reconstruction of the top momentum is difficult to accomplish, and still provide information about the spin.
1 Introduction
The Large Hadron Collider (LHC), which has already started and will resume operating soon, is expected to unveil new physics at the TeV scale. If we assume that the underlying new physics is weakly coupled at the TeV scale, and also assume the naturalness paradigm for the light Higgs, then we expect that there will be new particle sectors in order to cancel quadratic divergencies appearing in the Standard Model (SM) loop contributions to the Higgs mass. In particular, since the largest contribution arises from loop involving top quark, we expect that there will be a new particle (often called top-partner) cancelling the divergence from the top. Since the top and the bottom are in the same SU(2) multiplet, it is interesting to look for new physics partners for third generation quarks.
The most well-known example is low energy Supersymmetry (SUSY), where the quadratic divergence is cancelled by its scalar partner, with its spin differing by . On the other hand, there is a different class of new physics models, such as Universal Extra Dimensions (UED) [1] and Little Higgs models [2, 3], where the divergences are cancelled by partner particles with the same spin. Furthermore, these models often contain a discrete symmetry, such as R-parity for SUSY, KK-parity for UED (and a certain variation of warped extra dimension model [4]) and T-Parity [5] for Little Higgs models, so that the lightest parity-odd particle becomes a natural dark matter candidate, which will presumably show up as missing energy in collider experiments at the end of cascade decays. According to all these scenarios and many more, new particles should be observed at the LHC, typically after decaying to SM particles.
However, once we discover new particles, it will not be sufficient to know the mass spectrum, production cross sections, or decay branching ratios, if we wish to understand what the underlying new physics is. Determining the spin of these newly-discovered particles is crucial in order to distinguish among new physics models, in particular, between SUSY (where partners of SM particles have spin differing by ) and same-spin theories (which we will refer to as “UED” from now on as an illustrative name, since these theories are similar for our purpose).
Various methods for spin measurements have been suggested and discussed before [6, 7, 8, 9, 10, 11, 12, 13, 14, 15, 16, 17, 18, 19, 20, 21, 22, 23, 24]. In this work, we focus on the following decay chain within the Minimal Supersymmetric Standard Model:
| (1) |
where the spins of the intermediate particles need to be determined in order to establish the correct model behind the chain. In this process the , presumably the LSP, escapes detection, so the spin measurement must be based on the angular distribution of the quark jet and the two leptons. Moreover, it seems very hard to distinguish between the first emitted lepton (the near lepton) and the second one (the far lepton) and to identify the charge of the quark (that is, if it is or ). Hence, the measured angular distribution cannot be correctly assigned to the outgoing particles.
The method first suggested by Barr [6], and later investigated by others [7, 8], uses the production asymmetry of the LHC as a collider. Since the colliding particles are both protons, there is more chance to get a quark than an anti-quark. This asymmetry was estimated to be around 70%, based on the difference between the valence and the sea quarks in the Parton Distribution Functions (PDFs).
Our suggestion to gain further information in this measurement, independent of the PDFs, is to identify the charge of the quark111This was also recently suggested in [24]. The approach of that paper is more model-independent than ours, as they characterize all the theoretical possibilities in the process. However, they use distributions which are not directly observable, while leaving the problem of distinguishing the near and far leptons to future work.. This is probably impractical for a light quark jet, but it is possible for third generation quarks. A similar idea was utilized for the spin determination of the gluino [25]. The charge ID of the bottom and the top was recently investigated thoroughly in several different contexts (see for example [26, 27, 28, 29]). The basic idea for measuring the charge is to use the leptonic decay channel of the , which is emitted from the heavy quark.
This paper is organized as follows: The basic inputs we need are presented in section 2; the theoretical angular distributions required for the analysis are given in section 3; section 4 discusses the method for spin determination using the distributions; in section 5 we support the calculations with Monte Carlo simulations; we propose an approach to circumvent full event reconstruction in section 6; actual model discrimination based on our method is discussed in section 7; we conclude in section 8.
2 Mass Spectrum and Cross Sections
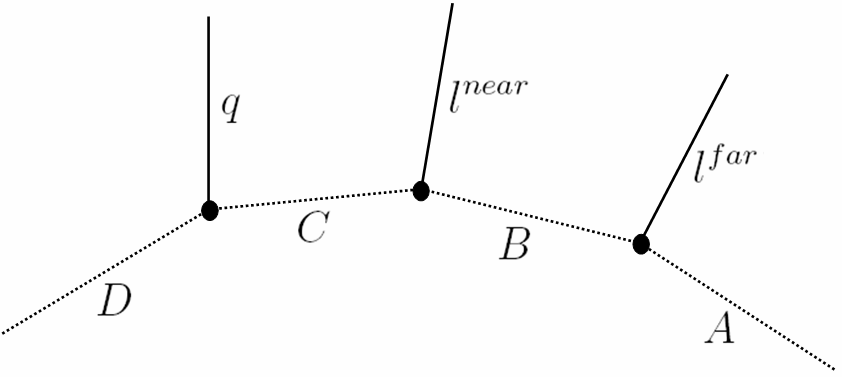
The mass spectrum of the intermediate particles, which affects the analysis discussed below, is of course model-dependent. Here we consider one of the Snowmass points for the SUSY scenario (SPS1a) [30, 31] and one representing case for the UED scenario222Both spectra were considered in [8] (the UED spectrum is based on [32]), so they were chosen here in order to allow for an apples-to-apples comparison.. The mass spectra for the SUSY and UED scenarios are shown in tables 1 and 2, respectively. The particles in the decay process are denoted by A, B, C, and D (see figure 1). Note that we focus on third generation squarks or same-spin quark-partners.
| D | C | B | A | ||||
|---|---|---|---|---|---|---|---|
| 507 | 540 | 391 | 583 | 179 | 202 | 144 | 97 |
| D | C | B | A | |||
|---|---|---|---|---|---|---|
| 909 | 951 | 936 | 936 | 851 | 824 | 800 |
The particles denoted by D in these two spectra, which are mass eigenstates, are generically mixtures of the left- and right-handed states. It turns out that for SPS1a, the stops and the sbottoms are in fact large admixtures of the chiral eigenstates, while for the UED spectrum considered here, the heavier states are almost completely identical to the left-handed (LH) states, that is, the mixing is very small.
It should be noted that in the actual experiment, the mass of the intermediate particles will be measured prior to the spin determination, with uncertainties of about 5-10% [33, 34, 35]. Hence the analysis below is based on the assumption that these masses are already known (the corresponding uncertainties are neglected, for simplicity).
We have computed the cross sections for the processes under consideration for the mass spectrum of SPS1a, using MadGraph/MadEvent [36, 37, 38]. For example, the cross section for the production of , via direct processes and indirect processes (e.g. through gluino decay), is in the order of a few pb. Restricting our attention to the decay chain (1), reduces this to a few tens of fb (we ignore tau leptons333Actually, some preliminary work shows that taus might be tagged with significant efficiency at the LHC [39]. This has the potential of greatly increasing our signal, since mostly decays to staus (almost 90% for SPS1a), relative to selectrons and smuons.). Another suppression by a factor of five stems from the requirement for a semileptonic decay of the quark, to enable the measurement of its charge. Overall, we expect that an integrated luminosity of 100 fb-1 should provide enough statistics for the analysis. For the heavier stop state, , the production cross section is about an order of magnitude lower. This is a result of the large mass difference between the two states, and the fact that it is accidently almost degenerate with the gluino, so that indirect production processes are suppressed. Of course, the cross section is highly model-dependent.
Comparing this to the case of first generation squarks, the total production cross section of and is about a factor of 2-3 higher than for , the branching ratio for this decay chain is a factor of 3 higher, and obviously there is no dilution coming from charge measurement. Therefore, the statistics should be about a factor of 40 higher than for .
A combinatorial confusion with the other side of the cascade decay is also possible. If the other supersymmetric/same-spin partner produced in the process decays through a similar chain, then it would be extremely difficult to correctly assign all the outgoing quarks and leptons. However, this is usually not the case, since shorter decay chains (e.g. ) or chains involving taus and neutrinos are much more likely to take place. Hence, in our work, we focus on general cases where such an issue does not present a problem.
3 Theoretical Angular Distributions
For a fixed spin assignment, there are two possible angular distributions within the chain, as the quark and near lepton can have either the same or opposite helicity. We will follow the conventions of [7, 8, 40, 41] and label these
-
•
Process 1: or or or ;
-
•
Process 2: or or or .
A note regarding the quark’s chirality is in order. In our SUSY scenario, since is mostly wino, the decay projects out the LH part of the squark, which is a large mixture of both chiral eigenstates (see section 2). On the other hand, for UED, it is possible that the mass eigenstates of the third generation KK-quarks would be almost identical to the chiral eigenstates, and (defined in table 2) tends to be mostly [32]. Therefore, given that the specific decay chain discussed here is observed, the LH KK-quark (which is the heavier state – and in table 2) would be the main contributor. This is also the case for first and second generation squarks in SUSY. As a result, we assume in any case that the quark is left-handed. Note that in order for an asymmetry to be produced (see definition in the next section), the particles should have a well-defined chirality either due to coupling or due to spectrum.
The matrix elements (and angular distributions) can be expressed in terms of the masses of the particles and the three invariant masses of the quark plus near lepton, the quark plus far lepton, and the dilepton. This has been performed for all the possible processes and spin assignments in [8, 22] (and also partially in [41]), assuming the approximation in which all SM particles are massless and intermediate particles have a zero width. Here we quote the results relevant for our discussion.
The two most useful invariant mass distributions are for the quark plus near lepton () and the quark plus far lepton (). The former is given by [8]
| (3) |
where is the angle between the quark and the near lepton, in the rest frame of particle C. The rescaled invariant mass is defined to be
| (4) |
The invariant mass distribution depends on the model, and changes between the two processes defined above. For the SUSY case, the distributions for the two processes, normalized to unit area, are given by
| (5) |
The distributions for the UED scenario are [8, 22]
| (6) |
The invariant mass for the quark and the far lepton is given by a more complicated expression
| (7) |
where is as before, is the angle between the two leptons in the rest frame of particle B and is the angle between the and the dilepton planes, in the rest frame of B. The rescaled invariant mass is defined as
| (8) |
The invariant mass distributions for the SUSY scenario are [8, 22, 41]
| (9) |
| (10) |
It should be noted that all the above distributions are given for vanishing masses of the SM particles. This assumption is obviously incorrect for the case of the top quark. The main effect of the top mass would be a shift in the edges of the distributions, that is, a change in the minimal and maximal possible value of (see appendix A). Other than that, the form of the distributions is similar, as shown in section 5.
4 Experimentally-Accessible Distributions
As noted in [6], there are experimental difficulties in making a direct measurement of the above distributions, since the two leptons cannot be easily identified as the near or far leptons, and the charge of the quark is difficult to determine. Hence, the distributions for processes 1 and 2 get mixed up. The approach proposed in [6] uses the nature of the LHC, which tends to produce more quarks than anti-quarks, as a mean to establish an asymmetry between the two processes. A calculation using an event generator yields an asymmetry of about 70% for all the relevant mass spectra, based on the proton PDF [8].
The most comprehensive study of this form was recently performed in [22], where the analysis was generalized model-independently and efficiently represented in terms of the useful observables. However, a physical source of asymmetry is still required for a clear distinction between different spin configurations.
The suggestion discussed here is to determine the charge of the quark, in case it is a bottom or a top, in order to induce such an asymmetry between the two oppositely-contributing processes. The bottom decays through a boson to produce a lepton at a probability of about 20%. The sign of the lepton can be used to determine the bottom’s charge. Similarly, the top quark always decays to a bottom and a boson, and when the decays leptonically, the charge of the top can be identified. Obviously, the production asymmetry of the LHC is irrelevant for third generation quarks.
There is, however, one complication regarding the bottom: After it is hadronized, it might take part in charge-flipping processes, that is meson decay or oscillations. As a result, there would be a 30% mistag rate [27]. Fortunately, this is not the case for the top quark, where the mistag rate is much lower, which is negligible for our needs.
Despite the fact that the asymmetry which stems from the collider is accidently of the same order as the bottom charge-id efficiency, there is one crucial advantage in the latter approach. The size of the production asymmetry is estimated in a numerical calculation using an extrapolation of the PDF. On the other hand, the bottom charge mistag rate is based on simple well-known physical phenomena, which can be calculated from first principles, and in fact was accurately measured.
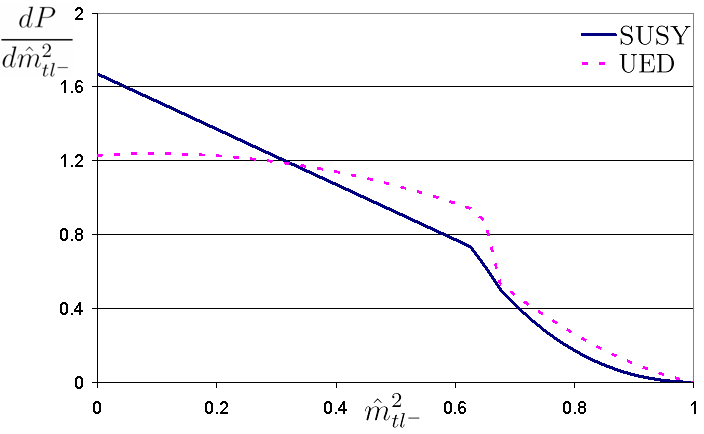
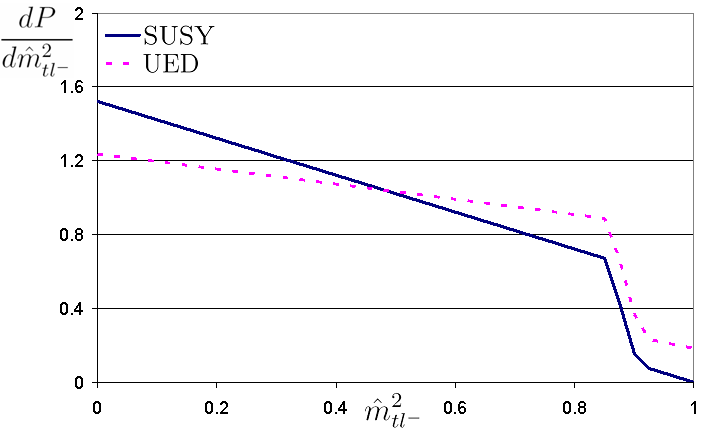
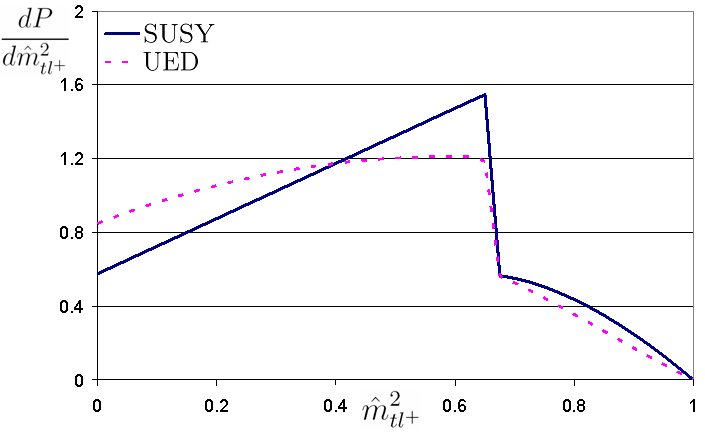
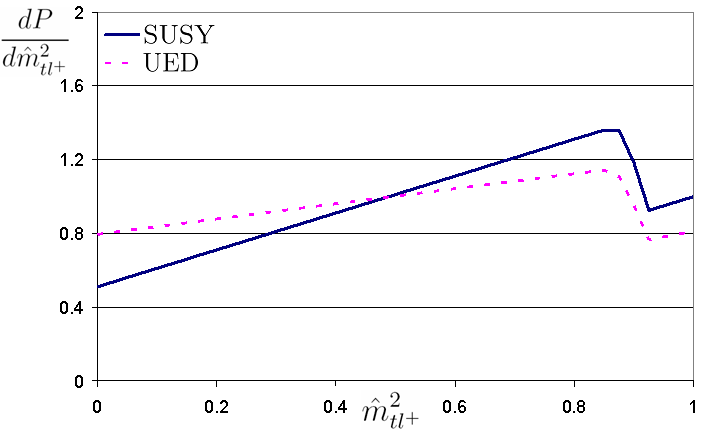
The treatment of the distributions here is similar to [8] (as mentioned above, a more general representation of the analysis was given in [22], but for our purpose this should suffice). Assuming that a quark was measured (not an anti-quark) and that the leptons are right-handed (see discussion at the end of this section), we consider the two experimentally-accessible distributions for
| (11) |
where is the probability for correctly identifying the quark’s charge and is the mistag rate (). As mentioned before, for a -quark , while for a top we take . If either an anti-quark is measured or the leptons are left-handed, the expressions above are interchanged (and in the case of both an anti-quark and LH leptons, the expressions should not be interchanged). Notice that and do not have the same range of possible values, so the normalization of is taken relative to the maximal value of in each case.
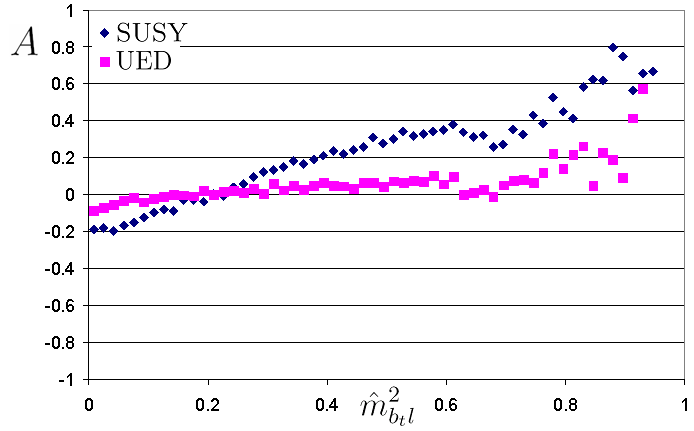
Figs. 2 and 3 show a comparison of the distributions for the SUSY and UED scenarios for the case of the bottom quark (with 30% mistag rate). Figs. 4 and 5 depict a comparison for the case of the top quark. We focus for now on the light squark states for SUSY, and , and the heavy states for UED, and , since these are mostly left-handed (see section 2 and remark in section 3).
Similar to [6, 7, 8], it is useful to define the charge asymmetry
| (12) |
A comparison of the asymmetry between SUSY and UED is given in Figs. 6 and 7.
According to these plots, it seems easier to determine the spin configuration in the top case than for the bottom case. This is a direct consequence of the assumption that top’s charge can be measured more accurately, with no significant mistagging.
Comparing these results to the ones in Ref. [8], we see that the asymmetry in the bottom case is almost identical, since the only difference lies within the mass of particle D444Actually, for the SUSY spin configuration the results are completely identical, since the form of the distributions is independent of the squark’s mass, see Eq. (5) and (9), while for UED spins, the difference is very small.. Therefore, the improvement in our suggestion is threefold:
-
•
It allows accounting for third generation quarks to enhance the statistics of the method.
-
•
The evaluation of the 30% mistag rate for the bottom is more robust than the estimation of the quark/anti-quark production asymmetry based on the PDF.
-
•
It produces a more distinguishable asymmetry for top quarks.
On the down side, the final states within this method are more complicated, as they involve the quark’s decay products, and the cross section (even though model-dependent) tends to be smaller.
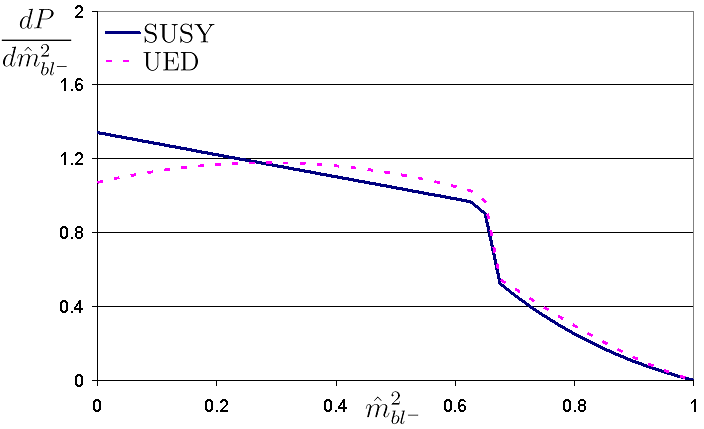
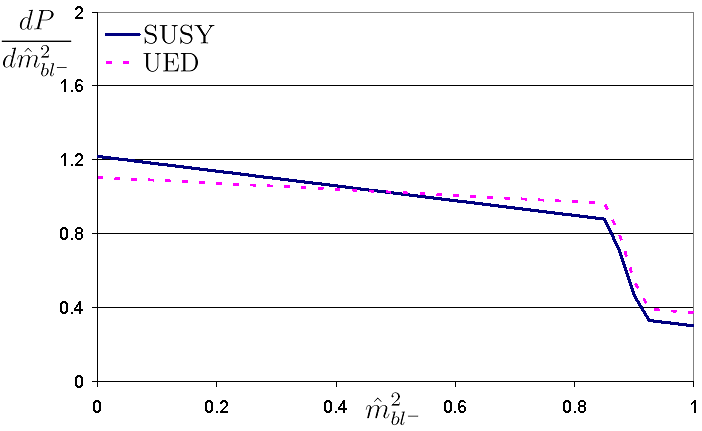
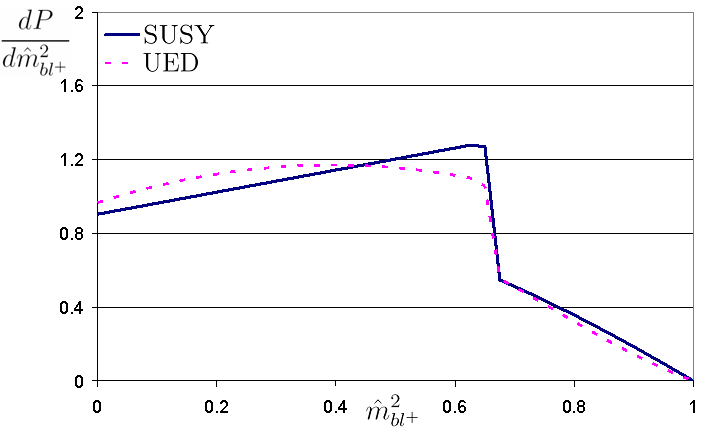

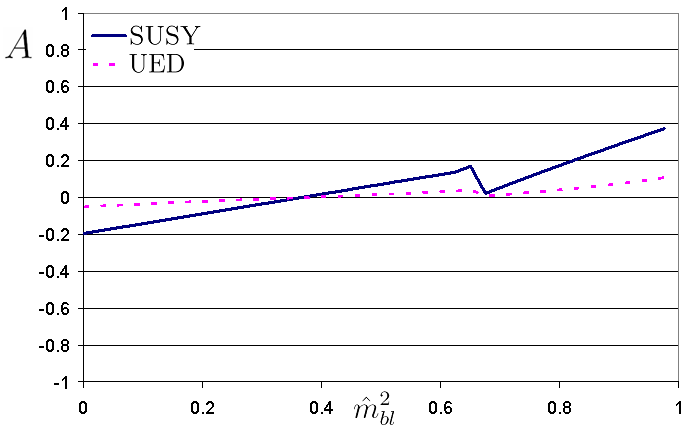
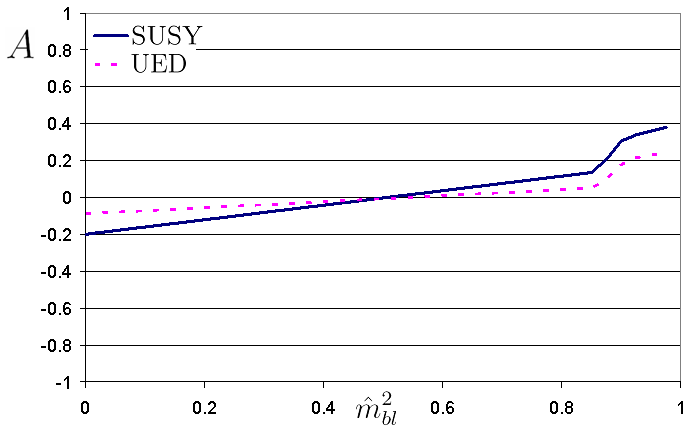
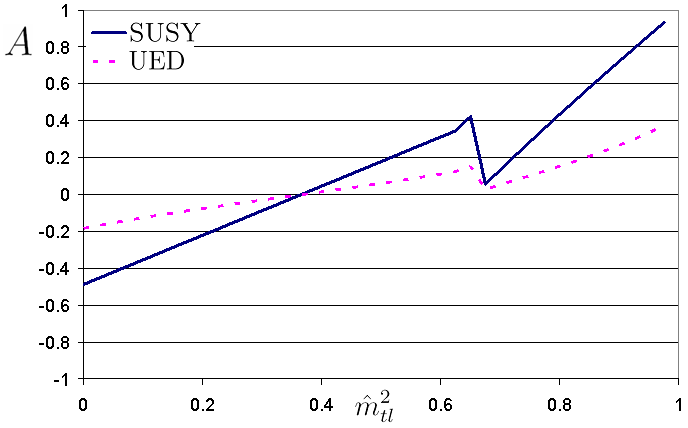
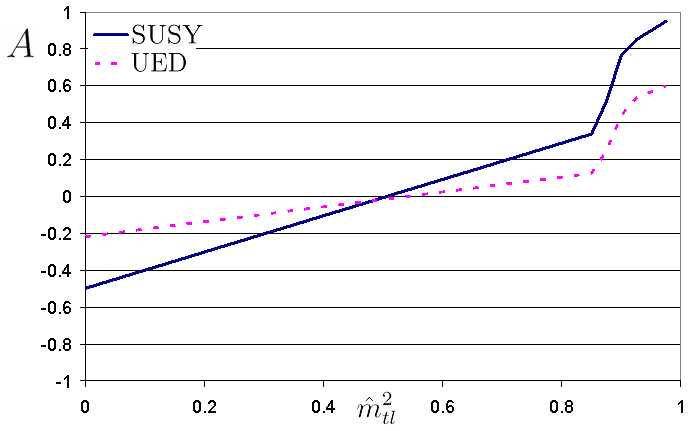
A few comments are in order here. First, a possible difficulty in making the required measurement is to reconstruct the quark’s 4-momentum, in case it is a top. This issue is discussed in appendix B. We propose a way to circumvent this possible problem in section 6. An interesting approach for missing momenta reconstruction was recently suggested in [23]. In our case, due to an additional source of missing energy originating from the leptonic decay of the quark, that method cannot be applied directly. However, it would be interesting to investigate whether an appropriate generalization of that method could be formulated.
Another issue that needs to be carefully treated is a possible confusion in distinguishing between the two leptons in the main decay chain (1) and the lepton that comes from the top decay, which is used to determine its charge (for the bottom quark, the -tagging should assist in associating the lepton correctly, hence we assume that this issue is solvable). This is discussed in appendix C. This appendix also briefly discusses the issue of correctly identifying the bottom from the “right” side of the cascade.
Regarding the leptons’ chirality, note that particle C () can only decay to right-handed sleptons for SPS1a (see table 1). More generally, when both left- and right-handed sleptons are present in the spectrum, the LH state would usually be the preferred decay product, because of the chiral nature of . In any case, an equal contribution from both states requires some fine tuning of the mass spectrum, so we could generally expect that only one chirality should be involved.
Finally, an interesting insight can be inferred from the plots above. The overall slope of the asymmetry curves in Figs. 6 and 7 is positive. This relies on the assumption that the emitted leptons should be right-handed, for the SUSY spectrum that we investigate. If for some other spectrum, the leptons would be mostly left-handed, then the observable distributions defined in Eq. (11) should be interchanged, and the slope of the asymmetry would be reversed. This means that if we measure the charge of the quark, then the slope of the asymmetry curve tells us about the chirality of the leptons [25, 42]. In fact, in conjunction with [43], the chirality of the stop can also be measured, and therefore render this conclusion model-independent.
5 Monte Carlo Simulations
In this section we present results for the above distributions, as calculated by Monte Carlo simulations. All the calculations were performed using MadGraph/MadEvent [37, 36, 38]. For simplicity, we focus only on the SUSY SPS1a mass spectrum, for both spin configurations.
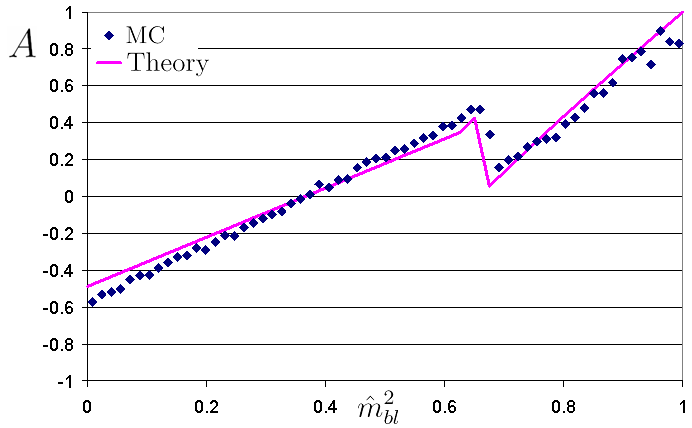
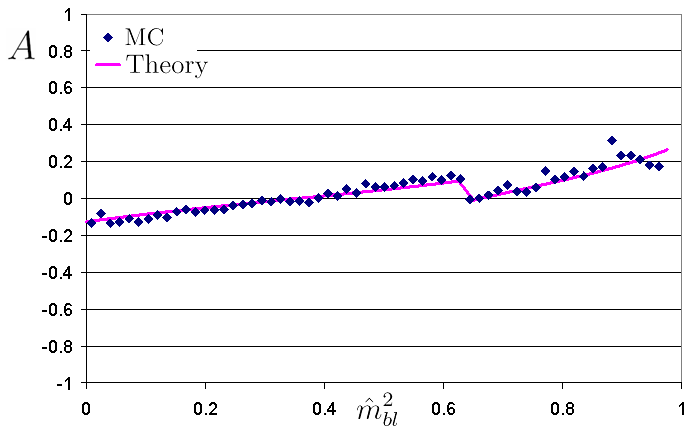
First, we demonstrate the agreement between the theoretical calculations described in previous sections and the MC results. Fig. 8 shows a comparison of the asymmetry for a bottom quark.
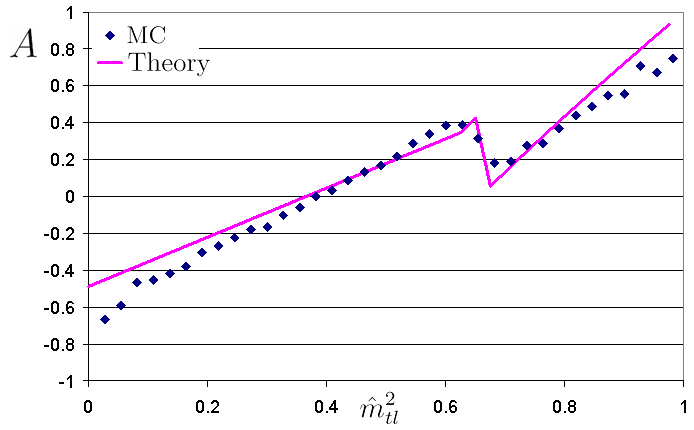
In order to make this comparison for the top quark, some adjustments are required, because the theoretical calculations in the previous sections assumed a massless quark. As mentioned, the mass of the top causes a shift in the minimal and maximal value of (see appendix A). Hence, in this comparison, we simply linearly normalize the values of for the MC results to range from 0 to 1. As can be seen in Fig. 9, this is enough to yield a reasonable agreement between theory and MC.


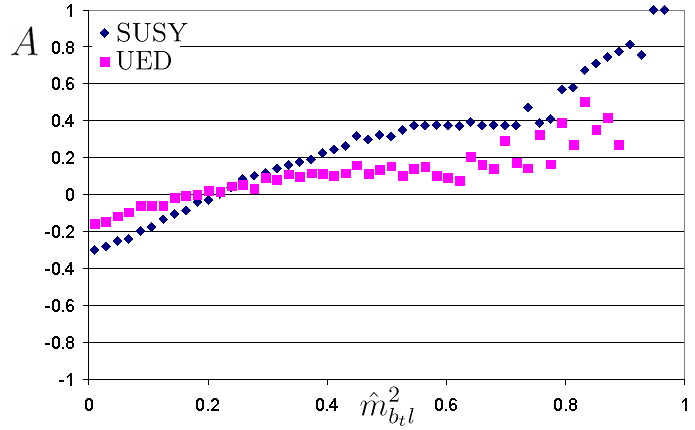
Next, we compare SUSY and UED distributions, in order to show that our method allows us to distinguish between different models. The asymmetry for a bottom and a top is shown in Figs. 10 and 11, respectively. For the top we consider two cases – one with a squark and one with . The first is the lighter state, so it is expected to be more readily produced, while for the second state, the top would be more highly-boosted, and therefore it is closer to the massless limit. We again normalize to range from 0 to 1.
We conclude this section by noting that a difference in the asymmetry is manifested in the sbottom case, and even more so for the stop.
6 Distributions with the Top’s Daughters
The top case presents a difficulty in making the experimental measurement, since the reconstruction of the top’s momentum might be complicated. However, we expect that even the top’s daughter products will induce an asymmetry similar to the one obtained via the top itself, as follows: In the limit of large boost, the decay product tends to collimate and point roughly in the direction of the top’s boost, hence the angular distribution is hardly affected. Furthermore, as was shown in [43, 44], the hardness of the of both the lepton and the -quark can serve as a top spin analyzer.
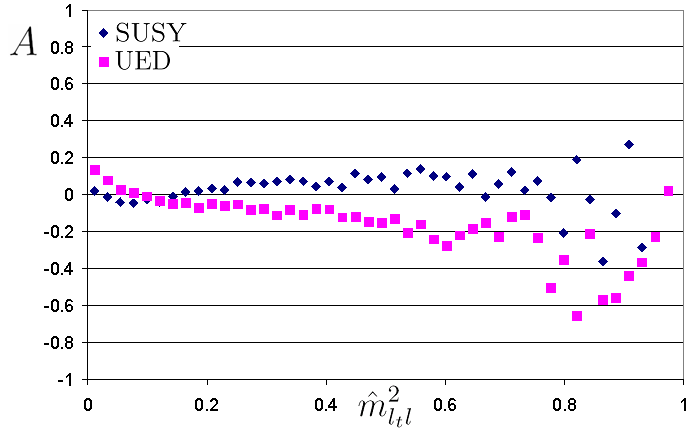
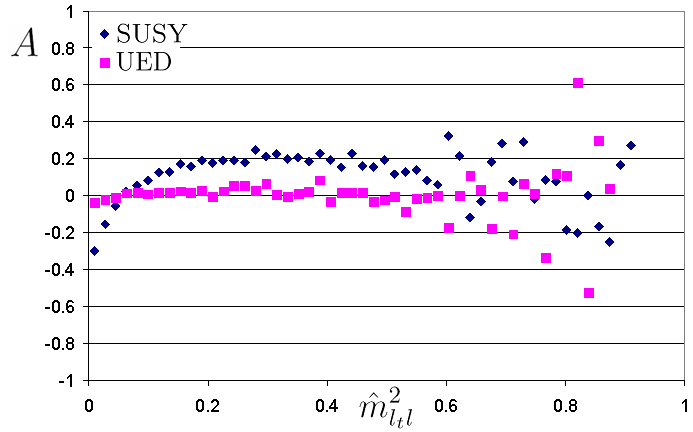
In fact, in [44] it was shown that for LH tops (as in our case) the -quark momentum tends to be harder, and therefore it serves as a more reliable “directionality” analyzer, which is required to improve the quality of the asymmetry. On the other hand, the lepton tends to decay in the backward direction (opposite to the boost axis) for LH tops, and therefore has a weaker correlation with the top’s original directionality.
The feature described above is evident in the MC results, where the asymmetry induced by the bottom daughter (shown in Fig. 12) looks more similar to the original top one (Fig. 11), compared to the one induced by the lepton daughter (Fig. 13). Obviously, combining the momenta of both lepton and bottom daughter particles is expected to yield an even more reliable angular distribution, as indeed observed by the simulation in Fig. 14.
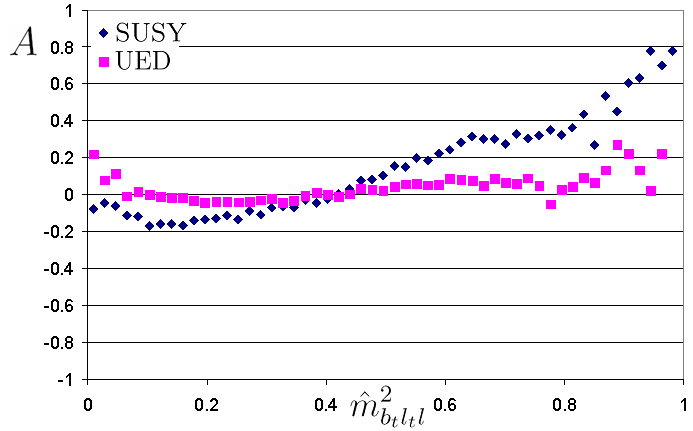
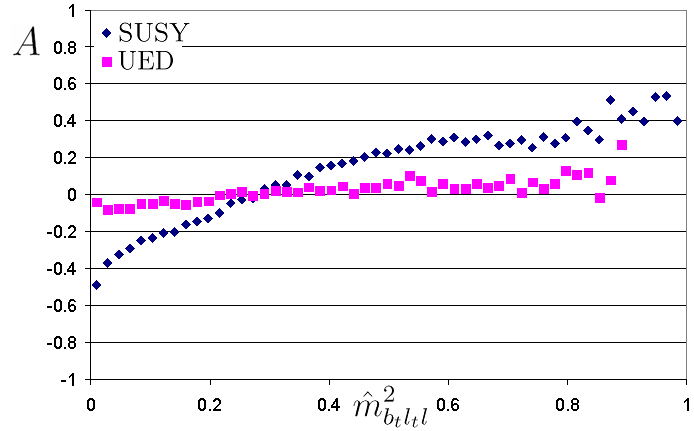
To summarize, it is possible to determine the spin configuration by using the top’s decay products. The difference between SUSY and UED is clearer with the bottom, while with the lepton only the middle part of the distributions might yield a visible difference (The distributions fall off rapidly with , so for large values of the asymmetry is “noisier”). In any case, both the bottom and the lepton will be available for analysis in each event (up to the -tag efficiency), so that the information extracted using them can be combined to give a better distinction.
7 Model Discrimination
So far we have graphically shown the qualitative difference between the two kinds of models for various methods. In order to give a more quantitative sense of how well we can distinguish one model from the other, we adapt the model discrimination method used in the section 4 of [8]. We use the parton-level distributions discussed above, leaving the analysis of realistic data to future research.
Distinguishing between two spin configurations, such that the “wrong” configuration can be disfavored relative to the “right” one by a factor of , requires events, which is the number needed to be evaluated here. More explicitly, quantifies our requirement:
| (13) |
and we take it to be 1000, following [8].
The Kullback-Leibler distance [45] between two distributions is defined as
| (14) |
where is an invariant mass distribution (properly normalized as a probability distribution) coming from spin configuration , and the distance is not symmetric since is taken to be the “correct” model. If we assume equal a priori probabilities for the realization of each model in nature, then in the limit of large :
| (15) |
This calculation can be applied to the and distributions555The dilepton distribution can also be taken into account, but it was found to be not so useful for discriminating between SUSY and UED models [8]. (but not to the asymmetry , which is not properly normalized), by analytically calculating KL. According to the results of [8], about 1060 events are needed to reject same-spin models in case SUSY is the underlying model or 1090 events in the opposite case (both cases with SPS1a mass spectrum, which will be assumed throughout this section), using each kind of distribution separately. A combined Monte-Carlo calculation, taking into account information from all the distributions together, yielded about 450 events to reject UED (470 in the opposite case).
For the method discussed here, the calculation is similar. In the case of the bottom quark, the distributions are almost identical to those considered in [8], where the only minor difference lies within the mass of the squark. Therefore, about 1140 events are required for each distribution separately, if SUSY is realized in nature and the squark in the decay chain is (for the heavier the result is essentially the same as for first generation squarks).
The case of the top quark seems much better, as the charge mistag rate is assumed to be negligible. On the other hand, the top itself might not be reconstructed, so we should use its daughters for a robust analysis. For example, using our MC results for the distribution for a squark, we obtain that 220 events are needed to disfavor UED over SUSY.
All this is based on considering independently one kind of distribution each time. Combining all the information simultaneously is much more efficient, but the calculation of is difficult to perform. Here we use a naive analysis: Assume that is the Kullback-Leibler distance for distribution of type ( etc.) and is the number of events needed to distinguish between different models independently. We wish to achieve a discriminating factor of using all the distributions together, based on a lower number of events . So we can choose a reduced factor for each distribution, such that (for each separately). But there is still freedom to fix the overall scale of the ’s (and ) by , to obtain the desired overall discrimination factor. Summing over , , we have
| (16) |
This gives a result which is not as good as the complete calculation of [8], that is, the number of events calculated using Eq. (16) is a bit higher, but it is sufficient for our purpose.
Combining the two useful distributions available in the case, and , we see that about 570 events are required to disfavor UED by a factor of 1000, and 580 events to reject SUSY if a same-spin model is in action. Relying on distributions, we need 210 and 240 events to disfavor UED for and , respectively (240 and 250 in the opposite case). Overall, for the most promising case of , we expect that an integrated luminosity of 100 fb-1 should be enough to obtain a clear distinction, for SPS1a mass spectrum (based on the cross section estimation in section 2).
It is important to emphasize that the numbers presented here are only meant to give a sense of the distinguishablity offered by our method, as in practice a more realistic analysis is required, and the results are model-dependent.
8 Conclusion
Recognizing the nature of a new physics model at the LHC is a non-trivial task, since various frameworks tend to yield similar signatures. By measuring the spin of newly-discovered particles, we can assist in revealing a part of this nature.
In this paper we suggest an improvement to an existing method to determine the spin of intermediate particles in decay chains. This is applied by taking third generation quarks, for which we can measure the charge, in order to establish observable non-trivial mass distributions. We believe that it is a robust method, as hadronic uncertainties related to the PDFs do not take part in the asymmetries.
Moreover, since the top’s charge can be more accurately determined, it allows for a better spin distinction. However, there might be some difficulty with the reconstruction of the top’s momentum. Therefore, we showed that its decay products can be used to obtain information about the spin, and we believe that this should be a more natural approach to apply, rather than numerically solving for the kinematics. Another benefit is the fact that the third generation squarks/same-spin partners are different in mass than the first two generations, so that even if the spectrum turns out to be almost degenerate, these states should be better distinguished. For concreteness, we also evaluate the significance of our method for a specific spectrum, and compare it to previous existing methods.
There are some drawbacks in the method suggested here. First, it might turn out to be a challenging task to obtain enough statistics to enable a clear distinction, especially due to the dilution factor induced by the specific decay of the quark, which is required for charge measurement. Another possible difficulty is in correctly identifying the lepton coming from the top quark, particularly if the stop/same-spin top partner is relatively light. Finally, we emphasize that our study does not attempt to provide a fully realistic analysis, but rather aim to propose a new approach and its potential feasibility. Further investigation is required in order to make it fully applicable, which includes, among others, issues like uncertainties related to new particles masses, combinatorial background and various detector effects.
Acknowledgements
We thank Kyoungchul Kong, Hitoshi Murayama, Michele Papucci and Itay Yavin for helpful discussions. We also thank Oscar Eboli for useful discussions and for commenting on the manuscript. The research of GP is supported by PHY-06353354 NSF grant and the Peter and Patricia Gruber Award.
Appendix A Invariant Mass Corrections Due to the Top Mass
The expressions for the invariant masses given in section 3 were computed assuming that the quark’s mass vanishes. However, in the case of the top quark, its mass can no longer be neglected. As a result, the distributions would have a different maximum value for , and also a minimum which is larger than 0. Here we do not calculate the full form of the distributions, but only give the correction for the edges.
The maximum and minimum values for are given by
| (17) |
where the sign before the square root is for the maximum value, and the sign is for the minimum, and we defined . This shifts up the maximum edge of the distribution. For example in the case of a squark in the SPS1a mass spectrum, the maximum changes from 216 to 248 GeV. The minimum would be usually slightly above the top’s mass – 187 GeV in this example.
Similarly, for we get
| (18) |
If we use the bottom that results from the top decay, instead of the top itself (see section 6), then the distributions change. The minimum of is very close to 0 (or the bottom’s mass, to be exact), and the maximum for is
| (19) |
where . For we simply replace in this formula, like before.
It should be mentioned that all the above formulae are still slightly approximated, since we assumed that all intermediated particles are on mass shell.
Appendix B Four-Momenta Reconstruction
The calculation of the invariant mass distributions requires the knowledge of the 4-momenta of the relevant outgoing particles. In the case of light quark production in the process, which is observed as a jet, this should not be a problem. However, in the scenario studied here, the quark might be a top which decays leptonically (). Therefore, evaluating the 4-momentum of the top might be more difficult.
In order to demonstrate how this is possible, we now show some examples. First, let’s assume that a stop pair is produced, both of which decay through the same process, Eq. (1). Furthermore, we assume that one top quark decays leptonically, and the other decays hadronically, so that the 4-momentum of the latter can be reconstructed.
The number of unknown parameters is 12, which arises from the 4-momenta of one neutrino and two LSPs. The count of constraints goes as follows: the mass of yields two constraints (one on each side of the decay chain), the slepton mass (2), the mass of (2), the neutrino mass (1), the -boson mass (1), the top mass (1), the stop mass (2) and two missing constraints. Altogether, we have 13 equations satisfied by the 12 unknowns, which makes this process over-constrained. We have verified numerically that a solution can be obtained in this way (the excess constraint assists in identifying the correct solution).
Another example is the case in which the second stop decays as , with a hadronic decay of the -boson. Again, we have 12 unknowns, and the following constraints: the mass of (2), the slepton mass (1), the mass of (1), the neutrino mass (1), the -boson mass (1), the top mass (1), the mass of (1), the stop mass (2) and two missing constraints. Hence, in this case we have 12 constraints. This is, of course, valid for truth-level analysis without taking into account detector effects (for example, the effects of detector resolution and jet energy scale) and other uncertainties such as new particles’ masses in the decay chain, etc.
In case of a shorter decay chain of the second stop, we might not have enough information to reconstruct the missing 4-momenta, hence a different approach is required (see section 6). We should also note that the production of one stop and one gluino usually offers at least 12 constraints.
Appendix C Identifying Important Particles
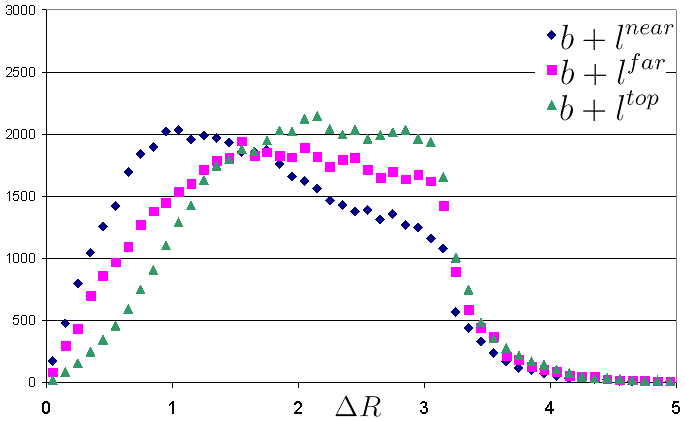
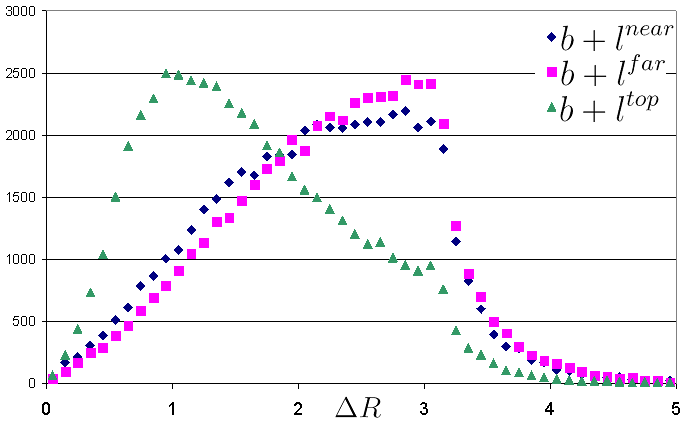
There are several potential problems in correctly assigning labels to particles in the decay chain. First, the issue of identifying the lepton that should be used to determine the charge of the top is certainly not a simple one. Naively, it might be expected that if the top is highly-boosted, then this lepton should be more collinear with the daughter bottom (however, note the discussion in section 6 related to the difficulty in the case of LH leptonic top). As a result, for the SUSY spectrum considered here (table 1), the heavier stop will provide a greater chance to identify the lepton than the lighter one .
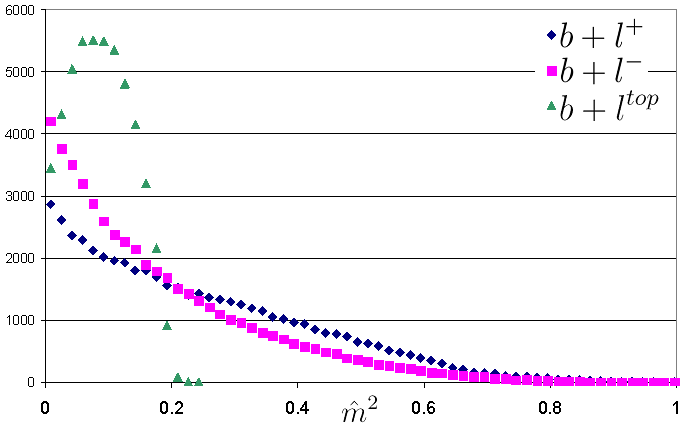
This intuitive argument can be demonstrated by MC simulations. Fig. 15 shows a comparison of of the daughter bottom with each one of the three leptons, for both stop mass eigenstates. It is evident that for , the lepton coming from the top decay does indeed tend to be closer to the bottom than the other leptons, while for that is not true.
Another variable we can use to differentiate between the leptons is the invariant mass distributions of each lepton with the daughter bottom. Since the invariant mass of the bottom and the lepton from the top is bounded by the top mass, a cut on this parameter can assist in this issue. As shown in Fig. 16, this is again more useful for than for .
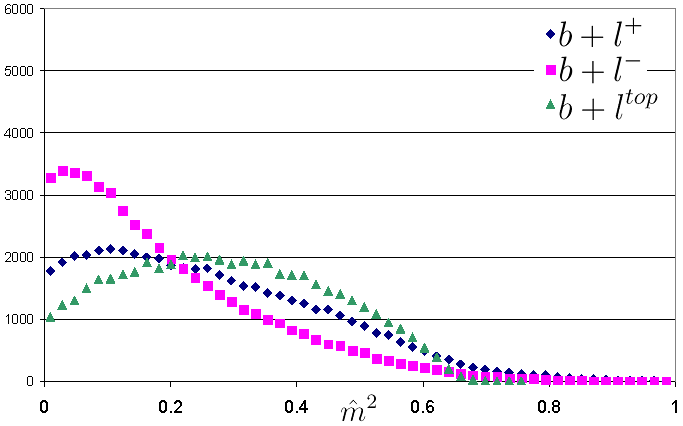
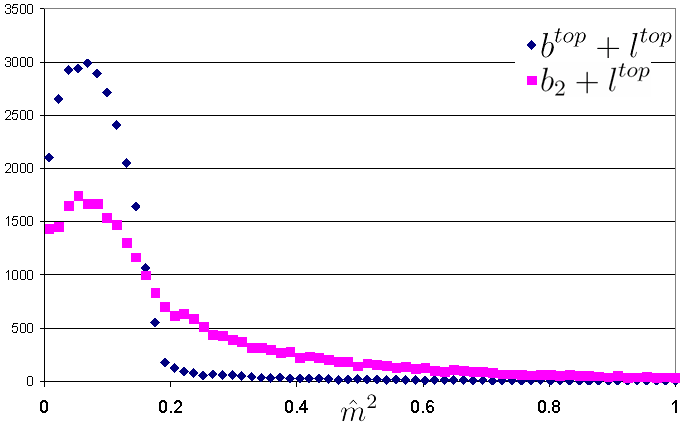
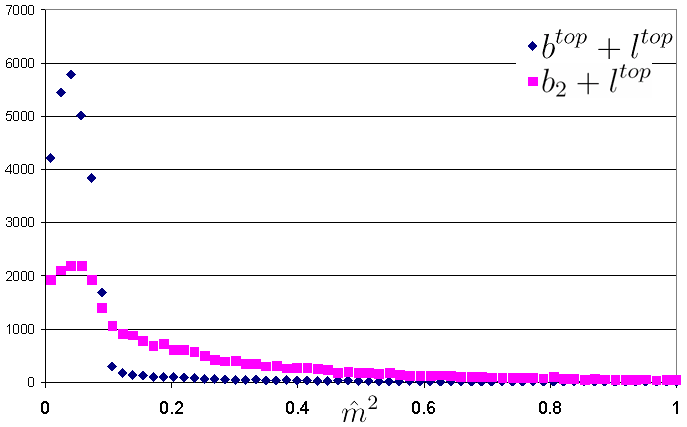
A similar issue arises with the bottoms. In any case of a third generation cascade, there will be two bottom quarks from the two sides of the cascade, and in general it might be difficult to correctly assign the one that belongs to the “interesting” side. This issue can be approached in a similar fashion, for instance by investigating each bottom’s mass distribution with a lepton from that side (assuming that the other side is strictly hadronic). Fig. 17 shows that for a stop event, the distribution of a bottom with a lepton coming from the same top is different than the other bottom with the same lepton, as the former is bounded by the top’s mass.
Finally, we can use the approach discussed in the previous appendix, and reconstruct the entire process. When this system is over-constrained, the correct solution can be obtained. Actually, this also makes it possible to identify correctly the near and far leptons (under the above idealized assumptions). In any case, this issue requires a more detailed study.
References
- [1] T. Appelquist, H.-C. Cheng, and B. A. Dobrescu, “Bounds on Universal Extra Dimensions,” Phys. Rev. D64 (2001) 035002, hep-ph/0012100.
- [2] N. Arkani-Hamed, A. G. Cohen, and H. Georgi, “(De)constructing Dimensions,” Phys. Rev. Lett. 86 (2001) 4757–4761, hep-th/0104005.
- [3] N. Arkani-Hamed, A. G. Cohen, and H. Georgi, “Electroweak Symmetry Breaking from Dimensional Deconstruction,” Phys. Lett. B513 (2001) 232–240, hep-ph/0105239.
- [4] K. Agashe, A. Falkowski, I. Low, and G. Servant, “KK Parity in Warped Extra Dimension,” JHEP 04 (2008) 027, 0712.2455.
- [5] H.-C. Cheng and I. Low, “TeV Symmetry and the Little Hierarchy Problem,” JHEP 09 (2003) 051, hep-ph/0308199.
- [6] A. J. Barr, “Using Lepton Charge Asymmetry to Investigate the Spin of Supersymmetric Particles at the LHC,” Phys. Lett. B596 (2004) 205, hep-ph/0405052.
- [7] J. M. Smillie and B. R. Webber, “Distinguishing Spins in Supersymmetric and Universal Extra Dimension Models at the Large Hadron Collider,” JHEP 10 (2005) 069, hep-ph/0507170.
- [8] C. Athanasiou, C. G. Lester, J. M. Smillie, and B. R. Webber, “Distinguishing Spins in Decay Chains at the Large Hadron Collider,” JHEP 08 (2006) 055, hep-ph/0605286.
- [9] M. Battaglia, A. Datta, A. De Roeck, K. Kong, and K. T. Matchev, “Contrasting Supersymmetry and Universal Extra Dimensions at the CLIC Multi-TeV e+ e- Collider,” JHEP 07 (2005) 033, hep-ph/0502041.
- [10] A. Datta, K. Kong, and K. T. Matchev, “Discrimination of Supersymmetry and Universal Extra Dimensions at Hadron Colliders,” Phys. Rev. D72 (2005) 096006, hep-ph/0509246.
- [11] S. Y. Choi, K. Hagiwara, H. U. Martyn, K. Mawatari, and P. M. Zerwas, “Spin Analysis of Supersymmetric Particles,” Eur. Phys. J. C51 (2007) 753–774, hep-ph/0612301.
- [12] S. Y. Choi, K. Hagiwara, Y. G. Kim, K. Mawatari, and P. M. Zerwas, “Tau Polarization in SUSY Cascade Decays,” Phys. Lett. B648 (2007) 207–212, hep-ph/0612237.
- [13] P. Meade and M. Reece, “Top Partners at the LHC: Spin and Mass Measurement,” Phys. Rev. D74 (2006) 015010, hep-ph/0601124.
- [14] L.-T. Wang and I. Yavin, “Spin Measurements in Cascade Decays at the LHC,” JHEP 04 (2007) 032, hep-ph/0605296.
- [15] C. Kilic, L.-T. Wang, and I. Yavin, “On the Existence of Angular Correlations in Decays with Heavy Matter Partners,” JHEP 05 (2007) 052, hep-ph/0703085.
- [16] A. Alves and O. Eboli, “Unravelling the sbottom spin at the CERN LHC,” Phys. Rev. D75 (2007) 115013, 0704.0254.
- [17] A. Rajaraman and B. T. Smith, “Determining Spins of Metastable Sleptons at the Large Hadron Collider,” Phys. Rev. D76 (2007) 115004, 0708.3100.
- [18] C. Csaki, J. Heinonen, and M. Perelstein, “Testing Gluino Spin with Three-Body Decays,” JHEP 10 (2007) 107, 0707.0014.
- [19] G. L. Kane, A. A. Petrov, J. Shao, and L.-T. Wang, “Initial Determination of the Spins of the Gluino and Squarks at LHC,” 0805.1397.
- [20] L.-T. Wang and I. Yavin, “A Review of Spin Determination at the LHC,” Int. J. Mod. Phys. A23 (2008) 4647–4668, 0802.2726.
- [21] M. R. Buckley, S. Y. Choi, K. Mawatari, and H. Murayama, “Determining Spin through Quantum Azimuthal-Angle Correlations,” 0811.3030.
- [22] M. Burns, K. Kong, K. T. Matchev, and M. Park, “A General Method for Model-Independent Measurements of Particle Spins, Couplings and Mixing Angles in Cascade Decays with Missing Energy at Hadron Colliders,” JHEP 10 (2008) 081, 0808.2472.
- [23] W. S. Cho, K. Choi, Y. G. Kim, and C. B. Park, “MT2-Assisted On-Shell Reconstruction of Missing Momenta and its Application to Spin Measurement at the LHC,” 0810.4853.
- [24] M. Graesser and J. Shelton, “Probing Supersymmetry With Third-Generation Cascade Decays,” 0811.4445.
- [25] A. Alves, O. Eboli, and T. Plehn, “It’s a Gluino!,” Phys. Rev. D74 (2006) 095010, hep-ph/0605067.
- [26] M. T. Bowen, “Using Charge Asymmetries to Measure Single Top Quark Production at the LHC,” Phys. Rev. D73 (2006) 097501, hep-ph/0503110.
- [27] V. M. Abazov et al., “Experimental Discrimination Between Charge 2e/3 Top Quark and Charge 4e/3 Exotic Quark Production Scenarios,” Phys. Rev. Lett. 98 (2007) 041801, hep-ex/0608044.
- [28] V. M. Abazov et al., “First Measurement of the Forward-Backward Charge Asymmetry in Top Quark Pair Production,” Phys. Rev. Lett. 100 (2008) 142002, 0712.0851.
- [29] J. Ellis, F. Moortgat, G. Moortgat-Pick, J. M. Smillie, and J. Tattersall, “Measurement of CP Violation in Stop Cascade Decays at the LHC,” 0809.1607.
- [30] B. C. Allanach et al., “The Snowmass Points and Slopes: Benchmarks for SUSY Searches,” Eur. Phys. J. C25 (2002) 113, hep-ph/0202233.
- [31] I. AJack, D. R. T. Jones, and A. F. Kord, “Snowmass Benchmark Points and Three-Loop Running,” Ann. Phys. 316 (2005) 213, hep-ph/0408128.
- [32] H.-C. Cheng, K. T. Matchev, and M. Schmaltz, “Radiative Corrections to Kaluza-Klein Masses,” Phys. Rev. D66 (2002) 036005, hep-ph/0204342.
- [33] H.-C. Cheng, J. F. Gunion, Z. Han, G. Marandella, and B. McElrath, “Mass Determination in SUSY-Like Events with Missing Energy,” JHEP 12 (2007) 076, 0707.0030.
- [34] ATLAS Collaboration, “ATLAS Detector and Physics Performance. Technical Design Report. Vol. 2,”. CERN-LHCC-99-15.
- [35] CMS Collaboration, G. L. Bayatian et al., “CMS Technical Design Report, Volume II: Physics Performance,” J. Phys. G34 (2007) 995–1579.
- [36] T. Stelzer and W. F. Long, “Automatic Generation of Tree Level Helicity Amplitudes,” Comput. Phys. Commun. 81 (1994) 357–371, hep-ph/9401258.
- [37] F. Maltoni and T. Stelzer, “MadEvent: Automatic Event Generation with MadGraph,” JHEP 02 (2003) 027, hep-ph/0208156.
- [38] J. Alwall et al., “MadGraph/MadEvent v4: The New Web Generation,” JHEP 09 (2007) 028, 0706.2334.
- [39] S. Lai and A. Kaczmarska, “Reconstruction and Identification of Hadronic Tau Decays with ATLAS,” 0809.5144.
- [40] C. Athanasiou, C. G. Lester, J. M. Smillie, and B. R. Webber, “Addendum to ’Distinguishing Spins in Decay Chains at the Large Hadron Collider’,” hep-ph/0606212.
- [41] D. J. Miller, P. Osland, and A. R. Raklev, “Invariant Mass Distributions in Cascade Decays,” JHEP 03 (2006) 034, hep-ph/0510356.
- [42] T. Goto, K. Kawagoe, and M. M. Nojiri, “Study of the Slepton Non-Universality at the CERN Large Hadron Collider,” Phys. Rev. D70 (2004) 075016, hep-ph/0406317.
- [43] M. Perelstein and A. Weiler, “Polarized Tops from Stop Decays at the LHC,” 0811.1024.
- [44] L. G. Almeida, S. J. Lee, G. Perez, I. Sung, and J. Virzi, “Top Jets at the LHC,” 0810.0934.
- [45] S. Kullback and R. A. Leibler, “On Information and Sufficiency,” The Annals of Mathematical Statistics 22 (1951), no. 1, 79.