Observation of an Inverse Energy Cascade
in Developed
Acoustic Turbulence in Superfluid Helium
Abstract
We report observation of an inverse energy cascade in second sound acoustic turbulence in He II. Its onset occurs above a critical driving energy and it is accompanied by giant waves that constitute an acoustic analogue of the rogue waves that occasionally appear on the surface of the ocean. The theory of the phenomenon is developed and shown to be in good agreement with the experiments.
pacs:
52.35.Mw, 67.25.dt, 47.27.-i, 47.20.KyA highly excited state of a system with numerous degrees of freedom, characterized by a directional energy flux through frequency scales, is referred to as turbulent K41 ; book . Like the familiar manifestations of vortex turbulence in fluids, turbulence can also occur in systems of waves, e.g. turbulence of sound waves in oceanic waveguides at1 , magnetic turbulence in interstellar gases at2 , shock waves in the solar wind and their coupling with Earth’s magnetosphere at3 , and phonon turbulence in solids Tsoi . Following the ideas of Kolmogorov, the universally accepted picture says that nonlinear wave interactions give rise to a cascade of wave energy towards shorter and shorter wavelengths until, eventually, it becomes possible for viscosity to dissipate the energy as heat. Experiments and calculations show that, most of the time, the Kolmogorov picture is correct book ; PRL2006 ; falk1 .
We demonstrate below that this picture is incomplete. Our experiments with second sound (temperature-entropy) waves in He II show that, contrary to the conventional wisdom, acoustic wave energy can sometimes flow in the opposite direction too. We note that inverse energy cascades are known in 2-dimensional incompressible liquids and Bose gases Kraichnan , and have been considered for quantized vortices Vinen .
We find that energy backflow in our acoustic system is attributable to a decay instability (cf. the kinetic instability in turbulent systems Lvovkin ), controlled mainly by nonlinear decay of the wave into two waves of lower frequency governed by the energy (frequency) conservation law book . Here is the frequency of a linear wave of wave vector and is the second sound velocity at negligibly small amplitude. The instability manifests itself in the generation of subharmonics. A quite similar parametric process, due to 4-wave scattering (modulation instability), is thought to be responsible for the generation of large wind-driven ocean waves Diachenko . Decay instabilities (especially threshold and near-threshold behaviour) have been studied for e.g. spin waves Suhl , magnetohydrodynamic waves in plasma Spangler , and interacting first and second sound waves in superfluid helium near the superfluid transition Rinberg .
We now discuss what happens to a system of acoustic waves far beyond the decay threshold. Modelling the resultant nonlinear wave transformations in the laboratory is a potentially fruitful approach that has already yielded important results for e.g. the turbulent decay of capillary waves on the surface of liquid H2 prl . Here, we exploit the special properties of second sound Landau , which enable fundamental wave processes to be studied under laboratory conditions. Its velocity depends strongly on its amplitude and can be approximated as
| (1) |
where the nonlinearity coefficient Fairbank , which determines the strength of the wave interactions, can be made large if the temperature is set right.
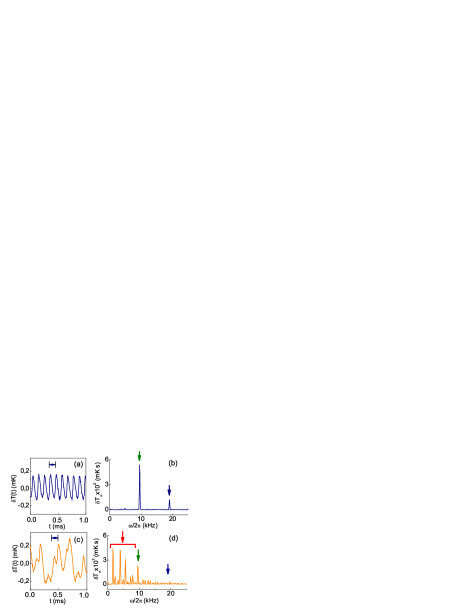
Our experiments make use of the high cryoacoustical resonator described previously PRL2006 , excited close to one of its resonant frequencies. It enables very large second sound standing wave amplitudes to be attained for modest levels of excitation. Its -factor, determined from the widths of longitudinal resonances at small heat flux densities, was for resonant numbers and for . Fig. 1 presents typical results obtained when driving at a relatively high resonant frequency (the 96th longitudinal resonance of the cell). Those in Figs. 1(a),(b) reproduce our earlier observation of the direct Kolmogorov-like cascade of second sound waves in He II PRL2006 , when driving on resonance. Figs. 1(c)–(d) show that tiny changes in driving frequency can produce marked changes in the shape and spectrum of the standing wave. The formation of the spectral peaks near , and satisfies the frequency conservation law with , supporting our inference that the instability is controlled mainly by 3-wave interactions. When the instability develops, huge distortions of the initially periodic signal occur. Although it remains nearly periodic, its characteristic period exceeds that of the driving force and its amplitude can become more than twice that at the driving frequency.
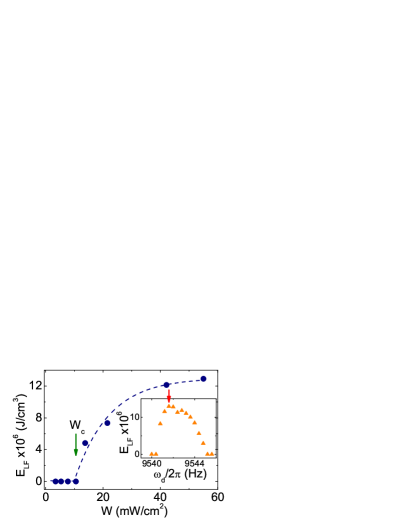
To characterise the instability quantitatively, we use the energy contained in the low-frequency part of the spectrum ,
| (2) |
as an indicator. Fig. 2 shows the dependence of on the AC heat flux density , when driving on the 96th resonance close to 2.08 K. For small we did not observe any subharmonic generation at all PRL2006 . Then, above a critical flux , rose rapidly, suggesting that the phenomenon is of a threshold character. At K for which vanishes Fairbank , no subharmonics were observed, regardless of the magnitude of , thus confirming the crucial importance of nonlinearity. For above 10.4 mW/cm2, we observed a distortion of the signal similar to that shown in Fig. 1(c) and the formation of a few subharmonics. Further increase of above 20 mW/cm2 led to the generation of multiple subharmonics. These phenomena appear in the regime where the energy cascade towards the high frequency domain (i.e. direct cascade, with a Kolmogorov-like spectrum PRL2006 ; falk1 ), is already well-developed; see also Fig. 4.
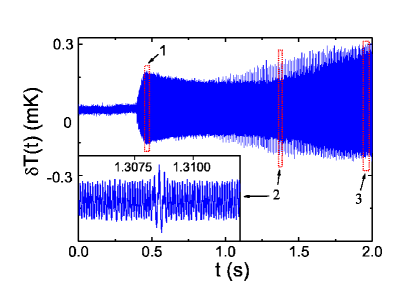
All the above results correspond to steady-state regimes, of the wave system. In Fig. 3 we illustrate the transient processes observed after a step-like shift of the driving frequency from a frequency initially set far from any resonance to the 96th resonance frequency for mW/cm2, K. We find that harmonics of the drive in the high-frequency spectral domain are formed very quickly, but that formation of the subharmonics takes much longer: it took s here, and can reach several tens of seconds under some conditions PREWT . It is evident from the inset in Fig. 3 that, as the instability develops, isolated “rogue waves” appear in the signal. As time evolves, the rogue waves appear more frequently and, at the later stages, they merge resulting in the strong low-frequency modulation of the signal observed in the steady-state measurements (Fig.1).
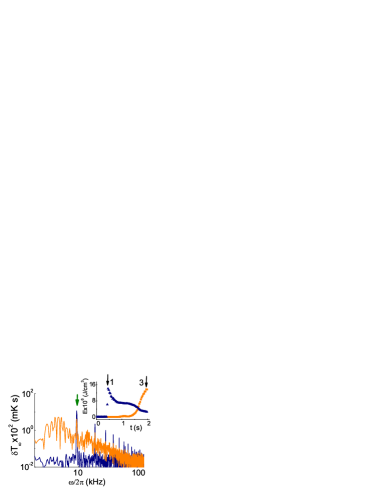
When the subharmonics appear, a marked reduction occurs in the energy contained in the high-frequency spectral domain: see Fig. 4. A substantial proportion of the energy then flows from the driving frequency towards the low frequency domain leading to an accumulation of wave energy there and a corresponding increase in wave amplitude. The reduction of wave amplitude seen in the high frequency spectral domain is indicative of the onset of energy backflow towards lower frequencies, i.e. a sharing of the flux between the direct and inverse energy cascades. The decrease in energy at high frequencies energy in s is attributable to relaxation processes in the direct cascade. Redistribution of wave energy due to sharing of the energy flux between the direct and inverse cascades starts at s. Note that the transient evolution shown in Figs 3 and 4 is incomplete: the forward and inverse energy fluxes are still changing at , leading us to anticipate further relaxation oscillations at longer times (inaccessible with our present equipment): the transient dynamics is clearly complex, and a full characterisation will require further work. Absorption of wave energy at low frequencies is probably attributable to viscous drag of the normal fluid component on the resonator walls, given that bulk second sound damping is negligibly small in this frequency range: this would be consistent with the observed strong decrease of the resonator -factor below 3 kHz. We observe hysteresis between increasing and decreasing frequency scans (bars on data points in Fig. 5). Its width, i.e. the region where the low frequency sound waves are metastable, was less than the viscous width of the resonance.
To seek a more detailed understanding of wave energy transformation in acoustic turbulence, we used a technique PREWT for direct numerical integration of the 2-fluid thermohydrodynamical equations Landau , expanded up to quadratic terms in the wave amplitude. It representats the second sound waves in terms of Hamiltonian variables PRL2006 ; Pokrovsky , as in earlier studies falk1 of acoustic turbulence. Wave damping was, however, taken explicitly into account at all frequencies, a feature that is of key importance for a correct description of subharmonic generation. The main results are summarised in Fig. 5.
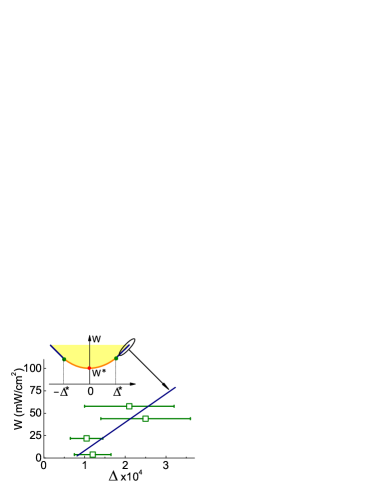
It is evident (inset of Fig. 5) that, for sufficiently high driving amplitude , the wave develops an instability with respect to generation of low-frequency subharmonics of the driving force at . For zero detuning from a cavity resonance, the onset of the instability occurs at a threshold . If the dimensionless frequency detuning is less than a critical value , the instability has a soft character, in that the amplitudes of the low frequency waves tend to zero at the threshold bifurcation line. Outside this range, the low frequency waves are characterised by the hard onset observed experimentally. Measurements (squares) are compared with theory (full line) in the main part of Fig. 5. The hard onset is accompanied by a finite jump in subharmonic amplitude. These two regimes of behaviour are separated by critical points on the bifurcation line. The generation of subharmonics in the nonlinear oscillatory system found numerically appears to be similar to the bifurcation of an anharmonic oscillator Mandelstam . We estimated numerically that the critical detuning parameter at K is close to , and that the critical AC heat flux density is equal to a few mW/cm2, in good agreement with our observations. The experimental results shown in Fig. 1 can be understood as corresponding to the working point moving horizontally on the bifurcation diagram (Fig. 5, inset) into the (yellow) shaded region from a position just outside it, through the hard (blue) instability line. Although nonlocal (in -space) interactions between waves at and low frequency waves probably contributes to the subharmonics, due to the finite width of the low-frequency spectral domain, our numerical estimates show that the interactions of high-frequency () waves with subharmonics are relatively weak, consistent with our inference of two cascades.
Our experiments have revealed an inverse wave energy cascade in a turbulent acoustic system. It is responsible for a substantial increase in wave amplitude corresponding to the formation of a set of huge low-frequency subharmonics. This instability develops through formation of isolated low-frequency waves of amplitude higher than that typical of waves around them. The latter can be considered as the acoustic analogue of the giant “rogue” waves that occasionally appear on the ocean and endanger shipping. Their origin lies in the development of a decay instability of the periodic wave, i.e. a similar mechanism to that proposed Onorato ; Diachenko (modulation instability) to account for the creation of oceanic rogue waves Dean . Note that this mechanism differs from an alternative explanation proposed recently natureopt that involves scattering of nonlinear waves on a continuous noisy background.
We acknowledge valuable discussions with A. A. Levchenko, V. E. Zakharov, E. A. Kuznetsov, V. S. L’vov, V. V. Lebedev and T. Mizusaki. The work was supported by Engineering and Physical Sciences Research Council (UK), the Russian Foundation for Basic Research, project No. 07-02-00728 and by the Presidium of the Russian Academy of Sciences under the programs “Quantum Macrophysics” and “Mathematical Methods in Nonlinear Dynamics”.
References
- (1) A.N. Kolmogorov, Dokl. Akad. Nauk. SSSR 30, 299 (1941).
- (2) V.E. Zakharov, G. Falkovich, and V.S. L’vov, Kolmogorov Spectra of Turbulence I (Springer, Berlin, 1992).
- (3) S.N. Gurbatov, V.V. Kurin, L.M. Kustov, and N.V. Pronchatov-Rubtsov, Acoust. Phys. 51, 152 (2005).
- (4) G.S. Bisnovatyi-Kogan and S.A. Silich, Rev. Mod. Phys. 67, 661 (1995).
- (5) M. Ryutova and T. Tarbell, Phys. Rev. Lett. 90, 191101 (2003).
- (6) V.S. Tsoi, CEJP 1, 72 (2003).
- (7) G.V. Kolmakov, V.B. Efimov, A.N. Ganshin, P.V.E. McClintock, and L.P. Mezhov-Deglin, Phys. Rev. Lett. 97, 155301 (2006).
- (8) G. Falkovich and M. Meyer, Phys. Rev. E 54, 4431 (1996).
- (9) R.H. Kraichnan, Phys. Fluids 10, 1417 (1967); M. Chertkov, C. Connaughton, I. Kolokolov, and V. Lebedev, Phys. Rev. Lett. 99, 084501 (2007); J. Paret and P. Tabeling, Phys. Fluids 10, 3126 (1998); S. Nazarenko and M. Onorato, J. Low Temp Phys. 146, 31 (2007).
- (10) W.F. Vinen, M. Tsubota and A. Mitani, Phys. Rev. Lett. 91 135301 (2003); S. Nazarenko, JETP Lett 84, 585 (2007).
- (11) V.S. L’vov and V.B. Cherepanov, Sov. Phys. JETP 54 746 (1981).
- (12) A.I. Dyachenko and V.E. Zakharov, JETP Lett. 81, 255 (2005).
- (13) P.W. Anderson and H. Suhl, Phys. Rev. 100, 1788 (1955); V.S. L’vov, Wave turbulence under parametric excitation. Application to magnetics (Springer, Berlin, 1994); T. Matsushita, R. Nomura, H.H. Hensley, H. Shiga and T. Mizusaki J. Low Temp. Phys. 105, 67 (1996).
- (14) S.R. Spangler, J.A. Leckband and I.H. Cairns, Phys. Plasmas 4, 846 (1997).
- (15) D. Rinberg, V. Cherepanov and V. Steinberg, Phys. Rev. Lett. 76, 2105 (1996).
- (16) G.V. Kolmakov, A.A. Levchenko, M.Yu. Brazhnikov, L.P. Mezhov-Deglin, A.N. Silchenko and P.V.E. McClintock, Phys. Rev. Lett. 93, 074501 (2004).
- (17) L.D. Landau and E.M. Lifshitz, Course of Theoretical Physics, Vol. 6: Fluid Mechanics (Pergamon, New York, 1987).
- (18) A.J. Dessler and W.M. Fairbank, Phys. Rev. 104, 6 (1956).
- (19) A. N. Ganshin, V. B. Efimov, G. V. Kolmakov, L. P. Mezhov-Deglin and P. V. E. McClintock, “Second sound acoustic turbulence in superfluid 4He”, to be published.
- (20) V.L. Pokrovskii and I.M. Khalatnikov, Sov. Phys. JETP 44, 1036 (1976).
- (21) L. Mandelstam and N. Papalexi, Zeitschrift fur Physik 73, 223 (1932).
- (22) M. Onorato, A.R. Osborne, M. Serio, and S. Bertone, Phys. Rev. Lett. 86, 5831 (2001).
- (23) R.G. Dean, in: Water Wave Kinetics, Eds. A. Torum and O.T. Gudmestad, (Kluwer, 1990, p. 609).
- (24) D.R. Solli, C. Ropers, P. Koonath, and B. Jalali, Nature 450, 1054 (2007).