A Multi-Wavelength Infrared Study of NGC 891
Abstract
We present a multi-wavlength infrared study of the nearby, edge-on, spiral galaxy NGC 891. We have examined 20 independent, spatially resolved IR images of this galaxy, 14 of which are newly reduced and/or previously unpublished images. These images span a wavelength regime from m in which the emission is dominated by cool stars, through the MIR, in which emission is dominated by PAHs, to 850 m, in which emission is dominated by cold dust in thermal equilibrium with the radiation field. The changing morphology of the galaxy with wavelength illustrates the changing dominant components. We detect extra-planar dust emission in this galaxy, consistent with previously published results, but now show that PAH emission is also in the halo, to a vertical distance of 2.5 kpc. We compare the vertical extents of various components and find that the PAHs (from 7.7 and 8 m data) and warm dust (24 m) extend to smaller heights than the cool dust (450 m). For six locations in the galaxy for which the S/N was sufficient, we present SEDs of the IR emission, including two in the halo — the first time a halo SED in an external galaxy has been presented. We have modeled these SEDs and find that the PAH fraction, , is similar to Galactic values (within a factor of two), with the lowest value at the galaxy’s center, consistent with independent results of other galaxies. In the halo environment, the fraction of dust exposed to a colder radiation field, , is of order unity, consistent with an environment in which there is no star formation. The source of excitation is likely from photons escaping from the disk.
keywords:
ISM: molecules - galaxies: haloes - galaxies: ISM - infrared: ISM1 Introduction
In a wide variety of galactic environments, polycyclic aromatic hydrocarbons (PAHs)111In this paper, we adopt the term ”PAH” to describe the carriers of MIR spectral feature emission, whereas we refer to thermal continuum emission as dust emission. Note that some authors consider PAHs to be low mass carbon grains in their treatment of interstellar dust (e.g. Draine Li 2007b). are the dominant emitters in the Mid-Infrared (MIR) from about 5 - 15 m (Vogler et al. 2005, Smith et al. 2007, Galliano et al. 2008b). At longer wavelengths approaching the Far-Infrared (FIR), thermal emission dominates the spectral energy distribution (SED) (Galliano et al. 2008a). PAHs have been observed in many galaxies in locations often associated with star forming regions. However, new discoveries of PAH emission extending to significant distances (6 - 10 kpc) from the disks of several galaxies (Irwin & Madden 2006; Engelbracht et al. 2006; Irwin et al. 2007) raise important questions as to how these large molecules can be present at such high altitudes above the plane and also their source of excitation. Presumably, far-UV (FUV) emission from in-disk star forming regions provides the excitation. However, a fit to a SED is really required to understand both the contributions from various emission components (cool stars, PAHs, classical grains, etc.) as well as the stellar component that is required for the excitation. Better yet, a SED fit at different locations in a galaxy, especially at different locations in the disk and/or in extraplanar gas, can further help us to understand the complex interplay between various IR-emitting interstellar medium (ISM) components and the origin of the excitation.
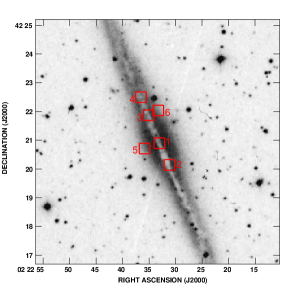
We have therefore chosen to study MIR-submm emission in a very well known edge-on galaxy, NGC 891 (Figure 1), that has known extraplanar emission in a variety of wavebands (e.g. H I, H, dust and CO - See Sect. 1.1). Since there is so much spatially resolved IR data available for this galaxy, it is an excellent target for modeling its SED at different positions in both the disk and halo regions. For this paper, we have examined and compared no less than 20 independent data sets222A m image was also examined, but found to be of too low spatial resolution to be useful. ranging in wavelength from 1.2 m to 850 m using both space-based and ground-based instruments (Sect. 2). To the limits of the variety of spatial resolution, coverage, and sensitivity achieved, we compare the extraplanar extent of the emission and, most importantly, we derive the SED at different disk and extraplanar locations.
Because of the proximity of NGC 891, its almost exactly edge-on orientation, its current active star formation (SF) and its prominent extraplanar emission (see Sect. 1.1), this galaxy has been a prime target for studies of the disk-halo interaction. Although the specific vertical height, , at which gas might be considered in the halo is debatable, a conservative estimate is 1 kpc (21.5 arcsec). Since all of the 20 data sets examined have higher resolution than 21.5 arcsec (see Sect. 2), it is possible to distinguish the disk from extraplanar (halo) region in the observations presented in this paper.
In the next section we describe NGC 891. In Sect. 2, we discuss the observations and data reduction. The morphology of NGC 891 is discussed in Sect. 3, and the SED results are given in Sect. 4. Sects. 5 and 6 present the discussion and conclusion, respectively.
1.1 NGC 891
NGC 891 (Figure 1, Table 1) is believed to be similar to the Milky Way (MW) in B-band luminosity, rotational velocity, and Hubble type. It is 2.5 times brighter in the IR, and may have twice as much gas and dust than the MW (see Scoville et al. 1993), although the difference is not strong, given uncertainties. There has been much discussion in the literature as to whether or not NGC 891 is a ‘starburst’ galaxy, since its star formation rate (SFR) appears to be intermediate between that of a normal spiral and a starburst galaxy; it may be in a phase that saw more powerful starbursting in the past (see Temple et al. 2005). NGC 891’s current SF activity is clearly indicated by a variety of measures, including the detection, in H, of many bubbles, shells, and supershells in the mid-plane of this galaxy (Rossa et al. 2004).
| parameter | value | reference |
| Hubble type | SA(s)b | RC3333RC3 = Third Reference Catalogue by de Vaucouleurs et al. (1991) |
| RA(J2000) | 02h 22m 33.4s | NED444NED = NASA Extragalactic Database (http://nedwww.ipac.caltech.edu/) |
| DEC(J2000) | + | NED |
| redshift | 528 km/s | NED |
| distance | 9.6 Mpc | Strickland et al. (2004) |
| optical major axis | 13.5 arcmin | RC3 |
| optical minor axis | 2.5 arcmin | RC3 |
| major axis angle | NED | |
| inclination angle | Baldwin Pooley (1973) | |
| rotational velocity | 225 km/s | Sofue (1997) |
| B band luminosity | 7.8 | RC3 |
| SFR | 3.8 /yr | Popescu et al. (2004) |
| (H I ) | 4.6 | Guelin et al. (1993) |
| Dupac et al. (2003) | ||
| 1.9 - 7 555The range reflects different results from various authors. | Alton et al. (2000) | |
| Popescu et al. (2004) | ||
| Galliano et al. (2008a) | ||
| 3.3 | Galliano et al. (2008a) |
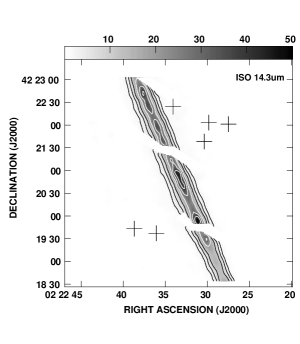
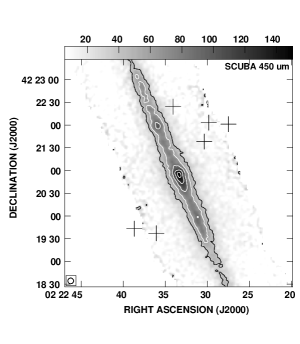
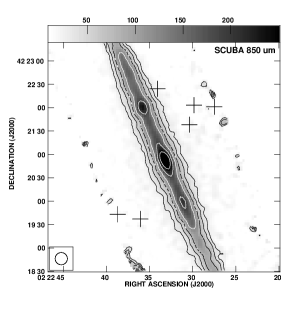
The molecular gas, as observed in CO, resembles that of the MW and is mainly confined to a thin disk (400 pc thickness) (Scoville et al. 1993) although a halo component is also observed (see below). Emission from cold dust (average temperature of 18 - 24 K; Dupac et al. 2003), as observed at 1.3 mm, 850 m and 450 m, correlates spatially with the molecular gas in the disk (Alton et al. 1998; Israel 1999). Spatial correlations have also been found between cold dust at 850 m, the 7.7 m PAH feature and very small grain (VSG) emission observed at 14.3 m that is not specifically associated with starburst regions (Haas et al. 2002).
As indicated in Sect. 1, NGC 891 has extended extraplanar gas in a variety of ISM components. The galaxy has widespread diffuse ionized gas (DIG) in its halo (Rossa Dettmar, 2003; Rossa et al. 2004) up to 2.2 kpc above the galactic plane. It is one of the brightest of all nearby edge-on spirals, suggesting pronounced disk-halo mass transfer (Alton et al. 2000). The H halo emission is more prominent and extended in the direction on the northern side of the galaxy than the southern. Some of this asymmetry may be explained by dust obscuration (Kamphuis et al. 2007), but Rossa et al. (2004) interpret this as being due to a higher SFR in the northern part of the disk than in the southern part. The assymetry is also seen in the radio continuum observations (Dahlem et al. 1994) and these are not affected by dust. They therefore, support the latter interpretation.
The broadest halo component is that of H I, which also shows a north-south asymmetry in disk thickness (Swaters et al. 1997), and is now known to extend up to at least 22 kpc above the galactic plane (Oosterloo et al. 2007). Also, the H I halo is asymmetric: It is clearly thicker in the north than in the south of the galaxy (Swaters et al. 1997). Molecular gas, as observed in CO, has been detected to 1 - 1.4 kpc above the plane (Garcia-Burillo et al. 1992). As for dust in the halo, optical absorption features have been detected to heights of 2 kpc (Howk Savage 2000). Burgdorf et al. (2007) have also detected 16 and m emission extending up to 5 kpc from the midplane. Recently, Rand et al. (2008) have obtained IR spectra showing the [NeII] and [NeIII] MIR lines of two positions in NGC 891’s halo which suggest that the radiation field may harden with height from mid-plane.
2 Observations and Data Reduction
This paper makes use of both archival data that we have reduced as well as previously published data. In this section, we first describe the data that we reduced ourselves and then the origin of the data sets that were obtained from others.
2.1 ISO Observations and Data Reduction
The Infrared Satellite Observatory (ISO) archive was accessed to obtain two previously unpublished data sets that were acquired in 1997 and 1998. The data were taken with ISO’s camera, ISOCAM, using the long wave channel, with narrow band filters, LW1, LW4, LW5, LW6, LW7, LW8, LW9, (centered at 4.5, 6.0, 6.8, 7.7, 9.6, 11.3, 14.9 m, respectively), and wide band filters, LW2 and LW3 (6.7 and 14.3 m, respectively). All of these observations were with the CAM01 observing mode, which is the standard mode for photometric imaging (Blommaert et al. 2003).
The galaxy was not completely contained in the field of view. Only 3.2 arcmin 3.2 arcmin (8.9 8.9 kpc) were viewed at a time, and the galaxy was not always centered in the field. There were multiple pointings which had to be mosaiced together (see below) to form the maps shown in Sect. 3.1. The raw data consist of a sequence of 2-dimensional frames taken at successive times for any given wavelength band, forming a ‘cube’ of data. Table 2 summarizes the observation parameters.
| wave bands | |||||||||
| Parameter | LW1 | LW4 | LW2(wide) | LW5 | LW6 | LW7 | LW8 | LW3(wide) | LW9 |
| central wavelength666Blommaert et al. (2003) (m) | 4.5 | 6.0 | 6.7 | 6.8 | 7.7 | 9.6 | 11.3 | 14.3 | 14.9 |
| wavelength rangea (m) | 4.0-5.0 | 5.5-6.5 | 5.0-8.5 | 6.5-7.0 | 7.0-8.5 | 8.5-10.7 | 10.7-12.0 | 12.0-18.0 | 14.0-16.0 |
| TDT number777a unique number that identifies the observation. | 65101201 | 65101201 | 65101201 | 65101201 | 65101201 | 65101201 | 65101201 | 65101201 | 65101201 |
| 84101766 | 84101766 | ||||||||
| pixel field of view888See text Sect. 2.1 (arcsec) | 6.0 | 6.0 | 6.0 | 6.0 | 6.0 | 6.0 | 6.0 | 6.0 | 6.0 |
| PSF999The point spread function (PSF) full width at half maximum (FWHM). (FWHM) (arcsec) | 7.3 | 7.3 | 7.3 | 7.9 | 7.9 | 7.9 | 7.9 | 7.9 | 8.4 |
| date of observation | 28 Aug 97 | 28 Aug 97 | 28 Aug 97 | 28 Aug 97 | 28 Aug 97 | 28 Aug 97 | 28 Aug 97 | 28 Aug 97 | 28 Aug 97 |
| 5 March 98 | 5 March 98 | ||||||||
| no. of on-source pointings101010This is the number of different pointing positions on-source. | 7 | 7 | 15 | 7 | 7 | 7 | 7 | 15 | 7 |
| mean frames/pointing | 16 | 16 | 13 | 16 | 13 | 16 | 16 | 16 | 16 |
| integration time per frame (s) | 10.08 | 10.08 | 10.08 | 10.08 | 10.08 | 10.08 | 10.08 | 10.08 | 10.08 |
| total on source time111111Total integration time per on-source pointing times the number of on-source pointings. (min) | 18.8 | 18.8 | 36.8 | 18.8 | 15.3 | 18.8 | 18.8 | 40.3 | 18.8 |
| sky coverage (arcmin) | 3.2 | 3.2 | 3.2 | 3.2 | 3.2 | 3.2 | 3.2 | 3.2 | 3.2 |
| RMS of final maps (MJy/sr) | 0.12 | 0.14 | 0.13 | 0.22 | 0.16 | 0.10 | 0.28 | 0.19 | 0.19 |
| dynamic range of final maps121212maximum of map divided by the RMS (noise) of final map. | 189 | 202 | 370 | 167 | 600 | 119 | 138 | 136 | 91 |
For the data reduction, we used the Cam Interactive Reduction (CIR) package (Chanial 2003) which runs in Interactive Data Language (IDL). A thorough review of the data reduction procedures can be found in Galliano (2004).
We first performed a dark correction following the characterization of Biviano et al. (1998). A second-order correction is also carried out during this step, depending on the detector temperature and the time since activation, and a short-drift correction is applied.
Cosmic rays were then removed by running an automatic multi-resolution de-glitching routine which masks the glitches that are short in duration and have an intensity above 6 (where is the noise level). Further manual de-glitching was then carried out, frame by frame, to remove the remaining glitches that did not meet these criteria. These were typically pixels that were immediately adjacent to ones that had been automatically deglitched.
Memory effects caused by non-instantaneous temperature changes in the photoconductors were then corrected using the Fouks-Schubert (1995) method and the Wozniak implementation (see Galliano 2004).
We removed a narrow border of each frame, since the pixels at the very outer edges of the CCD have higher noise. This step has not significantly reduced the field of view because the various individual frames overlap spatially and the final field of view is dictated by the mosaic of these frames.
The data were separated into blocks of frames corresponding to each wave band. The blocks were then registered to the same sky position and medianed together to create a single image at each wave band.
We then flat fielded each image using flat fields maintained in a flat library at the ISO Data Center and also corrected for flat distortion which is a known ISOCAM error. At this point, the data were calibrated into mJy/pixel units using the calibration terms given by Blommaert et al. (2003).
Background emission was measured in a region that was far from the main emission (greater than 15 kpc). This background emission was then subtracted from the image.
Finally, we created error maps for each wave band (not shown), which represent pixel-by-pixel RMS values derived during cube contraction, propagating through errors in the various processing steps.
The remaining source of error not included in the error maps is the ISOCAM absolute flux calibration error, which does not affect the pixel-by-pixel variation within a given image. The calibration error is by far the largest of the errors, at about 20 (Pagani et al. 2003; Coia et al. 2005).
2.2 Spitzer Observations and Data Reduction
We use Spitzer Space Telescope data with both the Multiband Imaging Photometer (MIPS) as well as the Infrared Array Camera (IRAC). Observing and map parameters for the Spitzer data can be found in Table 3.
MIPS scan map data were only initially available for Astronomical Observation Requests 14815744, 14815488, and 14816000, which were data taken as part of an observing program led by C. Martin, so only those data were used in our analysis. The raw data were processed and combined into final mosaics using the MIPS Data Analysis Tools version 3.06 (Gordon et al. 2005). The data processing for the 24 m data differs significantly from the 70 m data, so the data reduction procedures are given separately.
The individual 24 m frames were first processed through a droop correction (removing an excess signal in each pixel that is proportional to the signal in the entire array) and were corrected for non-linearity in the ramps. The dark current was then subtracted. Next, scan-mirror-position dependent flats were created from the data in each Astronomical Observation Request (AOR) and were applied to the data to remove dark spots in the image that are caused by contamination on the MIPS scan mirror. Scan-mirror-position independent flats were created from the data in each AOR and were applied to the data to remove negative latent images from observations of bright objects that preceded the individual AORs and to correct sensitivity variations across the detector. Following this, the zodiacal light emission was fit with a third-order polynomial function in each scan leg, and the function was then subtracted from the data. A robust statistical analysis was then applied in which the values of cospatial pixels from different frames were compared to each other, and statistical outliers such as cosmic rays were masked out. After this, a final mosaic was made with pixel sizes of 1.5 arcsec, any residual background in the image was subtracted, and the data were calibrated into astronomical units using the calibration term 0.0447 MJy sr-1 . The uncertainty in the calibration is 4%. While the FWHM of the PSF is arcsec, significant extended emission from the Airy rings can be found outside the central peak.
In the 70 m data processing, the first step was to fit ramps to the reads to derive slopes. In this step, readout jumps and cosmic ray hits were also removed, and an electronic nonlinearity correction was applied. Next, the stim flash frames taken by the instrument were used as responsivity corrections. The dark current was subtracted from the data, and an illumination correction was applied. Short term variations in the signal (often referred to as drift) were removed from the data, which also subtracted the background from the data. Next, a robust statistical analysis was applied to cospatial pixels from different frames in which statistical outliers were masked out. Once this was done, final mosaics were made using square pixels of 4.5 arcsec. The residual backgrounds were measured in regions outside the optical disk of the galaxy and subtracted, and then the flux calibration factor of 0.2 MJy sr-1 was applied to the data. The uncertainty in the calibration term was 7%. The final image is very strongly affected by bright and dark streaks outside the plane of the galaxy that are related to latent image effects. Also, while the FWHM of the PSF is arcsec, significant extended emission from the Airy rings can be found outside the central peak.
Aside from uncertainties in the MIPS calibration terms indicated above, there are additional non-linearities and other effects which we estimate puts errors on flux measurements, when comparing with other bands, of order 10 to 15%.
The IRAC observations at 3.6, 4.5, 5.8, and 8.0 m were taken from the Spitzer archive. These are the post-basic calibrated data (data that are already reduced and calibrated) in four MIR wave bands: 3.6, 4.5, 5.8, and 8.0 m. These data were part of the Brown Dwarf Galaxy Haloes observing program led by Giovanni Fazio (Program ID #3). Calibration uncertainties are of the order of 5% (Reach et al. 2005).
Additional data reduction on these IRAC data were as follows: First, a sky subtraction was performed on each band. Then, maximum ‘infinite aperture’ corrections of 0.94, 0.94, 0.78, and 0.74 have been recommended for the 3.6, 4.5, 5.8, and 8.0 wavebands, respectively (Reach et al. 2005) for extended sources. Since these corrections are of order of the absolute calibration error for the 3.6 and 4.5 micron bands, we make no corrections for those bands. For the longer wavelength bands, however, we have applied a correction for all disk emission flux measurements in the amount of 0.94 and 0.78 at 5.8 and 8.0, respectively. These values assume that the maximum error must be applied in a direction along the disk whereas the disk is well defined and finite in the z direction (see Figure 9 plus the Spitzer website131313http://ssc.spitzer.caltech.edu/irac/calib/extcal/). Since infinite aperture corrections are unknown for the halo regions, we omit the 5.8 and 8.0 m data points in the SED halo calculations (Section 4.3). The displayed maps are shown without this correction.
For additional IRAC details and map rms, we refer to Table 3.
2.3 2MASS and JCMT Observations
The remaining data sets include the 2 Micron All Sky Survey (2MASS) images in the J, H and K bands, which were obtained from the Skyview archive141414http://skyview.gsfc.nasa.gov/cgi-bin/skvadvanced.pl (Jarrett et al. 2003), as well as the Sub-millimeter Common User Bolometer Array (SCUBA) data of the James Clerk Maxwell Telescope (JCMT) at 450 and 850 m which were kindly supplied by E. Xilouris (see Alton et al. 1998). Calibration uncertainties are approximately 2 for 2MASS (Cohen et al. 2003) and 15 - 25 for SCUBA (Alton et al. 1998 and Tilanus 2005).
For the SCUBA data, we adopt the estimates of Israel et al. (1999) who indicate that about 5% CO(3-2) contamination may be in the 850 m band with 10% toward the nuclear region, and that negligible CO(6-5) contamination is in the 450 m band. Since these are less than the calibration uncertainties, we do not correct for CO in these bands.
For observation and map parameters for these data, see Table 4.
2.4 Final Maps
For comparative purposes, all data were regridded to the same pixel size (1 arcsec) and the flux converted to units that could be compared, map to map. The units are therefore, either mJy arcsec-2 or MJy sr-1 (note that the conversion from mJy arcsec-2 to MJy sr-1 requires a multiplication by 42.55). Most data in this paper are presented in MJy sr-1 units, though we have also retained the original Jy beam-1 units for the JCMT/SCUBA data to present those maps in a form that is standard at those wavelengths.
| Parameter151515See Table 2 for explanation of parameters that are not described here. | Spitzer/IRAC | Spitzer/MIPS | ||||
| reference wavelength161616The reference wavelength is the name for the wave band that is often used in the literature. (m) | 3.6 | 4.5 | 5.8 | 8.0 | 24 | 70 |
| central wavelength171717The central wavelength is the actual center of the wave band. (m) | 3.6 | 4.5 | 5.8 | 8.0 | 23.68 | 71.42 |
| bandwidth181818Wavelength range of filter. (m) | 1.0 | 1.0 | 1.5 | 3 | 8 | 20 |
| pixel field of view (arcsec) | 1.2 | 1.2 | 1.2 | 1.2 | 1.5 | 4.5 |
| PSF (FWHM) (arcsec) | 1.9 | 2.0 | 1.9 | 2.2 | 6 | 18 |
| date of observation | 8 Sept 2004 | 8 Sept 2004 | 8 Sept 2004 | 8 Sept 2004 | 4 Sept 2005 | 4 Sept 2005 |
| RMS of final maps (MJy/sr) | 0.026 | 0.018 | 0.023 | 0.057 | 0.048 | 0.050 |
| dynamic range of final maps | 136 | 169 | 309 | 611 | 587 | 490 |
| Parameter | 2MASS | JCMT/SCUBA | ||||
| waveband191919Name of wave band. (m) | J | H | K | 450 m | 850 m | |
| central wavelength (m) | 1.24 | 1.66 | 2.16 | 442 | 862 | |
| bandwidthd (m) | 0.162 | 0.251 | 0.262 | 50 | 130 | |
| PSF (FWHM) (arcsec) | 1 | 1 | 1 | 7.5 | 15.7 | |
| RMS of final maps | 1.7 MJy/sr | 3.1 MJy/sr | 2.8 MJy/sr | 0.83 Jy/beam | 0.010 Jy/beam |
3 Results
3.1 IR Images and Emission from the Disk
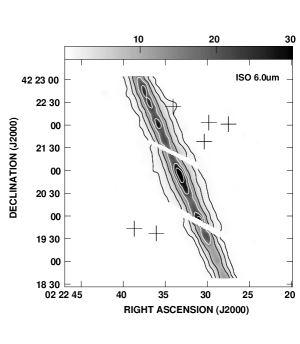
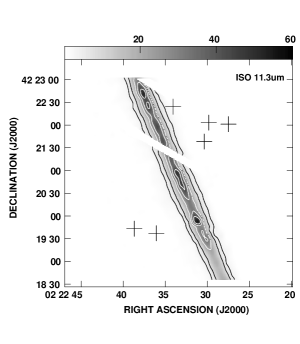
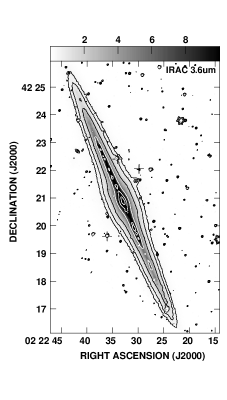
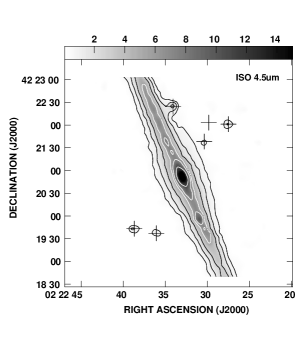
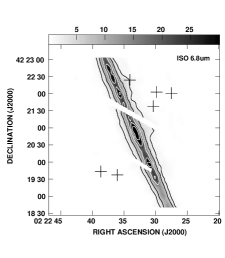
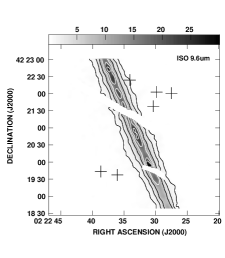
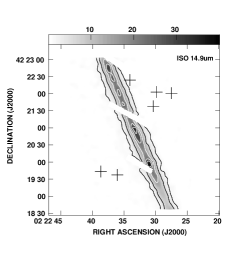
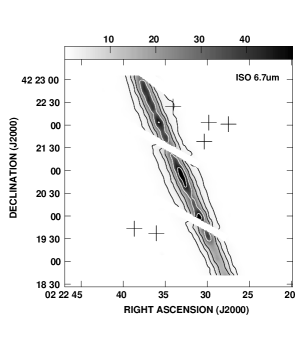
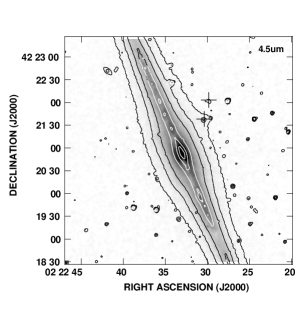
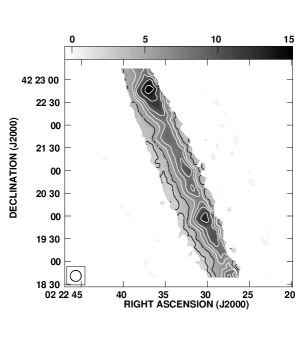
Figures 2 - 4 and 13 - 16 show the MIR surface brightness of NGC 891 in both contours and grey scale. The ISO 7.7 m narrow wave band and the IRAC 8 m wave band are particularly good at selecting PAH spectral features and are shown in Figure 2 (with the other ISO PAH bands shown in Figure 13). The 4.5 m wave band is shown in Figure 3, and the 5.8 m wave band is shown in Figure 4. Figure 16 shows the two wide bands from ISO. In each figure the foreground stars have been indicated by small crosses202020Foreground stars were identified using the 2MASS K band map. and the dead pixel column is contained within the blanked white region of the ISO images.
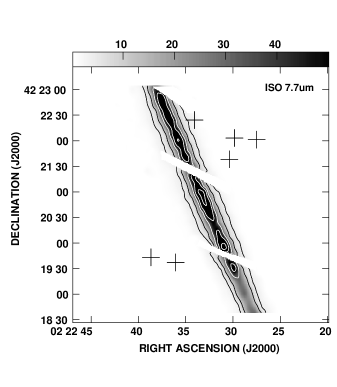
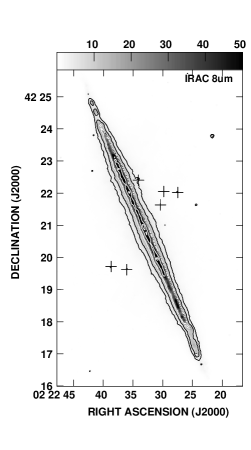
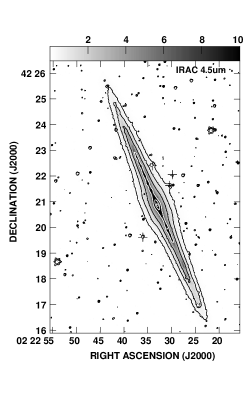
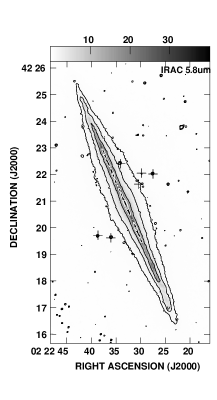
Figures 2 - 4 (and 13 - 16) show that most of the emission is coming from the disk of the galaxy, especially from the location of the central dust lane. These surface brightness maps show prominent peaks toward the nucleus and secondary maxima on either side of the center. These secondary peaks are associated with spiral arms and bright H II regions (Kamphuis et al. 2007). Figure 3 shows that the contours at 4.5 m form a bulge at the center, whereas at longer wavelengths, we do not see this bulge. Comparison of major axis profiles (not shown) also reveal substantial differences between the short and long wavelength emission. This change in morphology with increasing wavelength illustrates the changing dominance of spectral components. The 3.6 m wave band contains the 3.3 m PAH feature and Le Coupanec et al. (1999) concluded that the 4.5 m flux in NGC 891 contained a strong warm dust component. However, Figure 5, which shows the emission contours in these two wave bands overlaid on a stellar map (2MASS K band), shows an excellent correspondence between all three bands. This suggests that the 3.6m and 4.5 m bands are dominated by starlight, a result that is borne out by our SED results (Sect. 4.3). We are therefore in agreement with most of the results from SINGS and other Spitzer studies, which have demonstrated that the 3.6 and 4.5 m emission is almost entirely stellar in origin (Draine et al. 2007b; Smith et al. 2007).

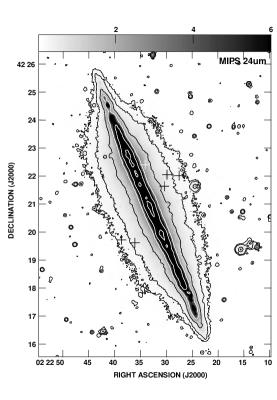
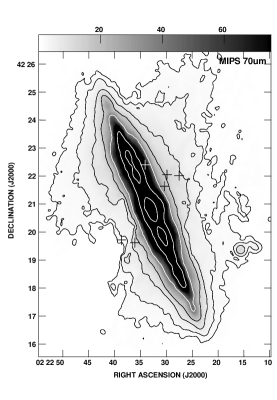
Figures 6 and 17 show the warm to cold dust emission as wavelength increases from 24, through 70, 450, and 850 m. Comparing these maps with Figures 2 - 4 and 13 - 16, we find that, along the plane of NGC 891, the local maxima of emission for PAH-sensitive bands are at similar locations as the local maxima for both warm dust and cold dust. Therefore, to first order, PAHs and dust emission correlate in the disk. This result is likely simply a statement that where there is a density enhancement of dust, there will also be a density enhancement of molecular material and PAHs as well. The dust temperature and source of PAH excitation, however, impose additional important constraints on the apparent distribution of these components. PAHs and cold dust are known to be correlated from previous work (Haas et al. 2002; Bendo et al. 2008), suggesting that PAH excitation is possible from a widespread stellar FUV-emitting population, rather than in SFRs alone.
As for warm and cold dust, we investigate the relationship between these components via the 24 m to 850 m surface brightness ratio map, after first smoothing the 24 m map to the same resolution as the 850 m map. The result is shown in Figure 7. From this figure, it seems that the cold dust emission (850 m) is slightly more extended, since the ratio tends to decrease outward. This agrees with our results for the distribution as well (see Sect. 3.3). In addition, in the disk there are two “blobs”, or maxima, in the ratio, on either side of the centre identifying regions in which the dust is hotter than average. The southern maximum is located at the same position as the surface brightness maxima seen in the previous maps (Figures 2 - 5 and 17). The northern ratio maximum is located further away from the centre, at a declination of 42∘ 22′ 45′′. Both these maxima are located in regions in which the H emission is also prominent (e.g. see the H map in Kamphuis et al. 2007). The dust heating is likely related to in-disk star forming regions at these locations.
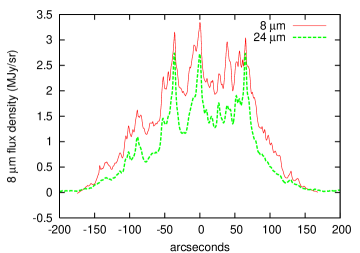
3.2 Major Axis Profile
On large scales, Swaters et al. (1997) found a north-south asymmetry in the HI emission, such that the southern emission is more extended radially along the major axis. Popescu & Tuffs (2003) subsequently found a similar result in the 200 m emission. Asymmetries have also been seen in the molecular distribution (see Sofue & Nakai 1993). Given the correlations between bands indicated above, we investigate whether any global asymmetries are present in our data using a representative PAH band which we take to be the Spitzer IRAC 8 m data (Figure 2), and the Spitzer MIPS 24 m data (Figure 6) since the entire galaxy has been imaged in these wavebands (as opposed to the narrower band but truncated ISO images of Figure 2). The result is shown in Figure 8. Since the noise is very low (see figure caption), virtually all the structure seen in this profile is real. The broadscale distribution of emission is consistent with what has been seen at other MIR wavelengths (e.g. Dupac et al. 2003) and this PAH profile also compares well with the lower spatial resolution ISOPHOT observations (Mattila et al. 1999, their Figure 5a). However, to our knowledge, Figure 8 presents the highest resolution and highest S/N major axis profile yet obtained.
The profile shows a peak at the centre and two broad peaks on either side which, together form a broad 200 arcsec central plateau of PAH emission. This emission contains the most active part of the disk encompassing the nucleus and the secondary peaks at -40 arcsec (south of the nucleus) and +40 arcsec to +60 arcsec (north of the nucleus). Much substructure is also visible. As for asymmetries, we can say that there is some enhancement on the northern side within a radius of 150 arcsec and a minor enhancement towards the south at radii larger than this.
3.3 The Vertical Distribution & Extraplanar Emission
The ‘edges’ of the emission shown in Figures 2 - 4 and 13 - 16 are not smooth and show varying widths as a function of location in the disk. Discrete extensions, such as seen in other galaxies (e.g. Irwin et al. 2007) or in the DIG of this galaxy (Rossa Dettmar 2003, see Sect. 1.1) are not prominent at the S/N of these data, although there are hints of such discrete features at slightly lower S/N. We know that vertical discrete features are indeed present in the dust distribution from the optical absorption observations of Howk & Savage (1997) and the H observations of Rossa et al. (2004).
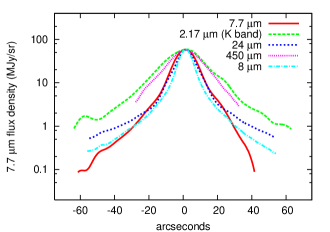
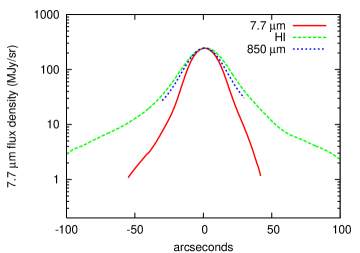
To further investigate the presence of extraplanar dust in these data, we have averaged the emission parallel to the major axis (within 2.5 arcmin radially from the minor axis) to create an average vertical profile. While such averaging removes information about any discrete features, it does increase the S/N, improving the possibility of detecting widespread high latitude dust. We have also taken a subset of the data sets and smoothed them to a common spatial resolution (either 7.9 arcsec or 20 arcsec) so that we can compare the vertical extent of the emission in various bands. Results are shown in Figure 9, in which a typical profile (in this case the narrow band 7.7 m ISO PAH band) is shown in linear scale to emphasize the exponential fit, and in a log scale in Figures 10 and 11 which compare the various profiles at 7.9 arcsec and at 20 arcsec resolution, respectively. As was the case for the major axis profile, these average slices have very small vertical error bars (see Figure captions), and have been omitted from the figures for clarity. The main error, for the purpose of comparing the width of the emission in the various wavebands, is in the horizontal direction, associated with the spatial resolution ( 4 arcsec for Figures 9 and 10, and 10 arcsec for Figure 11).
Figure 9 is a typical MIR vertical profile and shows that an exponential fall-off of emission fits the data well in both the core and wing region. This is also true of the other MIR bands (fits not shown, but see also the exponential fits of Burgdorf et al. 2007 and Rand et al. 2008). We have illustrated the narrow band 7.7 m ISO profile in particular, since it is excellent at isolating PAH emission. Note that the wider waveband 8 m IRAC profile matches the 7.7 m ISO profile to within errors (cf. Figure 10). Single-component exponentials fit all data sets well, although some departures are seen at very low levels. The exponential scale heights that result from these fits, , are not sufficiently different from the spatial resolution to be convincingly presented. However, of the dust-related data sets at their original un-smoothed resolution, the IRAC m and IRAC m data sets have high enough spatial resolution (Table 3) for a measurement. For these, we find (over the same 5 arcmin averaged region as Figure 9) pc and pc at and m, respectively, where the error bars are dominated by the variation between the north-west and south-east sides of the galaxy. Our scale height for the PAH-dominated m band over this averaged region is slightly lower than the single-component estimate of 330 - 530 pc found for m PAH emission measured at a single position by Rand et al. (2008). Given the possible effects of unknown in-disk extinction on the vertical scale height (see Rand et al. 2008) as well as uncertainties related to aperture corrections for the IRAC data (Sect. 2.2), two-component fits are not warranted.
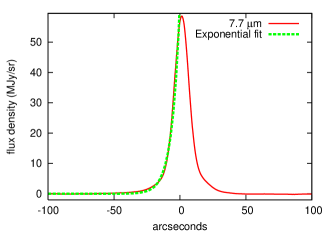
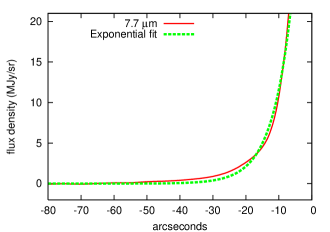
Figure 10 shows a comparison between bands at high spatial resolution, for which the error in is 4 arcsec, or 0.2 kpc. The logarithmic scale emphasizes lower levels for which there are some departures from perfect exponentials. The broadest component is clearly in K band, due to the dominance of starlight in this band and the presence of the galaxy’s bulge. The cool dust component, illustrated by the 450 m emission, is the widest dust band and is measured to 29 arcsec (1.3 kpc) at 3 (average of both sides of the vertical profile). The PAH emission (7.7 and 8 m) and warm dust emission (24 m) have widths that agree within errors. Also, their measurable maximum extents are to 49 arcsec (2.3 kpc), 53 arcsec (2.5 kpc), and 54 arcsec (2.5 kpc) at 7.7, 8 m, and 24 m, respectively, again agreeing within errors. Although the maximum extent of the various components depends on the varying S/N, it is clear that each of these components reveal emission at in excess of 1 kpc. It is therefore clear that NGC 891 has extraplanar emission in warm dust, cool dust, and PAHs. Kamphuis et al. (2007) have also recently examined the MIPS 24 m emission from NGC 891 and find emission to of 2.3 kpc, in agreement with our results. Burgdorf et al. (2007) have also found extraplanar dust emission extending to 5 kpc, at a specific location rather than an average, and at the wavelengths, 16 and 22 m.
As for the lower resolution profiles (Figure 11), the spatial resolution (20 arcsec = 0.9 kpc) is less useful for examining extraplanar gas quantitatively. However, it is apparent that the H I distribution is widest (see also Sect. 1), followed by cold dust at 850 m and PAHs.
4 Spectral Energy Distribution
4.1 Constructing the SED
We have constructed spectra using the flux from different regions of the galaxy in each of the wave bands. The adopted boxed regions are shown in Figure 1 and described in Table 5. They represent a potential diversity of environments within which the S/N of the data was sufficient at all wavebands for good results. Each box is 18 arcsec 18 arcsec (838 pc 838 pc) in size, a value chosen because all images were smoothed to 18 arcsec resolution to match the lowest resolution 70 m data before the measurements were made. The four in-plane boxes represent the centre of the galaxy and three disk regions. The centre contains the disk that passes along our line of sight (old and young stars and ISM), old stars from the bulge and the nucleus. The disk region in the southern half is located at a local maximum. Although there may be some contributions from the bulge to the northern and southern disk regions, our results for these regions should be strongly dominated by the disk components that are along the line of sight. All in-disk regions fall within the broad plateau of emission shown in Figure 8 including the outer north disk at a radial distance of 96 arcsec (4.47 kpc). Finally there are two halo regions, each centered between 1 and 2 kpc above the plane. These regions should therefore provide one of the first MIR spectra of halo ISM in an external galaxy (with Rand et al. 2008 being the only other one at the time of this publication).
For the flux measurements, the error bars are due to the published flux errors given for each instrument. To summarize from Sect. 2, these are approximately 20 for ISOCAM, 5 for IRAC, 4 - 15% for MIPS, 2 for 2MASS, and 15 - 25 for SCUBA. These are the errors that dominate when comparing between different wave bands. We present the spectra fitted by SED models in Figure 12. Note that we only use upper limits for the 70 micron measurements of the halo because the extraplanar region is severely affected by latent image effects that create streaking in the images. This data point is carrying lower weight in the SED modelling. The next section describes this model.
| name of | RA DEC212121Coordinates refer to J2000.0 | offset (R, )222222Distance from the center of the galaxy along and perpendicular to the major axis, respectively. | |
|---|---|---|---|
| region | (h m s), (∘ ′ ′′) | (kpc, kpc) | |
| 1 | centre | 2 22 33.092, 42 20 50.26 | 0, 0 |
| 2 | south disk | 2 22 30.928, 42 20 05.26 | 2.51, 0 |
| 3 | inner north disk | 2 22 35.258, 42 21 52.26 | 2.79, 0 |
| 4 | outer north disk | 2 22 37.153, 42 22 30.26 | 4.47, 0 |
| 5 | central halo | 2 22 30.927, 42 21 06.26 | 0, 1.40 |
| 6 | halo over disk | 2 22 33.002, 42 21 59.26 | 2.79, 1.26 |
4.2 Modeling the SED
The model we use fits the observed SEDs for a situation in which a
variety of dust components with realistic optical properties are
exposed to an incident radiation field from a mixture of stars, all
within the same beam.
The model includes the following IR emission sources:
1) PAHs - which can be singly ionized () or neutral (),
2) Dust - which include VSGs and large grains composed of graphites and silicates, and
3) Old Stars
We adopt the dust size distributions derived by Zubko et al. (2004) by fitting the diffuse Galactic ISM emission, extinction and depletion patterns, with PAH, graphite and silicate grains, and assuming solar abundances. Thus we are assuming that the instrinsic dust properties in NGC 891 are similar to the ones in the MW. In fact, this is a good assumption because both galaxies are solar metallicity spiral galaxies (12+log(O/H)=8.9, Otte et al. 2001). The PAHs are assumed to have the optical properties (e.g. absorption cross sections) from Draine Li (2007a). Note that, for the purpose of the model, PAHs will be included in the ‘dust’ component, rather than considered as ‘large molecules’, given the similarity between the largest PAHs and smallest carbon grains. Thus the model parameter, , represents the total dust mass; this includes PAHs, graphites and silicates.
The PAH component introduces two parameters: the mass ratio of PAHs to total dust normalized to the Galactic value of 0.046 ():
| (1) |
and the ratio of ionized PAHs to total PAHs ():
| (2) |
where and are the masses of the neutral and ionized PAHs respectively, and = + .
The stellar continuum makes a large contribution to the SED at NIR wavelengths. It needs, as a free parameter, the total stellar mass, . is used to compute the stellar emission, 232323The subscripts or indicate that this is a monochromatic term, and the in brackets indicates a wavelength dependence.. Note, however, that the resulting value for is not actually a proper measurement of total stellar mass. The latter would require data at shorter wavelengths, different extinction geometries, varying the stellar age and eventually the Initial Mass Function (IMF). Rather, is a parameter that is varied to understand the contribution from evolved stars into the MIR.
The dust must be excited by optical-UV radiation to emit. We adopt the shape of the interstellar radiation field (ISRF) of the Galactic diffuse ISM by Mathis et al. (1983), .
The adopted ISRF, U, is normalized by the local Solar neighbourhood value (taken to be 2.2 10-5 W m-2):
| (3) |
where the lower limit on the integral is set at the Lyman break and the upper limit approximates the value at which excitation is no longer significant.
The monochromatic luminosity of dust exposed to U per unit dust mass, , is:
| (4) |
This monochromatic luminosity can be expressed as a sum of the three dust components (PAHs, silicate and graphite):
| (5) |
Here (U,), where N = , , sil. and gra., are the luminosities of the ionized PAHs, neutral PAHs, silicates, and graphites respectively.
With an admixture of dust components in an interstellar radiation field, we then need to consider the possible range of environments within which these components could be found. Following Dale et al. (2001), this can be done via the parameter, , which relates the heated dust mass, , to the radiation field, U:
| (6) |
between and . The range of , which is defined by Eqn. 6 is typically 1 to 2.5, depending on whether the dust is in a diffuse medium ( 2.5) or whether the dust is in a dense medium ( 1). Since the area measured contains contributions from both kinds of media, the from the model is a characteristic value for the measured region and will likely fall somewhere between 1 and 2.5.
Therefore, with Equations (4) and (6), and the stellar component added, the total SED can be expressed as
| (7) |
where the optical depth, = AV/1.086, (and AV is the visual extinction), and L*() comes from Fioc Rocca-Volmerange’s (1997) model242424The NIR old stellar continuum is roughly independent of the age of the populations for a burst 1 Gyr. The stellar continuum is modeled with the population synthesis code PEGASE. for a burst of 5 Gyr and a mass of stars, . The term accounts for the extinction in the ‘slab’ geometry that we have adopted. Note that the visual extinction, AV, is constrained by the J, H, and K band ratios. A ‘true’ value of AV requires additional measurements at visible wavelengths, so this extinction should be deemed ‘representative’, rather than exact, and useful for comparing different regions in the galaxy.
To summarize, the eight parameters the model is fitting are:
-
•
The mass of dust () in units of ,
-
•
The ratio of mass of PAHs to mass of dust normalized to the Galactic value (0.046) (),
-
•
The ratio of mass of ionized PAHs to total PAHs (),
-
•
The mass of the old stellar population () in units of ,
-
•
Minimum and maximum heating intensities ( respectively) normalized to the local radiation environment (2.2 W m-2),
-
•
The visual extinction (AV), and
-
•
defined in Equation 6.
Finally, we note that the parameters , and do not have a strong physical meaning when taken independently. However, these parameters together quantify the distribution of dust mass through different environments. The fraction of dust mass exposed to radiation densities lower than (corresponding to a silicate equilibrium temperature of 25 K) is:
| (8) |
These quantities will also be calculated from the model.
This model is integrated within each filter, with the proper flux convention, and then compared to the observations, by minimizing the . In addition, we estimate the error on the value of the parameters as follows. For each observed SED, , with error bars , we perform several fits of , where are independant normally distributed random variables. Therefore, such a fit provides the values of the parameters for one particular realization of the error bars. By iterating over several sets, we obtain the distribution of each parameter value. The dispersion of this distribution provides the error bar on the parameter.
4.3 SED results for NGC 891
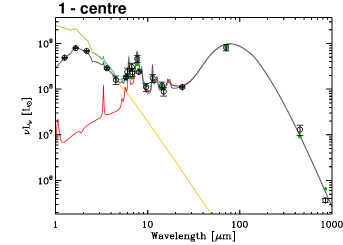
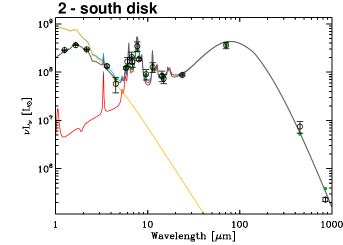
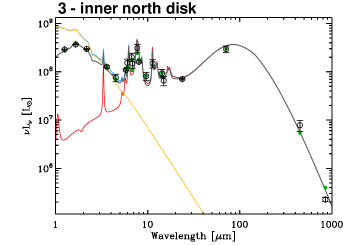
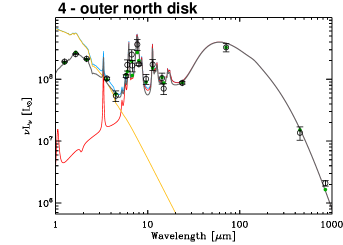
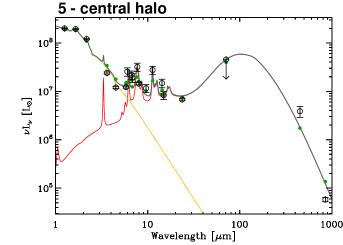
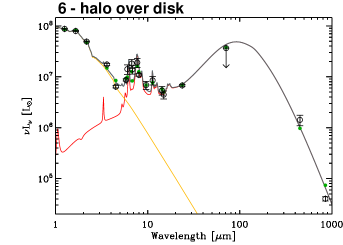
Figure 12 shows the observed SEDs for the six measured regions in NGC 891 as well as the model fits. The yellow line represents the stellar contribution corrected for extinction, the red line represents the dust and PAH contribution, the grey line is the total line of best fit and the blue line is the SED without extinction. The data points are circles with error bars and the green points are the model results in the observed bands.
In general, the model results agree with the data to within estimated errors throughout the NIR to the sub-mm. The exceptions are the 450 m points, which are often too high. One possibility is that the observed discrepancy is real and that the dust properties in this part of the spectrum are peculiar. However, it is also possible that the 450 m fluxes may be in error. We have accepted the original calibration from previously published results at this wavelength (Sect. 2.3) and both Israel et al (1999) and Alton et al. (1998), who observed this galaxy with 2 independent sets of observations, give consistent flux values. Nevertheless, the total error for this point may have been underestimated.
The FIR flux densities in the models peak at shorter wavelengths (hotter) compared to what has been observed in many other galaxies (e.g. Dunne Eales 2001; Bendo et al. 2003; Dale et al. 2005; Draine et al. 2007b). For example, a better constrained total SED peaks at around 100 m (Galliano et al. 2008a), whereas many of our SEDs are peaking at about 60 - 70 m (Figure 12). However, in this case, it is the relatively low 850 m fluxes that prevent the SEDs from having a more powerful cold component. Adding additional FIR data in the 100 - 200 m range would tend to make the SEDs a little colder, but it would also make the fit of the SCUBA data even worse. Nevertheless, given that each region has data points at the same wavelengths, the SED model results for the various regions can still be compared to each other in a meaningful way.
The four in-disk regions all show similarly shaped SEDs which peak in the 70 to 80 m wavelength regime, including the outer north disk which might have been expected to show a ‘colder’ (longer wavelength) peak given its larger radial offset from the center (Table 5). However, as indicated in Section 4.1, the position of the outer north disk point is 96 arcsec from the centre which coincides with a broad peak in the H emission (see image in Kamphuis et al. 2007). It also corresponds to a peak in the surface brightness profile along the disk (see Figure 8). Therefore, its SED is likely more representative of a SF region than of the far outer regions of a typical galactic disk. The halo SEDs, on the other hand, do peak at longer wavelengths suggesting the dominance of colder dust at high latitudes. Adopting lower 70 m values should not change this conclusion.
The halo SEDs differ from the disk SEDs in other significant ways. First of all, they show an overall lower surface brightness by about a factor of 10 (see absolute values on ordinate axes, the apertures being indentical), as might be expected for a faint halo region. They also reveal that virtually no extinction (by our representative AV, see Section 4.2) is required to match the NIR emission which is dominated by starlight. Again, this is not surprising, given the contrast between observing stellar emission through a dense dusty, edge-on disk, or observing starlight in a faint halo region with mainly diffuse tenuous dust.
The other contrast between the halo and disk SEDs are in the relative brightness of the MIR in comparison to other parts of the spectrum. The halo SEDs show a lower brightness in the MIR, where PAHs are the dominant contributor, in comparison to disk SEDs. For example, the three in-disk regions (not including centre) all show similar ratios of PAHs to old stars, as measured by the 7.7 m peak to the dust-corrected 1 m peak ratio, ranging from 0.6 to 0.9. However, this ratio in the halo is somewhat depressed in comparison to the disk, with values in the range 0.2 to 0.4. As we showed in Figure 10, the stellar halo, as measured by the K-band flux, is also broader than the 7.7 m halo emission. Therefore, the lower PAH/stellar ratio in the halo is consistent with the vertical distribution seen earlier.
PAHs in the halo are also depressed in comparison to cold dust. The three in-disk regions (again, not including the central region) show similar PAH/cold dust ratios, as measured by the 7.7 m peak to the FIR peak ratio. We cannot compare this ratio directly for the halo SEDs since the latter do not have well defined peaks, with only upper limits at 70 m. Using the 7.7 m/850 m ratio instead to probe the PAH/cold dust emission, we find that the disk SEDs have significantly higher ratios, of order 2000, whereas the halo ratios are of order 300.
Thus, there is a deficit of PAH emission in the halo with respect to the stars and cold dust, as our global halo profiles from Sect. 3.3 suggested (Figures 10 and 11). In fact, the PAH strength is also lower in the halo than in the centre of the galaxy, though this is not quite as obvious from Figure 12. Rather, it is a result of the model fitting, the full results of which we provide in Table 6.
From Table 6 we find that there is no significant difference between , , , and for the disk regions, although is predictably higher for the central region. Except for , these all of the parameters are also predictably lower for the halo regions. However, , , and , and show significant variation, in general.
From the SED model, the masses of the PAHs, , for the six regions are implicitly included in Table 6 from . As with the other modeled masses given in Table 6, PAH masses will be specific to the adopted size and location of the region. Nevertheless, it is significant that these quantities can be calculated from the model. Few mass estimates for PAHs in external galaxies exist at this time. Indeed, we are the first to determine PAH mass estimates specifically for a halo region.
| parameter252525See text Sect. 4.2 for the definition of the parameters.262626The parameters , and are correlated. That is the reason why they span a wide range of values and are not normally distributed. | centre (1) | south disk (2) | inner north disk (3) | outer north disk (4) |
|---|---|---|---|---|
| (percentage) | ||||
| parameter | inner halo (5) | outer halo (6) | ||
| (percentage) |
5 Discussion
5.1 The Dusty Disk of NGC 891
The changing morphology of the disk emission of NGC 891 as a function of wavelength, as indicated in Sect. 3.1, nicely illustrates the changing admixture of IR-emitting components — from dominant starlight at NIR wavelengths to PAHs and dust as the wavelength increases. The PAH/dust distribution is complex, as shown in the maps (Figures 2 - 4, 13 - 16) as well as the high resolution, high S/N 8 m PAH major axis profile (Figure 8). The latter figure reveals new details of the PAH distribution along the major axis.
It is useful to compare the major axis profile of Figure 8 to the molecular gas distribution. Scoville et al. (1993) showed that the molecular gas in NGC 891 has a peak at the center surrounded by a molecular ring located 3 - 7 kpc (65 - 150 arcsec) in radius, a structure also detected by Sofue & Nakai (1993). Our PAH profile, which reveals much more detail, follows this general molecular gas distribution quite well, showing a central peak and two peaks on either side at similar radii. In addition, we detect an 8 m peak on the south-west side of the disk at a radius of 140 arcsec (6.5 kpc) which was seen in CO by Sofue & Nakai (1993). Thus, the dominant correlation of the PAH emission in NGC 891 is with the molecular gas, a result that is in agreement with Le Coupanec et al. (1999) and also seen in other galaxies (e.g. Irwin & Madden 2006; Regan et al. 2006). The much lower PAH emission at larger radii is likely due to lower quantities in the lower density extra-planar gas as well as less excitation farther from SF regions.
Although our data were not of sufficient quality to obtain SEDs at every point in the disk, we have obtained good results for four locations as listed in Table 6.
The ratio, , is given in terms of the MW value of 0.046. Thus, we can immediately compare the regions in NGC 891 to the MW in this respect. For the four in-plane regions of NGC 891 this ratio ranges from about 0.9 2, indicating that the PAH abundance is roughly Galactic. Although the ‘centre’ of this edge-on galaxy also includes components along the line of sight, SED results for the centre should nevertheless be weighted towards the true centre of the galaxy and the fact that the central SED differs from the other SEDs supports this view. For example, we find that at the centre of the galaxy is the lowest of the four in-plane regions. This agrees with the results of Le Coupanec et al (1999) who found a reduction in the 11.3 m PAH feature at the galactic centre. It is also consistent with Smith et al. (2007) and Bendo et al. (2008) who both find a decrease in PAH emission in the centres of some galaxies. The fraction of dust exposed to low ISRFs () is in the centre, where a significant fraction of the dust emission comes from hotter dust, likely embedded in star forming regions is between and in the disk, where the emission seems to come primarily from a diffuse component.
Although the strength of the ISRF at lower wavelengths, is approximately the same for all in-disk regions, surprisingly, the heating intensity, , is greatest in the south disk, suggesting a greater range of heating environments than in the other in-disk locations. As indicated in Sect. 4.3, there is an enhancement in H emission at this location and the higher likely reflects the fact that the south disk samples a region of star formation. These results also suggest that the enhanced H emission is likely real and not only the result of dust obscuration elsewhere (see discussion in Kamphuis et al. 2007). Note however, that the and values are constrained only by the four data points in the FIR, and therefore may reflect some of the noise in those values.
5.2 Extraplanar Dust and PAHs in NGC 891
Previous investigations have shown that NGC 891 has extraplanar emission in neutral gas, DIG, molecular gas, and dust (eg. Oosterloo et al. 2007, Fraternali et al. 2005, Rossa et al. 2004, Garcia-Burillo et al. 1992, Howk Savage 2000, see Sect. 1 and Table 7). Our results now show that PAHs can be added to this list, with a measured height extent of at least 2.3 kpc (Sect. 3.3). The width of the cold dust distribution at 450 m is greater than those of both the warm dust (24 m) as well as PAHs (7.7 and 8 m), as shown in Figure 10 and noting error bars (see also Figure 11).
Warm dust is only seen close to heating sources and therefore it is not surprising that this component has a narrower width than cold dust. As for PAHs, we expect that PAHs may very well exist at even higher latitudes than observed because we know that PAHs are present in H I (see the SED models of Dwek et al. 1997, Draine & Li 2007a, and Zubko et al. 2004 which show prominent PAH features associated with the diffuse ISM) and the H I halo of NGC 891 is extensive (Table 7). The fact that the PAH vertical width is closer to that of the warm dust (Figure 10) therefore suggests that the dominant PAH excitation sources are also embedded in the disk. Recent Galaxy Evolution Explorer observations have now revealed an FUV halo in NGC 891 (Gil de Paz et al. 2007) which potentially provides a halo source of FUV photons. However, the FUV emission in galaxy halos is largely due in-disk stellar continuum photons that are reflected from halo dust272727There could also be a minor contribution from shock excitation. (Hoopes et al. 2005). In an optically thin halo environment, FUV photons from the disk should dominate over scattered photons and, in either case, the dominant excitation source ultimately resides from stars the disk.
The extents of the extraplanar emission are summarized in Table 7. These components are listed in order of largest distance from mid-plane to smallest distance. All of the values given are for the farthest measured extent of the halo (as opposed to a characteristic scale height) and thus, they depend on whatever S/N is available for the data. Therefore, Table 7 is meant to provide a measure of the full extent of the extraplanar components in NGC 891 to the limits of current data. Nevertheless, Figures 10 and 11 display how the width of a subset of these quantities compare to each other and the widths of these profiles agrees with the ordering of Table 7.
| ISM component | distance from | reference |
| mid-plane (kpc) | ||
| neutral gas | 22 | Oosterloo et al. (2007) |
| 15 | Fraternali et al. (2005) | |
| 5 | Swaters et al. (1997) | |
| old stars | 3 | this paper (Figure 10) |
| DIG | 2.2 | Rossa et al. (2004) |
| 2 | Howk Savage (2000) | |
| warm dust | 2.5 | this paper (Figure 10) |
| cold dust | 2 | Alton et al. (1998) |
| PAHs | 2.3 | this paper (Figure 10) |
| molecular gas | 1 - 1.4 | Garcia-Burillo et al. (1992) |
An important result of this work is our first attempt at a SED model in the extraplanar (halo) region of an external galaxy (Table 6). The extra-planar dust mass results are consistent with those determined from extra-planar absorption (Howk Savage 1997), after reasonable corrections for different apertures are taken into account. The ratios in the halo are similar to those in the disk. This result was unexpected given the observations of the vertical profiles in Figure 10, which show that the cool dust (at 450 m, for example) extends further into the halo vertically than the PAHs (at 7.7 m, for example). However, the error bars are very large for these halo results, and the SED model does not take into account the variation of the stellar populations from the disk to the halo. A decrease of the hardness of the ISRF outward, would decrease the PAH strength, for a constant PAH-to-dust mass ratio, which is what we see here. The quantity, , which is close to 1 in the halo, is consistent with an interpretation in which few hot photons are available for excitation.
While NGC 891 is known for large amounts of neutral gas, DIG, and dust in its halo (Sect. 1), its PAH emission is not as extended in as has been seen in several other galaxies which are not known for abundant halo gas and dust (see Irwin Madden 2006, Irwin et al. 2007). Since the excitation source for the PAHs appears to be within the disk (see above), we speculate that FUV photons that could potentially excite high latitude PAH emission in NGC 891 may instead be absorbed by other gaseous and dust components. That is, other components in the halo of NGC 891 have some optical depth to FUV photons that originate in the disk.
6 Conclusions
We have examined 20 spatially resolved IR data sets for NGC 891, 14 of which are newly reduced and/or newly presented data. The emission spans wavelengths from 1.2 to 850 m. Although there are a variety of resolutions and S/N for the different data sets, which include both ground-based and space-based observations, we have compared the spatial distributions, both along and perpendicular to the major axis for a subset of the data. PAH emission is found to correlate well in the disk with molecular gas, likely because of higher densities of gas and dust in these regions as well as the abundant supply of UV photons from SF regions.
Of particular interest is the extraplanar, or ‘halo’ gas and dust in NGC 891. The H I, DIG, and dusty halos have been established by others. Our work has compared the extents of various components and also shown that PAHs also exist in the halo of this galaxy to heights of 2.3 0.2 kpc at a 3 level. NGC 891 is only the 4th galaxy in which PAHs have been detected in the halo. We find that cool halo gas, as measured by 450 m emission, is broader in than both warm halo gas 24 m and PAH emission, suggesting that the dust heating sources and PAH excitation sources are within the disk.
We have used our multi-frequency data set to construct complete IR spectra for four different locations in the disk of NGC 891 and two in its halo. This has allowed us to model SEDs in different environments both within the disk of NGC 891 and, for the first time, in the halo. The SED models have allowed us to determine the mass of dust, fraction of PAHs, and fraction of ionized PAHs for these different environments (Table 6). We find that the PAH fraction, , is similar to Galactic values (within a factor of two) and this value is lowest in the galaxy’s center, consistent with previous studies of PAHs in galaxies. The fraction of dust exposed to a colder (i.e. equivalent to an equilibrium dust temperature less than 25 K) radiation field, , is also lowest in the center, suggesting the presence of a hotter radiation field at the center of the galaxy.
In the extraplanar dust, is similar to in the disk. Therefore we cannot conclude a lower PAH abundance, especially since the SED model used does not take into account a changing radiation field that is more typical of a halo. The model used could take into account the changing radiation field, but we would have needed additional constraints. The fraction of PAHs exposed to a cold radiation field is very high in the halo and is almost unity. Together with the vertical halo extents indicated above, these results suggest that the halo PAHs are excited from escaping disk photons.
Acknowledgements
We thank Dr. R. Swaters for supplying us with the NGC 891 H I FITS file, Dr. P. Alton for the SCUBA FITS files. This publication makes use of the ISO and Spitzer data archives from the European Space Agency and the National Aeronautics and Space Administration (NASA), respectively. It also makes use of data products from the Two Micron All Sky Survey, which is a joint project of the University of Massachusetts and the Infrared Processing and Analysis Center/California Institute of Technology, funded by NASA and the National Science Foundation.
References
- Alton et al. (1998a) Alton P., Bianchi S., Rand R., Xilouris E., Davies J., Trewhella M. 1998, ApJ 507, L125
- Alton et al. (1998c) Alton P., Rand R., Xilouris E., Bevan S., Ferguson A., Davies J., Bianchi S. 2000, AAS 145, 83
- Baldwin Pooley (1973) Baldwin J., Pooley G. 1973, MNRAS, 161, 127
- Bendo et al. (2003) Bendo G. et al. 2003, ApJ, 125, 2361
- Bendo et al. (2008) Bendo G. et al. 2008, MNRAS, 389, 629
- Biviano (1998) Biviano A. 1998, The ISOCAM Calibration Error Budget Rep., ver 3.1
- Blommaert et al. (2003) Blommaert J. et al. 2003, The ISO Handbook: CAM - The ISO Camera (v 2.0), ESA SP-1262, Volume II
- Burgdorf et al. (2007) Burgdorf M., Ashby M. L. N., & Williams R. 2007, ApJ, 668, 918
- Chanial (2003) Chanial P. 2003 PhD thesis, University of Paris
- Cohen et al. (2003) Cohen M., Wheaton W., Megeath S. 2003, AJ 126, 1090
- Coia et al. (2005) Coia D. et al. 2005, AA, 430, 59
- Dahlem et al. (1994) Dahlem M., Dettmar R-J., Hummel E. 1994, AA, 290, 384
- Dale et al. (2001) Dale D., Helou G., Contursi A., Silbermann N., Kolhatkar S. 2001, ApJ, 549, 215
- Dale et al. (2005) Dale D. et al. 2005, ApJ, 633, 857
- de Vaucouleurs et al. (1991) de Vaucouleurs G., de Vaucouleurs A., Corwin H., Buta R., Paturel G., Fouque P. 1991, Third Reference Catalogue of Bright Galaxies, Vols 1-3. Springer-Verlag, Berlin, Heidelberg, New York
- Draine et al. (2007a) Draine B. Li A. 2007a, ApJ, 657, 810
- Draine et al. (2007b) Draine B. et al. 2007b, ApJ, 663, 866
- Dupac et al. (2003) Dupac X. et al. 2003, MNRAS, 344, 105
- Dunne Eales (2001) Dunne L. Eales S. 2001, MNRAS, 327, 697
- Dwek et al. (1997) Dwek E. et al. 1997, ApJ, 475, 565
- Engelbracht et al. (2006) Engelbracht C. W. et al. 2006, 642, L127
- Floc Rocca-Volmerange (1997) Fioc M. Rocca-Volmerange B. 1997, AA, 326, 950
- Fouks et al. (1995) Fouks B., Schubert J. 1995, Proc. SPIE, 2475, 487
- Fraternali et al. (2005) Fraternali R., Oosterloo T., Sancisi R., Swaters R. 2005, ASP Conference Series, 331, 239 449
- Galliano (2004) Galliano F. 2004, PhD thesis, University of Paris XI
- Galliano (2008a) Galliano F., Dwek E., Chanial P. 2008a, ApJ, 672, 214
- Galliano (2008b) Galliano F., Madden S., Tielens A., Peeters E., Jones A. 2008b, ApJ, 679, 310
- Galliano (1992) Garcia-Burillo S., Guelin M., Cernicharo J., Dahlem M. 1992, AA, 266, 21
- Gil de Paz (2007) Gil de Paz A., et al. 2007, ApJS, 173, 185
- Gordon et al. (2005) Gordon K. D. et al. 2005, PASP, 117, 50
- Guelin et al. (1993) Guelin M., Zylka R., Mezger P., Haslam C., Kreysa E., Lemke R., Sievers A. 1993, AA, 279, L37
- Haas et al. (2002) Haas M., Klaas U., Bianchi S. 2002, AA, 385, L23
- Hoopes et al. (2005) Hoopes C. G. et al. 2005, ApJ, 619, 99
- Howk et al. (1997) Howk C. Savage B. 1997, AJ, 114, 2463
- Howk et al. (2000) Howk C. Savage B. 2000, AJ, 119, 644
- Irwin et al. (2006) Irwin J., Madden S. 2006, AA, 445, 123
- Irwin et al. (2007) Irwin J., Kennedy H., Parkin T., Madden S. 2007, AA, 474, 461
- Israel et al. (1999) Israel F., van der Werf P., Tilanus R. 1999, AA, 344, L83
- Jarrett et al. (2003) Jarrett T., Chester T., Cutri R., Schneider S., Huchra J. 2003, AJ, 125, 525
- Kamphuis et al. (2007) Kamphuis P., Holwerda B., Allen R., Peletier R., van der Kruit P. 2007, AA, 471, L1
- Le Coupanec et al. (1999) Le Coupanec P. et al. The Universe as Seen by ISO. Eds. P. Cox M. F. Kessler. ESA-SP 427, p. 917
- Mathis et al. (1983) Mathis J., Mezger P., Panagia N. 1983, AA, 128, 212
- Mattila et al. (1999) Mattila K., Lehtinen K., Lemke D. 1999, AA, 342, 643
- Oosterloo et al. (2007) Oosterloo T., Fraternali F., Sancisi R. 2007, AJ, 134, 1019
- Otte et al. (2001) Otte B., Reynolds R., Gallagher J., Ferguson A. 2001, ApJ, 560, 207
- Pagani et al. (2003) Pagani L. et al. 2003, AA, 406, L59
- Popescu et al. (2003) Popescu C., & Tuffs R. 2003, AA, 410, L21
- Popescu et al. (2004) Popescu C., Tuffs R. J., Kylafis N. D., & Madore, B. F. 2004, AA, 414, 45
- Rand et al. (2008) Rand R. J., Wood K., & Benjamin R. A. 2008, ApJ, 680, 263
- Reach et al. (2005) Reach W., et al. 2005, PASP, 117, 978
- Regan et al. (2006) Regan M. et al. 2006, ApJ, 652, 1112
- Rossa et al. (2003) Rossa J. Dettmar R.-J. 2003, AA, 406, 493
- Rossa et al. (2004) Rossa J., Dettmar R., Walterbos R., Norman C. 2004, AJ, 128, 674
- Scoville et al. (1993) Scoville N., Thakkar D., Carlstrom J., Sargent A. 1993, ApJ, 404, L59
- Smith et al. (2007) Smith J. et al. 2007, ApJ, 656, 770
- Sofue Nakai (1993) Sofue Y., Nakai N. 1993, PASJ, 45, 139
- Sofue (1997) Sofue Y. 1997, PASJ, 45, 139
- Strickland et al. (2004) Strickland D., Hekcman T., Colbert E., Hoppes C., Weaver K. 2004, ApJ, 606, 829
- Swaters et al. (1997) Swaters R., Sancisi R., van der Hulst J. 1997, ApJ, 491, 140
- Temple et al. (2005) Temple R., Raychaudhury S., Stevens I. 2005, MNRAS, 362, 581
- Tilanus (2005) Tilanus R. 2005 http://www.jach.hawaii.edu/JCMT/continuum/calibration/sens/gains.html
- Vogler et al. (2005) Vogler A., Madden S., Beck R., Lundgren A., Sauvage M., Vigroux L., Ehle M. 2005, AA, 441, 491
- Zubko et al. (2004) Zubko V., Dwek E., Arendt R. 2004, ApJS, 152, 211
Appendix A