YOHKOH remnants: partially occulted flares in hard X-rays
Abstract
Context. Modern solar X-ray imagers did not breakthrough the problem of detailed diagnostics of faint hard X-ray sources in the presence of stronger ones. This is the case of the impulsive phase of solar flares in which footpoint sources are usually stronger than loop-top ones.
Aims. For this aim, flares being partially occulted by the solar limb, are the best reservoir of our knowledge about hard X-ray loop-top sources. Recently, the survey of partially occulted flares observed by the RHESSI has been published (Krucker & Lin 2008). The extensive Yohkoh database still awaits such activities. This work is an attempt to fill this gap.
Methods. Among from 1286 flares in the Yohkoh Hard X-ray Telescope Flare Catalogue (Sato et al. 2006), for which the hard X-ray images had been enclosed, we identified 98 events that occurred behind the solar limb. We investigated their hard X-ray spectra and spatial structure.
Results. We found that in most cases the hard X-ray spectrum of partially occulted flares consists of two components, non-thermal and thermal, which are co-spatial. The photon energy spectra of the partially occulted flares are systematically steeper than spectra of the non-occulted flares. Such a difference we explain as a consequence of intrinsically dissimilar conditions ruling in coronal parts of flares, in comparison with the footpoints which usually dominate the hard X-ray emission of disk flares. At least two reasons of the difference should be taken into consideration: (1) stronger contamination of hard X-rays with emission of thermal plasma, (2) different mechanism in which non-thermal electrons radiate their energy. For events unbiased with the thermal component the difference, , is equal to 1.5.
Conclusions. A schematic picture, in which thin-target mechanism is responsible for hard X-ray emission of loop-top sources and thick-target mechanism – for emission of footpoint sources, is modified by the presence of some coronal thick-target sources. At least a part of them suggests a magnetic trapping. Investigated flares do not respond the overall (global) magnetic configuration of the solar corona. For their characteristics conclusive is rather the local magnetic configuration in which they were developed.
Key Words.:
Sun: corona – flares – particle emission – X-rays, gamma rays1 Introduction
It has been commonly accepted that solar flares are caused by reconnection of magnetic field lines in the corona. In this process, energy originally stored in the magnetic field is redistributed into plasma heating, waves generation and particles acceleration. However, details of reconnection process as well as general rules of energy partition are subjects of extensive debate. Any progress strongly depends on wise-organized observations and their interpretation.
Hard X-ray observations offer a good insight into further evaluation of particles accelerated in the reconnection process. Propagation of particles operates under guidance of magnetic lines. Their bundles converge at the entrance into the lower part of the solar atmosphere, where density of ambient plasma increases steeply. Electrons accelerated in the corona are stopped there emitting intense hard X-radiation via electron-ion bremsstrahlung. This mechanism, known as the thick-target model (Brown, 1971), works so efficiently that footpoint hard X-ray sources usually strongly dominate spatial distribution of flare emission in this energy range.
It is difficult to observe the particles acceleration without effects introduced by the propagation of particles because in the less-dense corona hard X-radiation is emitted less efficiently in the thin-target model (Brown, 1971; Lin, 1974). In many cases the coronal hard X-ray sources can be seen as an effect of magnetic convergence Tomczak & Ciborski (2007) or ultra-dense thick-target environment (Kosugi et al., 1994; Veronig & Brown, 2004).
Coronal hard X-ray sources can be easily separated when a flare occurs behind the solar limb but close enough for recording emission of the higher part of magnetic structure. In case of a partially occulted flare the solar disk works like a rough imager which stops emission of usually brighter footpoint sources. Such a configuration had been used routinely for investigation of coronal hard X-ray sources before the hard X-ray imaging detectors began to operate (Zirin et al., 1969; Frost & Dennis, 1971; Hudson, 1978; Hudson et al., 1982; Kane et al., 1982).
First statistical attempt of partially occulted flares has been performed using data from the UCSD experiment onboard OSO-7 satellite (Roy & Datlowe, 1975; McKenzie, 1975). In fifteen months of OSO-7 operation, from among 601 X-ray bursts above 103 photon cm-2 s-1 keV-1 in energy channel extending over 5.1-6.6 keV, 54 bursts were unaccompanied by H flares. As a cinema flare patrol was in progress during those bursts, they probably occurred behind the solar limb.
From the group of partially occulted flares, McKenzie (1975) has chosen eight major soft X-ray events and has found that all had significant hard X-ray emission in the 30-44 keV range. Roy & Datlowe (1975) analyzed all available hard X-ray spectra of partially occulted flares. They found that 25 from among 37 bursts, had a non-thermal component. The average value of the spectral indices at peak 20 keV flux for these 25 over-the-limb events was 4.6, whereas for 59 center events () was 3.8.
The main conclusion of above mentioned papers from the pre-imaging era was that hard X-ray emission was not concentrated close to the solar surface but took place in extended regions in the corona.
Modern hard X-ray telescopes onboard Yohkoh (Hard X-ray Telescope) and Reuven Ramaty High-Energy Solar Spectroscopic Imager (RHESSI) satellites have opened a new perspective in investigation of coronal hard X-ray sources. Many important discoveries have been done (Krucker et al., 2008a), including the most famous – the discovery of the presence of above the loop-top sources in flares (Masuda et al., 1994). However, in many cases a low dynamical range of a hard X-ray telescope makes a qualitative analysis of images very problematic. It considers the problem of detailed diagnostics of faint hard X-ray sources in the presence of stronger ones. Alexander & Metcalf (1997) have shown that weak sources can be suppressed during the image reconstruction and in consequence they can mimic the appearance of stronger neighbors. As we see, this is the case of the impulsive phase of a typical flare when we observe strong footpoint and weak loop-top sources simultaneously.
To avoid such a complication the partially occulted flares were chosen. From the Yohkoh database, one or a few examples of behind-the-limb flares were selected many times so far. This specific configuration was usually used to perform joint diagnostics on the basis of hard and soft X-ray images including full-Sun soft X-ray spectra recorded by the Bragg Crystal Spectrometer. In this way, soft X-ray bright loop-top kernels (Khan et al., 1995; Mariska et al., 1996; Sterling et al., 1996; Mariska & Doschek, 1997; Ohyama & Shibata, 1997) as well as flare-associated X-ray plasma ejections (Ohyama & Shibata, 1997; Tomczak, 2004, 2005) were investigated.
Mariska & McTiernan (1999) have done a comparison of hard and soft X-ray characteristics for 28 partially occulted and 17 non-occulted limb flares observed by Yohkoh between 1991 and 1996. Partially occulted flares in most observational characteristics were found to be indistinguishable from non-occulted ones. Exceptions were the hard X-ray spectra averaged over the entire events which exhibit a higher value of the power-law index in the partially occulted flares.
Tomczak (2001) has investigated the Yohkoh X-ray images of 14 behind-the-limb flares. He reported a complex variability of hard X-ray flux built by two separate components: several-minutes gradual lower-energy backgrounds and quasi-periodic higher-energy impulses lasting typically 5–30 s. Impulses were too weak for imaging but gradual components provides the easy identification in hard X-ray images. The hard X-ray sources were co-spatial with soft X-ray kernels (more frequent type A) as well as had no distinct counterparts in soft X-rays (less frequent type B). The appearance of a new gradual component in the hard X-ray light curve was always associated with the presence of an additional hard X-ray source.
Observations of the partially occulted flares were recently analyzed on the basis of RHESSI data (Krucker et al., 2007a; Li & Gan, 2007; Liu et al., 2008), together with Hinode (Krucker et al., 2007b) or Solar-Terrestrial Relations Observatory, STeReO (Krucker et al., 2009) data. Krucker & Lin (2008) have prepared a survey of partially occulted flares observed by RHESSI. They found 55 such events between 2002 February and 2004 August. The existence of two different components of coronal hard X-ray emission was revealed in 50 flares: (1) the thermal with a gradual time profile, and (2) the non-thermal (power-law spectra with indices mostly between 4 and 7) showing faster time variations. Both components were usually co-spatial within km with only a few exceptions.
The extensive Yohkoh database still awaits preparing a survey of partially occulted flares. This paper is an attempt to fill this gap. For this aim, we used the Hard X-ray Telescope Flare Catalogue. The development and structure of this catalogue are described in Sect. 2. The criteria of selection of flares enclosed in the survey are given in Sect. 3. In Sect. 4 a statistical approach of some characteristics describing partially occulted flares is given and the results are compared to their counterparts obtained for non-occulted flares from the Catalogue. In Sect. 5 the results are discussed and compared to reports of other authors. In Sect. 6 short descriptions of some interesting groups of events in the Catalogue are given. Main conclusions are summarized in Sect. 7.
| Ver- | Latest | Contents | ||||||
| sion | References | event | Records | HXT | HXT | GOES | SXT | WBS |
| (lc)a | (i)a | |||||||
| 1 | Kosugi et al. (1993) | 1992/12 | 672 | + | – | + | – | – |
| 2 | Kosugi et al. (1995) | 1994/12 | 1007 | + | – | + | – | – |
| 3 | Sato et al. (1998) | 1998/08 | 1264 | + | + | + | – | – |
| 4 | Sato et al. (2003) | 2001/12 | 3112 | + | + | + | + | – |
| 5 | Sato et al. (2006) | 2001/12 | 3112 | + | + | + | + | + |
-
a
lc – light curves; i – images
2 Development and structure of the YOHKOH HXT Flare Catalogue
The Japanese solar satellite Yohkoh operated in years 1991–2001 and during this time provided huge amount of excellent data. The Hard X-ray Telescope, HXT, (Kosugi et al., 1991) was a Fourier synthesis imager observing the whole Sun. It consisted of 64 independent subcollimators which measured spatially modulated intensities in four energy bands (L: 14–23 keV, M1: 23–33 keV, M2: 33–53 keV, and H: 53–93 keV). During the flare the intensities were integrated, in each energy band, over 0.5 s. Some reconstruction routines (Maximum Entropy Method, Pixons) that allow us to obtain hard X–ray images with an angular resolution of up to 5 arcsec are available.
Among from four scientific instruments onboard Yohkoh, the observations made by the HXT were organized in the most friendly way since early years of the mission. The members of the HXT team have prepared five versions of a catalogue collecting basic information about flares observed by the telescope (see Table 1). The first two versions of the catalogue (Kosugi et al., 1993, 1995) contain 672 and 1007 records, respectively. For some flares the 10-minutes hard X-ray light curves in four energy bands are given. In the 3rd version of the catalogue (Sato et al., 1998), containing 1264 records, example hard X-ray images were added. The last two versions of the catalogue contain the whole-mission database with 3112 records and some supplementary data from other Yohkoh instruments. In the 4th version (Sato et al., 2003) the example soft X-ray images provided by the Soft X-ray Telescope (SXT) were introduced. In the 5th version (Sato et al., 2006) light curves and spectra provided by the Wide Band Spectrometer (WBS) were introduced.
In summary, the recent 5th version of the catalogue gives a short description of 3090111Note that a total number of flares is slightly lower than the total number of records because more than one record is dedicated for some flares. flares that produced at least 3 counts s-1 per subcollimator (SC-1) in channel L. The description contains date, time, peak counts in four HXT and four WBS energy bands, GOES class, H position, and NOAA active region number. For 1286 flares example images in particular energy bands, basically for a peak time period, are enclosed. The criterion was a count rate roughly 10 counts s-1 SC-1 above the background. The HXT images are overlaid on a SXT image when available. For the same 1286 flares the four HXT light curves are presented. Moreover, the catalogue contains WBS light curves of 2736 flares. Example WBS spectra of 369 flares up to 1 MeV and spectra of 12 flares up to 10 MeV are added basically for a peak time period.
The last version of the catalogue still needs some improvements and corrections. For example, for years 1997–2001 an identification of GOES class, H position, and NOAA active region number is made only for a minor part of events. The poor quality of some HXT images suggests their probably wrong position, which is supported by a disagreement with H position of a flare.
3 Criteria of selection
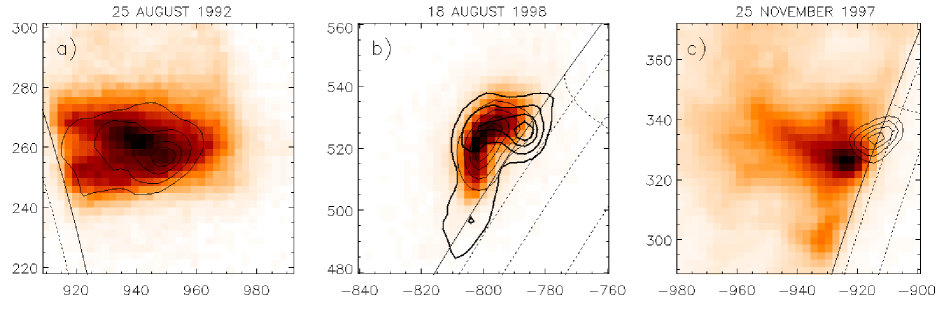
In the first step, all hard X-ray images available in the Catalogue were inspected. As a result, the preliminary list of 170 events, located close to the solar limb, was established. In the next step, each event from the preliminary list was carefully verified using original files of data. For flares that occur behind the solar limb the footpoint hard X-ray sources should not be seen. Therefore, every flare from the list, for which a centroid of any hard X-ray sources was located within the solar disk was rejected. If soft X-ray images of the flare were available, decision of the rejection was consulted with this kind of data. Namely, for flares that occur behind the solar limb, there is a strong impression that the solar limb sharply cuts the soft X-ray emission. Moreover, the counterparts of footpoint hard X-ray sources are soft X-ray brightenings (Hudson et al., 1994; Tomczak, 1997). Thus, for events in our survey, the soft X-ray brightenings should not be seen. If images of the flare taken during the time interval chosen in the Catalogue did not allow us to make the decision, we used the images for other time interval. Three examples of flares considered during preparation of the survey are presented in Fig. 1.
Finally, we have qualified 98 flares which observations strongly suggest their situation behind the solar limb. The list of them is presented in Table LABEL:occlist. How far behind the solar limb did they occur? Acquaintance of heliographic longitude, , is crucial for a correct assignation of altitude above the photosphere, , one of the most important parameters for the later discussion. However, before STeReO satellites only limited estimations of

the longitude were possible.
We estimate this parameter twofold. First, by using beyond-the-limb extrapolation of a straight line fitted to the plot of longitude versus time for all H flares observed in the proper active region during its passage across the solar disk (Roy & Datlowe, 1975). For this aim, observations collected in the Solar-Geophysical Data (SGD) were used. An example of the longitude extrapolation for the flare No. 23 070 in the Catalogue from the NOAA AR 9087 is given in Fig. 2. Second, by calculating a position of the flare on the basis of a time of the central meridian passage (CMP) taken from the SGD for the proper active region. The formula describing the solar differentional rotation given by Newton & Nunn (1951) for large recurrent sunspots, and corrected by Ward (1966), was used:
| (1) |
where is the region latitude.
Both methods of the estimation of work very well only under specific conditions. The first one shows the position of a weighted centroid of positions in which flares occurred in the active region during its passage across the solar disk. The second one shows basically the position of the central part of an active region. Thus, if the investigated behind-the-limb flare occurred in the alternative place of the active region, each method may be charged with some additional (systematic) error. That is why sometimes the obtained values of were below 90∘ though the available X-ray images strongly suggested the position beyond the solar limb.
The values of given in column (6) of Table LABEL:occlist were obtained basically by the first method, except for the case when the - plot consisted of only a few points or the second method provided a more realistic solution. Uncertainties given in column (7) of Table LABEL:occlist are a measure of the scatter of source data taken from the SGD. The results are summarized in Fig. 3, where the latitude is taken directly from the hard X-ray image. The obtained values of the longitude are between slightly below 90∘ (a consequence of systematic errors) to 26∘.91∘.8 beyond the solar limb (event No. 26 060). For the event No. 15 640 only we could not estimate the longitude.
At first glance, it seems that in our survey some partially occulted flares are missed. We identified only 98 events out of 1286 i.e. 7.6 percent of the catalogue supplies. Assuming uniform distribution in the longitude of all flares in the Catalogue one should expect that 4/22 i.e. 18.2% of the flares have occurred behind the solar limb between 0∘ and 20∘. We should remember, however, that the further position of a flare beyond the solar limb, the larger is a occultation height. For example, for 10∘ hard X-ray emission should occur at least about 1.1104 km above the photosphere to be seen and for 20∘ the minimal height increases to about 4.6104 km. This effect seriously decreases the population of partially occulted flares.

We tried to estimate the corrected population of behind-the-limb flares by including frequency of their occurrence in dependence on the altitude above the photosphere. We adopted the formula
| (2) |
where the scale-height km was pointed out by Catalano & Van Allen (1973) for soft X-rays. The similar scale-height was concluded from the investigation of the peak time differences between soft X-ray and hard X-ray emissions of 859 flares (Li & Gan, 2006). The obtained value (7.71.3)% agrees almost perfectly with the actual population (7.6%) in the Catalogue. We conclude that our survey is almost complete.
4 Results
In our survey we characterize each event by its appearance during a single time interval established in the HXT Flare Catalogue. This time interval was chosen to contain the strongest hard X-ray signal. Its duration depended on a number of counts and imaging requirements, thus, sometimes it was only a few seconds around a single burst, sometimes – a lot of minutes with many bursts (see columns (3) and (14) in Table LABEL:occlist).
4.1 Power-law spectra
Within this time interval the total signal above the background from the whole image was accumulated in each energy band, which means that our results are not charged with disadvantages of imaging spectroscopy. We calculated flux ratios between consecutive energy bands: M1/L, M2/M1, and H/M2, so called hardness ratios. From hardness ratios the average power-law indices in some energy ranges of the hard X-ray spectrum were obtained: M1/L , between 14 and 33 keV, M2/M1 , between 23 and 53 keV, and H/M2 , between 33 and 93 keV.
Results are given in columns (11) - (13) of Table LABEL:occlist. Many events showed a signal above the background only in low-energy bands, L and M1, thus for them there are no values of and in the table. For three flares even the value of was not obtained: for two of them (Nos. 09 650 and 24 840) source data files were corrupted, for event No. 22 570 the hard X-ray flux was recorded only in the channel L. Uncertainties of indices, estimated according to number of counts using the Poisson statistics, were typically 0.1–0.2.
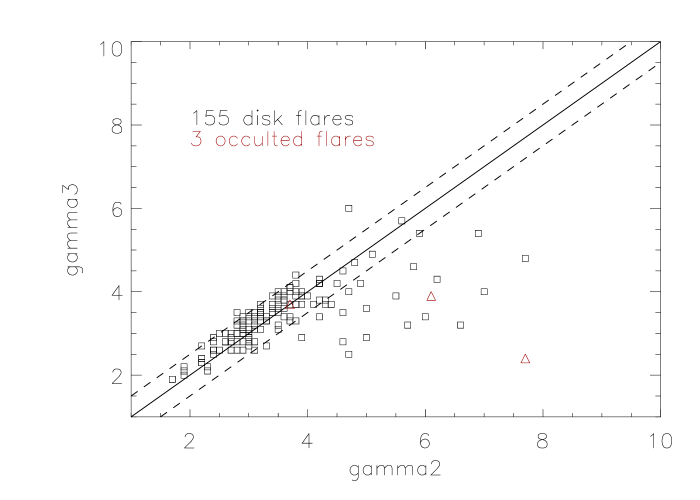
In Fig. 3 two kinds of flares not included in further statistical considerations are marked. The events marked with boxes were observed outside the maximum of hard X-rays, therefore values of indices obtained for them are unrepresentative for the phase of the highest energy available for other events. For uniformity of results, these flares are omitted in the later analysis.
The events marked in Fig. 3 with stars occurred probably too close to the solar limb and hard X-ray emission of their footpoints is not eliminated completely. Indeed, for these events a small hard X-ray source is seen centered close to the solar limb (e.g. Fig. 1c). Its size is much smaller than a size of a typical coronal source. We found that such sources are seen basically for the longitudes below 92∘. Our aim is to study characteristics of coronal hard X-ray sources, therefore these flares also are omitted in later considerations.
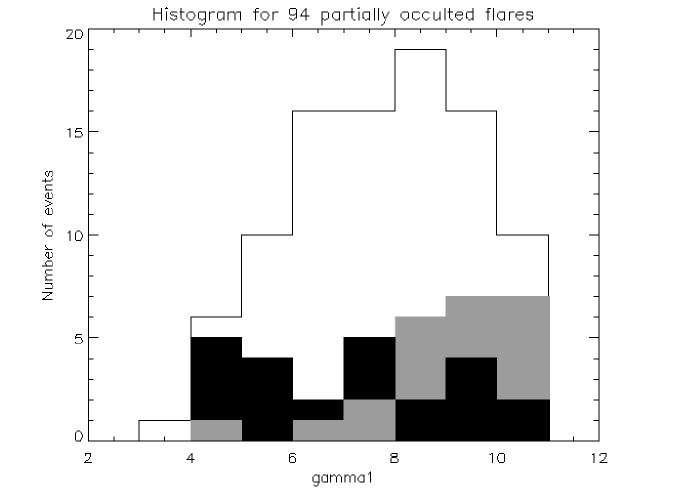
A histogram of values of the index obtained for 94 events from our survey is presented in Fig. 4. Moreover, two separate histograms: for events without the hard X-ray maximum (boxes in Fig. 3) and for events with the footpoint emission overshooting (stars in Fig. 3) are overwritten. According to our expectations the first histogram, containing less energetic events, is shifted towards higher values, while the second one, including more energetic events, is shifted towards lower values. We conclude that due to applied strict criteria of the selection, the finally qualified population is more uniform.
| Area | Type of | Partially | Non-occulted |
|---|---|---|---|
| in Fig. 6 | spectrum | occulted | |
| I | non-thermal | 30.4% | 55.2% |
| () | (7/23) | (185/335) | |
| II | thermal + non-thermal | 17.4% | 24.2% |
| () | (4/23) | (81/335) | |
| III | quasi-thermal | 52.2% | 1.8% |
| () | (12/23) | (6/335) | |
| IV | albedo | 0% | 18.8% |
| () | (0/23) | (63/335) |
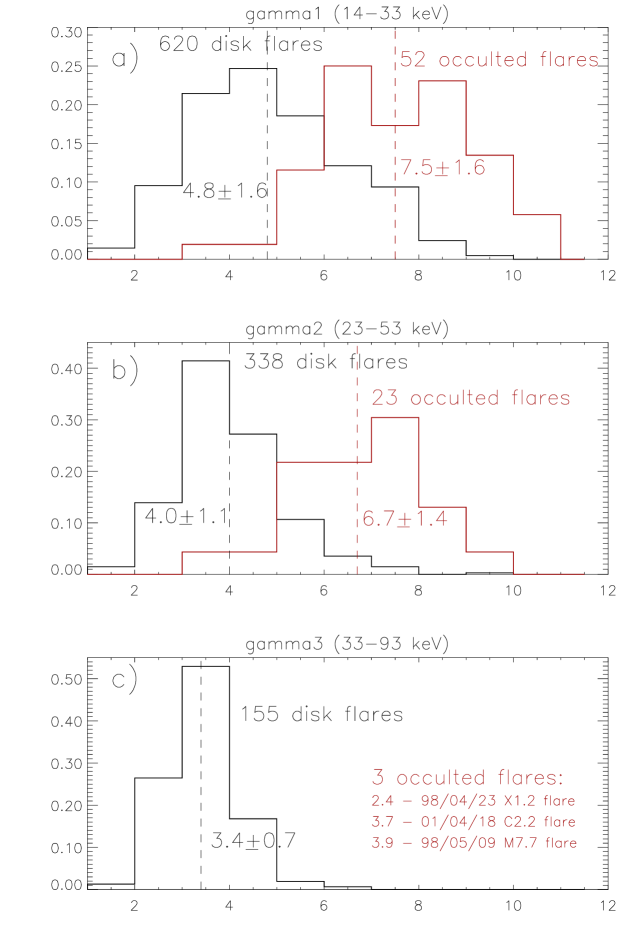
The final histogram is presented in Fig. 5a. It contains values for 52 partially occulted flares which we have left after the rejection of two groups of events described in the previous paragraph. The histogram of values of the index obtained for 620 non-occulted flares found in the Catalogue is given in the same panel. For easy comparison both histograms are normalized. As we can see, central parts of histograms, containing about two third of events, are shifted one from another. The average value for partially occulted flares is 7.5, while the average value for non-occulted flares is 4.8. Standard deviations for both histograms are 1.6.
In Fig. 5b we compared normalized histograms of the index obtained for partially occulted and non-occulted flares, respectively. Because for a part of flares signal above the background in energy band M2 was imperceptible, the total number of events has decreased to 23 and 338, respectively. Again, the central parts of histograms, containing above 70% of events, are shifted one from another. The average value for partially occulted flares is 6.7, while the average value for non-occulted flares is 4.0. Standard deviations are 1.4 and 1.1, respectively.
Calculation of the index needs a distinct signal above the background in energy band H. This limits once more a number of events to 155 non-occulted and only 3 partially occulted flares. Therefore, in Fig. 5c we present only the normalized histogram for non-occulted flares. The average value is 3.4 and the standard deviation is 0.7. Three partially occulted flares emitting signal strong enough in energy band H show values of the index similar to typical values obtained for disk flares. They are: event No. 11 650 of 1998 April 23 (Sato, 2001; Tomczak, 2004), event No. 11 950 of 1998 May 9 (Tomczak, 2008), and event No. 26 060 of 2001 April 18 (Hudson et al., 2001). We would like to stress that all these events show very spectacular X-ray plasma ejections.
4.2 Deviations from power-law spectra
Histograms of values of the power-law index in Fig. 5 show a shift towards lower values with an increase of photon energies for which the power-law was fitted. This shift is seen for partially occulted as well as for non-occulted flares. Such appearance strongly suggest a contamination of hard X-rays with emission of thermal plasma which is expected to be decreasing with the photon energy.
The HXT provides poor spectral resolution (only four broad energy bands) which excludes a reasonable fitting of a non-thermal power-law component together with a thermal one. Therefore, another method to distinguish between non-thermal and thermal components should be proposed. In this paper we calculated the average power-law index , , and for energy ranges: 14-33, 23-53, and 33-93 keV, respectively. If an investigated photon energy spectrum could be described with a single power-law formula then the obtained values of , , and should be similar within observational uncertainties. Some larger differences between these values strongly suggest a deviation from the single power-law caused, for example, by the presence of the thermal component.
| Area | Type of | Partially | Non- | |
|---|---|---|---|---|
| in Fig. 7 | spectrum | occulted | occulted | |
| I | non-thermal | 82.9% | ||
| () | (1/3) | (130/155) | ||
| II | thermal + non- | 15.2% | ||
| thermal () | (2/3) | (22/155) | ||
| III | quasi-thermal | 0% | ||
| () | (0/3) | (0/155) | ||
| IV | albedo | 1.9% | ||
| () | (0/3) | (3/155) |
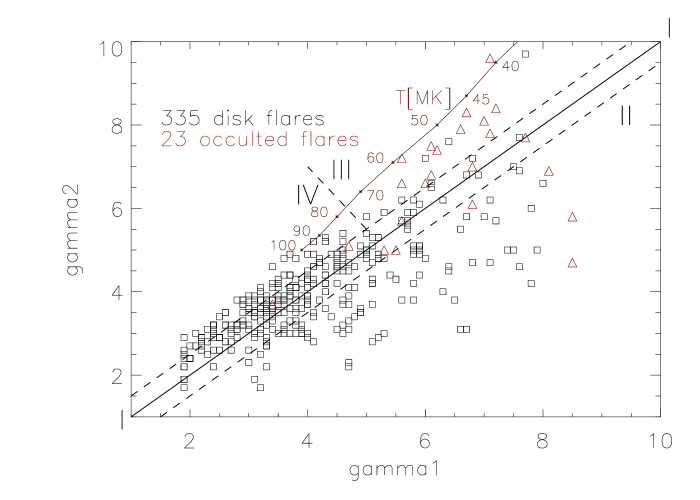
In Fig. 6 we present the comparison between and for flares from histograms in Fig. 5a-b. For events situated within the central corridor between two straight dashed lines (area I), differences between and are below expected uncertainties: . It means that in energy range 14-53 keV their spectra can be described by the single power-law. We consider them as purely non-thermal.
Area II below the central corridor is occupied by flares for which . It means that their spectra are steeper in lower and flatter in higher energies. We explain this shape as the consequence of the thermal component presence in energy band L.
The area above the central corridor is occupied by flares for which . It means that their spectra are flatter in lower and steeper in higher energies. This shape suggests a thermal nature. However, a purely thermal events should be located in the figure along the solid narrow line above the corridor. As we can see, only a few events is situated close to this line. The majority of events located in area III is rather quasi-thermal i.e. the thermal component is dominating but mixed with non-thermal bursts as was reported by Tomczak (2001).
Events situated in area IV are too energetic to explain their spectra by means of thermal emission. Zhang & Huang (2003) proposed that the value of lower than can be caused by the Compton backscattering. This effect known as the photospheric albedo moves a part of photons from energy band L to higher energies. Kaparova et al. (2007) have shown that the photospheric albedo depends on the heliocentric distance. We checked it and found that longitudes of 38 events out of 50 from area IV, for which H coordinates are given in the Catalogue, are below 45∘. We consider this statement as a supporting argument that events situated in area IV has non-thermal spectra modified by the photospheric albedo.
Statistics of the occurrence of flares in different areas in Fig. 6 for partially occulted and non-occulted flares separately is given in Table 2. The results can be summarized as follows. During the hard X-ray maximum in energy band L (14-23 keV) the non-thermal component dominates in about 74% of non-occulted flares and only in about 30% of partially occulted flares. On the other hand, the thermal component dominates in above 50% of partially occulted flares and only in about 2% of non-occulted flares.
In Fig. 7 we present the comparison between values of and for flares from histograms in Fig. 5b-c. The shift of the investigation towards higher energies reduces the heterogeneity of hard X-ray spectra seen in Fig. 6. The points are concentrated in areas I and II. It means that in energy range 23-93 keV only pure non-thermal spectra or thermal and non-thermal mixtures frequently occur. The statistics is presented in Table 3. Only total results are given because there is a few partially occulted events and they show values similar to non-occulted flares. As we can see, about 85% of flares during the hard X-ray maximum in energy band M1 (23-33 keV) show purely non-thermal spectra, but the thermal component is still present in about 15% of events.
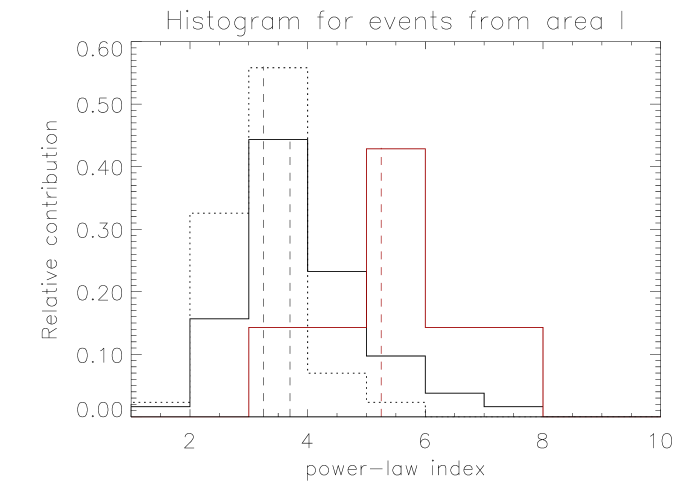
Let us check how much the deviations from power-law spectra have disturbed the obtained values of power-law indices. The histograms of values of the power-law index for flares situated in area I of Figs. 6 and 7 are presented in Fig. 8. We expect that these events are free of disturbances introduced by the thermal component and the photospheric albedo. The histogram of 185 non-occulted events from Fig. 6 resembles the histogram shown in Fig. 5b. Their medians are 3.71.1 and 4.01.1, respectively. This small difference is due to low amounts of thermally dominated flares in case of non-occulted events (see Table 2).
Partially occulted flares is another case. Due to a frequent occurrence of thermally dominated events (Table 2) the histogram shown in Fig. 8 is distinctly shifted towards lower values in comparison with the histogram presented in Fig. 5b. The medians are 5.21.4 and 6.71.4, respectively. In conclusion, after removing the contamination of hard X-rays with emission of thermal plasma, partially occulted flares in our survey still show higher values of the power-law index than non-occulted flares. However, the difference between medians of histograms in Figs. 5b and 8 has decreased from 2.7 to 1.5.
Is it possible to eliminate in this way the contribution of thermal emission completely? The comparison between histograms for non-occulted flares in Fig. 8 for two energy ranges of investigated spectra suggests that the interpretation should be done with caution. The histogram obtained for higher energies is slightly shifted towards lower values of the power-law index. Its median is 3.20.7 i.e. 0.5 lower than the median of the second histogram. This can be interpreted as the cause of an uncompensate thermal contribution, however, one cannot exclude another explanation, namely the broken power-law with the break energy around 50 keV (i.e. between energy bands M2 and H) and a flatter slope above this value.
4.3 Situation of coronal hard X-ray sources

In this subsection we use imaging ability of the HXT for investigating the spatial structure of coronal sources. In first step we have checked the dependence of observed hard X-ray spectra on the altitude of coronal sources above the solar surface.
In Fig. 9 we compared the power-law index to the altitude of the centroid of hard X-ray emission imaged in energy band L for 52 partially occulted flares. In case of multiple sources the situation of the brightest one was taken into account. The altitude was pointed out as a sum of two components: a height above the solar limb (column 9 in Table LABEL:occlist) and a occultation height . The latter one was calculated on the basis of heliospheric coordinates (column 6 in Table LABEL:occlist) as follows:
| (3) |
where is the longitude behind the solar limb and is the latitude. The main source of the altitude error is the uncertainty of the longitude (column 7 in Table LABEL:occlist). As we can see, no correlation is observed – flares showing hard X-ray spectra having different shapes occur at each altitude. We found a lack of correlation between the altitude and the power-law index also for higher energy ranges.
How are the non-thermal and thermal components in investigated flares spatially situated? To find out an answer, we compared the situation of coronal hard X-ray sources to the situation of bright loop-top kernels seen in soft X-rays. In Fig. 10 we compared a shift between centroids of emission in these two ranges of X-rays to the altitude of flares. We considered images of 41 partially occulted flares for which the hard X-ray image in energy band L and the soft X-ray image taken in the Be119 filter were obtained simultaneously. For a better clarity error bars are omitted. The typical error of the shift was estimated to be about 2 arcsec. The altitude error is the same as in Fig. 9.

For 26 events (63.4%) the spatial shift between the non-thermal and thermal components is not higher than 5 arcsec. The maximal values of the shift seem to be increasing with the altitude. However, this appearance can be caused by an increase with the altitude of magnetic features sizes, e.g. soft X-ray loop-top kernels (Pre & Kołomaski, 2007). To check this we have normalized the values presented in Fig. 10 by dividing the shift by a characteristic size of a hard X-ray source.
The range of values of the normalized shift seen in Fig. 11 was calculated as follows. We approximated the hard X-ray sources at the level of 0.5 as ellipses and divided the shifts from Fig. 10 by the large and small semi-axis of the ellipse. It establishes a lower and higher boundary of the normalized shift, respectively. As we can see, the normalized shift does not depend on the altitude and for the majority of events (36 from 41) does not exceed the value 0.5. The actual co-spatiality of hard X-ray and soft X-ray emission for some investigated events is even better because small semi-axes (high boundaries of normalized shifts) were shortened due to an occultation of the solar limb.

Figs. 10 and 11 do not distinguish which kind of emission, soft or hard X-ray, is situated higher. On the other hand, this appearance is crucial to fit to some theoretical models. Therefore, in Fig. 12 we present the radial separation between centroids of hard X-ray and soft X-ray emission for 41 partially occulted flares from Fig. 10. Almost a half of these events (21 from 41) show the same altitude of hard X-ay and soft X-ray emission, within error bars. The second half show the differences between them up to 14 arcsec with a supremacy of events in which hard X-ray emission is located higher than soft X-ray emission (15 from remaining 20). For 5 events soft X-ray emission was situated higher than hard X-ray emission.
In Figs. 9-12 we used images taken in energy band L as a representation of hard X-ray emission of investigated flares. One can doubt in conclusions formulated on the basis of observations in this energy band due to a strong contamination with emission of thermal plasma. Perhaps, Figs. 11-12 suggest co-spatiality of emissions in hard and soft X-rays as we observe actually the same thermal plasma? To verify this doubt we compare the situation of centroids of emission in energy band L to those imaged in higher energies. Unfortunately, a smaller number of events could be checked in this way, because for energy bands M1 and M2 were available only 16 and 5 images, respectively. We found that only for two events, Nos. 11 950 and 25 870, the radial separation between emission in energy band L and in higher energies is greater than 4 arcsec. The remaining 14 events are almost perfectly co-spatial.

5 Discussion and interpretation of results
Table 4 collects the results of surveys in which hard X-ray spectra of loop-top sources were investigated and compared to spectra of footpoint sources. A large number of solar flares included in these surveys allow us to expect that the results are statistically important.
| Time | Energy | Power-law index | |||||||||||||
|---|---|---|---|---|---|---|---|---|---|---|---|---|---|---|---|
| Satellite | period | range | loop-top | footpoint | Referencesb | ||||||||||
| [YY/MM] | [keV] | N | Mn | Md | SD | K | S | N | Mn | Md | SD | K | S | ||
| OSO-7 | 71/10-72/12 | 25 | 4.8 | 4.8 | 1.0 | -1.0 | 0.1 | 59 | 3.9 | 3.8 | 1.1 | -0.6 | 0.6 | (1) | |
| Yohkoh | 91/10-96/05 | 14-33 | 25 | 8.2 | 8.1 | 1.5 | -1.1 | -0.1 | 16 | 7.3 | 7.7 | 1.3 | -0.9 | -0.4 | (2) |
| Yohkoh | 91/10-98/08 | 14-53 | 12c | 6.6 | 6.2 | 1.5 | 0.2 | 0.4 | 18c | 5.2 | 4.9 | 1.6 | -1.0 | 0.4 | (3) |
| Yohkoh | 91/10-98/08 | 14-93 | 5c | 5.5 | 5.3 | 1.3 | -1.5 | 0.2 | 13c | 4.3 | 4.1 | 1.0 | -1.0 | 0.7 | (3) |
| Yohkoh | 91/10-01/12 | 14-33 | 52 | 7.5 | 7.6 | 1.6 | -0.5 | -0.1 | 620 | 4.8 | 4.6 | 1.6 | -0.6 | 0.4 | (4) |
| Yohkoh | 91/10-01/12 | 23-53 | 23 | 6.7 | 6.9 | 1.4 | -0.7 | -0.2 | 338 | 4.0 | 3.8 | 1.1 | 2.1 | 1.0 | (4) |
| Yohkoh | 91/10-01/12 | 33-93 | 3 | – | – | – | – | – | 155 | 3.4 | 3.4 | 0.7 | 1.2 | 0.6 | (4) |
| Yohkoh | 91/10-01/12 | 14-53 | 7d | 5.6 | 5.2 | 1.4 | -1.3 | 0.2 | 185d | 3.9 | 3.7 | 1.1 | 0.8 | 0.8 | (4) |
| Yohkoh | 91/10-01/12 | 23-93 | 1d | – | – | – | – | – | 130d | 3.3 | 3.2 | 0.7 | 1.4 | 0.6 | (4) |
| RHESSI | 02/02-04/08 | 50 | 5.4 | 5.5 | 1.2 | -0.8 | 0.3 | 0 | – | – | – | – | – | (5) | |
| RHESSI | 02/02-05/08 | 0 | – | – | – | – | – | 174c | 3.3 | 3.1 | 0.5 | 0.3 | 0.7 | (6) | |
| RHESSI | 02/02-05/08 | 97c | 5.0 | 4.7 | 2.0 | -0.8 | 0.3 | 137c | 4.3 | 3.6 | 1.8 | 0.8 | 1.1 | (7) | |
-
a
N – number of events; Mn – mean, Md – median, SD – standard deviation, K – kurtosis; S – skewness
-
b
(1) – Roy & Datlowe (1975); (2) – Mariska & McTiernan (1999); (3) – Petrosian et al. (2002); (4) – this issue; (5) – Krucker & Lin (2008); (6) – Saint-Hilaire et al. (2008); (7) – Ciborski & Tomczak (2009)
-
c
imaging spectroscopy
-
d
events uncharged with the thermal component
Table 4 contains two kinds of data. Papers (1), (2), (4), and (5) have gathered a set of partially occulted flares and in this way inform about spectra of coronal hard X-ray sources. These papers, in exception of the last one, present also, for a comparison, spectra for a set of non-occulted flares. They are actually a mixture of emission of loop-top and footpoint sources but it is believed that their spectra are dominated, especially in higher energies, by footpoint sources. Papers (3) and (7) basing on the imaging spectroscopy give characteristics of spectra of loop-top and footpoint sources of the same flares. Paper (6) also used the imaging spectroscopy but was limited to footpoint sources.
Histograms of values of the power-law index are represented in Table 4 by routine statistical parameters: mean, median, standard deviation, kurtosis and skewness. In papers (1) and (6) the source data was not published, therefore their statistical parameters were calculated under assumption that all events in a particular bin were equal to the middle value. The number of events means the number of flares or the number of hard X-ray sources in case of the imaging spectroscopy. For Yohkoh observations energy ranges of spectra fitting are given. In case of other observations basically the full available energy coverage were used, in exception of paper (6) in which the power-law was fitted above the cut-off energy.
The histograms gathered in Table 4 show different shapes for loop-top and footpoint sources. On the other hand, the histograms obtained for the same group of sources show similar shapes. Distributions of spectra of the loop-top sources show basically broad maxima which are almost symmetrical with a small excess for flatter spectra. Distributions of spectra of the footpoint sources show generally narrower maxima and are strongly asymmetric with an excess for steeper spectra.
To describe the most characteristic values of we use medians, because of the large skewness of distributions, especially for footpoint sources. The broad range of medians within both groups of sources is seen. This wide spread can be caused by many factors like: properties of instruments, methods of spectra selection and fitting, or criteria of selection of flares. Nevertheless, all performed surveys show that hard X-ray spectra of loop-top sources are systematically steeper than spectra of footpoint sources.
The medians obtained from low-energy bands of the HXT are especially shifted towards the higher values, due to a strong contamination with the thermal component. Moreover, in paper (2) very long times of integration additionally favor an influence of the thermal component. To avoid this contamination it is recommended to shift the spectral fitting towards higher energies, however this activity limits a number of considered events and charges the results with a selection effect. The comparison of slopes in different energy ranges of the hard X-ray spectrum, performed in Figs 6 and 7, allowed us to isolate some flares which were not charged with the thermal component even in lower energies. Thanks to that we have improved the statistics and our results look reasonably in comparison with medians obtained from surveys other than Yohkoh .
Medians of histograms from papers (1), (5), (6), and (7) concentrate between 4.7–5.5 and 3.1–3.8 for loop-top and footpoint sources, respectively. However, even these values are not completely free from some systematic charges. The spectrum of the non-occulted flare is a mixture of photons emitted from footpoints and from the coronal part. Despite an usual domination of footpoints, the usage of the spectrum of the non-occulted flare as a representation of footpoint sources introduces some bias. On the other hand, imaging spectroscopy can distort spectra of fainter sources (usually the loop-top ones) in the presence of brighter sources (usually the footpoint ones). To overcome this limit partially occulted flares are chosen, although a not precise enough selection can be confusing. This is probably the case for paper (1) in which limb flares () show similar values of to those obtained for partially occulted flares. In paper (6) the distribution at high is distorted by observational bias because only flares with hard spectra (above 50 keV) were studied.
We have found the presence of the non-thermal component in 11 from 23 (48%) of partially occulted flares. In next 10 from 23 flares (43%), some impulsive non-thermal episodes similar to those described by Tomczak (2001) are seen, but the impulses modify only slightly thermal appearance of these flares. In earlier surveys the non-thermal component was discovered in 25 from 37 (Roy & Datlowe, 1975) and in 50 from 55 flares (Krucker & Lin, 2008) i.e. in 68% and 91% of events, respectively. We estimated also the frequency of occurrence of the non-thermal component for loop-top sources described by Petrosian et al. (2002) comparing values of in 14-34 and 23-53 keV energy ranges. The result is 65% (11 from 17 events).
The spatial situation of the non-thermal and thermal components is common for the majority of investigated flares. The same rule can be concluded from the earlier papers (Tomczak, 2001; Krucker & Lin, 2008). Masuda (1994) found that the coronal hard X-ray sources situated above the soft X-ray loop-top kernels show spectra which are as flat as the spectra of the footpoint sources. In our survey, flares, for which the hard X-ray and soft X-ray components are spatially separated, do not show unusually flat spectra. The extremely shifted event in the survey of Krucker & Lin (2008), the flare of 2003 November 18, also shows a modest value of equal 5.6.
What do the spectra of hard X-ray sources teach us about non-thermal electron beams in solar flares? In the simplest scenario, the same electron beam, described by the power-law index , radiates hard X-ray photons in the thin-target loop-top and thick-target footpoint sources. Spectra emitted by these two kinds of sources have the indices that differ by 2: and . Mariska et al. (1996) have obtained such a difference and gave the interpretation for partially occulted and non-occulted flares, but a small number of investigated events (4 + 4) needed a verification for better statistics.
Without any exception, the surveys presented in Table 4 confirm that the loop-top sources are systematically steeper than the footpoint ones, i.e. . In this paper we have obtained differences between medians of distributions of values, , to be about 3. However, the results are seriously charged by the contamination with the thermal component. The difference, , for uncharged events is about 1.5. We would like to stress that similar values of the difference , between 1 and 1.5, were obtained in the majority of other surveys in Table 4.
The difference, , means that a part of investigated flares has broken the simplest scenario, . The shape of distribution of values, which is more symmetric and broader for loop-top sources in comparison with footpoint ones, can suggest a solution. We guess that some loop-top sources which emitted hard X-rays in the thick-target mechanism are responsible for this. A low-value wing of the distribution for loop-top sources is occupied by flares in which X-ray plasma ejections were observed, hence perhaps a kind of magnetic trapping occurs. Another opportunity for the coronal thick-target emission may be an unusually-high filling of a flare loop with plasma (Kosugi et al., 1994; Veronig & Brown, 2004).
Values of the difference higher than 2 need to employ other explanations like, for example, separate non-thermal electron beams responsible for loop-top and footpoint sources or deceleration of the precipitating electrons in electric fields due to return currents (Battaglia & Benz, 2008).
A lack of correlation between the altitude and the power-law index , seen in Fig. 9, suggests that the investigated flares do not respond the overall (global) magnetic configuration of the solar corona. For their characteristics is rather conclusive the local magnetic configuration in which these flares were developed.
We found the non-thermal component for the majority of the investigated flares similarly to the earlier surveys. We have pointed out that in most cases the non-thermal and thermal components (the hard X-ray loop-top source and the bright loop-top kernel, respectively) are co-spatial or overlap during the impulsive phase which confirms that both emissions come from the common plasma volume and are strongly coupled. Events in which both components are clearly separated, like “Masuda flare”, occur seldom and are not obviously characterized by a flat hard X-ray spectrum. The similar conclusion was given by Krucker & Lin (2008).
We would like to stress clear inconsistency between a picture of a flare that is shaped by statistical surveys (i.e. what typical is) and by individual famous events (i.e. what a challenge is). On the other hand, the models adopted to explain a specific configuration, like in Masuda flare, are used very often for a kind of unification i.e. for explanation of all flares. There is no doubt that frequency of occurrence should not be a conclusive criterion to perform an interpretation, but there is no reason to recognize such unusual structure, like in Masuda flare, in each flare, as well.
Why Masuda-type flares are poorly represented in statistical surveys like ours, though new examples are recently reported (Shimizu et al., 2008)? Such an unusual appearance is seen during short episodes occurring randomly in time. On the other hand, one flare is usually represented in catalogues by one time period around the maximum. Thus, it is quite easy to miss such an interesting episode. For example, the famous above-the-loop-top hard X-ray source discovered in Masuda flare is seen at the beginning of the impulsive phase and during the hard X-ray maximum is dominated by the strong footpoint sources. In conclusion, searching for interesting episodes needs careful selection of a sequence of images illustrating the evolution.
Recently, Jakimiec & Tomczak (2009) proposed a model of oscillating magnetic traps in which flares appear as a cusp-like plasma volume. It accelerates particles during the compression (hard X-ray emission), but during the expansion is feeded with plasma coming from chromospheric evaporation (soft X-ray emission). This model anticipates episodes in which the magnetic mirror ratio remains greater than 1 during the compression, so the accelerated electrons remain there for a longer time and therefore locally generate enhanced hard X-ray emission. Indeed, in most cases of the presented survey we observe a clear quasi-periodicity of hard X-ray light curves.
| Catalogue | Date | GOES | Longi- | Occultation | range | Time |
|---|---|---|---|---|---|---|
| number | class | tude | height [Mm] | interval | ||
| 9700 | 1994 February 27 | M2.8 | W97.5 | 6.1 | 64 | 09:09-09:18 |
| 11950 | 1998 May 9 | M7.7 | W102.3 | 17.1 | 6.03.4 | 03:29-03:39 |
| 25540a | 2001 April 1 | M5.5 | E107.0 | 34.1 | 117.6b | 11:48-11:54 |
-
a
Only the decay phase is available
-
b
Strong contamination with emission of thermal plasma
6 Interesting groups of events
In this Section short descriptions of interesting group of events from our survey are given.
6.1 Progressive spectral hardening
Relatively less frequent group of flares shows in hard X-rays a progressively hardening spectral evolution that can be described schematically by the pattern: “soft-hard-harder” (SHH). These flares are very interesting due to their association with other solar activity phenomena like: Coronal Mass Ejections, Solar Energetic Particles, radio bursts type II and type IV. Early reports located the radiation of the SHH flares clearly above the solar surface, inside a postflare loop system where electrons are accelerated and trapped (Cliver et al., 1986, and references therein). However, this picture was directly confirmed only for a few events that occurred some distance behind the solar limb or were imaged below 40 keV by Hinotori.
The Yohkoh HXT introduced a new picture of SHH flares in which their emission is situated close to the solar surface, at flare footpoints (Qiu et al., 2004; Takasaki et al., 2007). The dominance of footpoint emission was confirmed also for some SHH flares observed by RHESSI (Saldanha et al., 2008; Grigis & Benz, 2008). Primarily thick-target footpoint sources emit their hard X-rays immediately, therefore the SHH spectral pattern cannot be explained by the trapping mechanism only. Footpoint SHH flares strongly suggest a physical mechanism that continuously accelerates electrons to ever higher energies.
In our survey we found three flares showing the SHH spectral pattern. Their basic characteristics are given in Table 5. All occurred far enough behind the solar limb to eliminate the hard X-ray emission from footpoints. Thanks to that, a better insight into the coronal part is possible. Tomczak (2008) noted that the SHH spectral pattern coincides in time with the occurrence of a new coronal source. In case of 1998 May 9 this source moved away gradually with the velocity increasing from 25 to 80 km s-1.
| Catalogue | Date | GOES | Longi- | Occultation | Photons |
|---|---|---|---|---|---|
| number | class | tude | height [Mm] | energy [keV] | |
| 6240 | 1992 November 2 | X9.0 | W97.9 | 7.4 | 600a |
| 11650 | 1998 April 23 | X1.2 | E103.7 | 21.4 | 250 |
| 11950 | 1998 May 9 | M7.7 | W102.3 | 17.1 | 200 |
| 13650 | 1998 November 24 | X1.0 | W103.1 | 21.5 | 600a |
| 26060 | 2001 April 18 | C2.2 | W116.9 | 90.5 | 250 |
-
a
Only the decay phase is available
The progressive spectral hardening in flares from Table 5 was always preceded by a phase of the “soft-hard-harder” (SHH) spectral evolution pattern in which another hard X-ray source was seen. Such a behavior strongly suggests that a switch between the SHS and SHH spectral pattern needs a serious reconfiguration of magnetic structure of a flare.
6.2 Coronal -ray sources
Thanks to RHESSI imaging capabilities it is possible to obtain hard X-ray images in higher energies than earlier. The results limited by counting statistics and dynamic range show that -rays are emitted usually from footpoints (Saldanha et al., 2008) though an example of the coronal source is also known (Krucker et al., 2008b). Yohkoh could not image such high energies, however we found in the HXT Flare Catalogue five events, recorded by the WBS, that occurred behind the solar limb and which spectra reach at least 200 keV (see Table 6).
All these events occurred far enough behind the solar limb to be sure that the high-energy photons are emitted from the corona. In this way, without imaging, we obtain an independent confirmation that -rays can be produced in the corona. The flare of 1998 November 24, which produced 600-keV photons about 3 minutes after its maximum, attracts special attention. According to the CGRO/BATSE light curve, the flux decreased almost twice during this time interval, hence in the maximum the photons more energetic than 600 keV were emitted.
Krucker et al. (2008b) interpret the coronal -ray emission as relativistic electron-electron bremsstrahlung at energies perhaps of a few MeV. Therefore, these observations directly imply that flare-accelerated MeV electrons reside stably in the corona, losing their energy collisionally and producing -ray continuum.
7 Conclusions
Among from 1286 flares in the Yohkoh Hard X-ray Telescope Flare Catalogue, for which the hard X-ray images had been enclosed, we identified 98 events that occurred behind the solar limb. Obscurity of footpoints, that are usually brighter in hard X-rays, allowed us to isolate the coronal parts of these flares for a more detailed analysis. We investigated hard X-ray spectra and spatial structure of partially occulted flares. We found that in most cases their hard X-ray spectra consists of two co-spatial components, non-thermal and thermal.
We note that the spectra of partially occulted flares are systematically steeper than spectra of non-occulted events in the Catalogue. It shows that the hard X-ray emission in solar flares is usually less energetic in the coronal part (loop-top sources) and more energetic close to the solar surface (footpoint sources). The difference between medians of values of the power-law index for both classes of sources, , is about 3. However, this result is strongly affected with thermal emission. For events unbiased with the thermal component the difference is equal 1.5. The obtained value is similar to results of other surveys.
We judge that different slopes of the non-thermal component are caused basically by different mechanisms of emission: thin-target for loop-top sources and thick-target for footpoint sources. The difference of smaller than 2 suggests some exceptions from this rule. We have presented some arguments that a part of coronal hard X-ray sources is thick-target instead of to be thin-target, e.g. several unusually high-energetic events which has occurred in configuration suggesting a magnetic trapping. An additional argument, that for characteristics of flares conclusive is local magnetic configuration in which they develops, is a lack of correlation between the altitude of flares and the hard X-ray power-law index .
Further good observations and precise analysis are needed to arbitrate about details of non-thermal electrons acceleration and propagation in solar flares. Detailed imaging spectroscopy of individual events as well as massive surveys of many flares are desired.
Acknowledgements.
The Yohkoh satellite is a project of the Institute of Space and Astronautical Science of Japan. I am grateful to late Professor Takeo Kosugi, Dr. Jun Sato, and their collaborators for preparing the Yohkoh HXT Flare Catalogue which made this work easier. I thank also my colleagues from a working group of the International Space Science Institute (Bern, Switzerland), dedicated to coronal hard X-ray sources, for a fruitful discussion. This work was supported by Polish Ministry of Science and High Education grant No. N N203 1937 33.References
- Alexander & Metcalf (1997) Alexander, D., & Metcalf, T. R. 1997, ApJ, 489, 442
- Battaglia & Benz (2008) Battaglia, M., & Benz, A. ,O. 2008, A&A, 487, 337
- Brown (1971) Brown, J. C. 1971, Sol. Phys., 18, 489
- Catalano & Van Allen (1973) Catalano, C. P., & Van Allen, J. A. 1973, ApJ, 185, 335
- Ciborski & Tomczak (2009) Ciborski, T., & Tomczak, M. 2009, Cent. Eur. Astrophys. Bull., submitted
- Cliver et al. (1986) Cliver, E. W., Dennis, B. R., Kiplinger, A. L., et al. 1986, ApJ, 305, 920
- Frost & Dennis (1971) Frost, K. J., & Dennis, B. R. 1971, ApJ, 165, 655
- Grigis & Benz (2008) Grigis, P. C., & Benz, A. O. 2008, ApJ, 683, 1180
- Hudson (1978) Hudson, H. S. 1978, ApJ, 224, 235
- Hudson et al. (1982) Hudson, H. S., Lin, R. P., & Stewart, R. T. 1982, Sol. Phys., 75, 245
- Hudson et al. (1994) Hudson, H. S., Strong, K. T., Dennis, B. R., et al. 1994, ApJ, 422, L25
- Hudson et al. (2001) Hudson, H. S., Kosugi, T., Nitta, N. V., & Shimojo, M. 2001, ApJ, 561, L211
- Jakimiec & Tomczak (2009) Jakimiec, J., & Tomczak, M. 2009, A&A, submitted
- Kane et al. (1982) Kane, S. R., Fenimore, E. E., Klebesadel, R. W., & Laros, R. G. 1982, ApJ, 254, L53
- Kaparova et al. (2007) Kaparova, J., Kontar, E. P., & Brown, J. C. 2007, A&A, 466, 705
- Khan et al. (1995) Khan, J. I., Harra-Murnion, L. K., Hudson, H. S., Lemen, J. R., & Sterling, A. C. 1995, ApJ, 452, L153
- Kosugi et al. (1991) Kosugi, T., Makishima, K., Murakami, T., at al. 1991, Sol. Phys., 136, 17
- Kosugi et al. (1993) Kosugi, T., and Yohkoh HXT Group 1993, The Yohkoh HXT Databook (I), 1991 October - 1992 December, National Astronomical Observatory, Mitaka, Tokyo, Japan (Version 1)
- Kosugi et al. (1994) Kosugi, T., Sakao, T., Masuda, S., et al. 1994, Proc. Kofu Symposium: New Look at the Sun with Emphasis on Advanced Observations of Coronal Dynamics and Flares, (eds. S. Enome, T. Hirayama), Nobeyama Radio Observatory Report No. 360, 127
- Kosugi et al. (1995) Kosugi, T., Sawa, M., Sakao, T., et al. 1995, The Yohkoh HXT Databook: October 1991 - December 1994, National Astronomical Observatory, Mitaka, Tokyo, Japan (Version 2)
- Krucker & Lin (2008) Krucker, S., & Lin, R. P. 2008, ApJ, 673, 1181
- Krucker et al. (2007a) Krucker, S., White, S. M., & Lin, R. P. 2007a, ApJ, 669, L49
- Krucker et al. (2007b) Krucker, S., Hannah, I. G., & Lin, R. P. 2007b, ApJ, 671, L193
- Krucker et al. (2008a) Krucker, S., Battaglia, M., Cargill, P. J., et al. 2008a, A&A Rev., 16, 155
- Krucker et al. (2008b) Krucker, S., Hurford, G. J., McKinnon, A. L., Shih, A. Y., and Lin, R. P. 2008b, ApJ, 678, L63
- Krucker et al. (2009) Krucker, S., Wuelser, J.-P., Vourlidas, A., et al. 2009, in preparation
- Li & Gan (2006) Li, Y. P., & Gan, W. Q. 2006, ApJ, 652, L61
- Li & Gan (2007) Li, Y. P., & Gan, W. Q. 2007, Adv. Space Res., 39, 1389
- Lin (1974) Lin, R. P. 1974, Space Sci. Rev., 16, 189
- Liu et al. (2008) Liu, W., Petrosian, V., Dennis, B. R. & Jiang, Y. W. 2008, ApJ, 676, 704
- Mariska & Doschek (1997) Mariska, J. T., & Doschek, G. A. 1997, ApJ, 485, 904
- Mariska & McTiernan (1999) Mariska, J. T., & McTiernan, J. M. 1999, ApJ, 514, 484
- Mariska et al. (1996) Mariska, J. T., Sakao, T., & Bentley, R. D. 1996, ApJ, 459, 815
- Masuda (1994) Masuda, S. 1994, Ph. D. Thesis, University of Tokyo
- Masuda et al. (1994) Masuda S., Kosugi, T., Hara, H., Tsuneta, S., & Ogawara, Y. 1994, Nature, 371, 495
- McKenzie (1975) McKenzie, D. L. 1975, Sol. Phys., 40, 183
- Newton & Nunn (1951) Newton, H. W., & Nunn, M. L. 1951, MNRAS, 111, 413
- Ohyama & Shibata (1997) Ohyama, M. & Shibata, K. 1997, PASJ, 49, 249
- Petrosian et al. (2002) Petrosian, V., Donaghy, T. Q., & McTiernan, J. M. 2002, ApJ, 569, 459
- Pre & Kołomaski (2007) Pre, P., & Kołomaski, S. 2007, Cent. Eur. Astrophys. Bull., 31, 87
- Qiu et al. (2004) Qiu, J., Lee, J., & Gary, D. E. 2004, ApJ, 603, 335
- Roy & Datlowe (1975) Roy, J.-R., & Datlowe, D. W. 1975, Sol. Phys., 40, 165
- Sato (2001) Sato, J. 2001, ApJ, 558, L137
- Sato et al. (1998) Sato, J., Sawa, M., Masuda, S., et al. 1998, The Yohkoh HXT Image Catalogue: October 1991 – August 1998, Nobeyama Radio Observatory, National Astronomical Observatory, Japan (Version 3)
- Sato et al. (2003) Sato, J., Sawa, M., Yoshimura, K., Masuda, S., and Kosugi, T. 2003, The Yohkoh HXT/SXT Flare Catalogue, Montana State University and Institute of Space and Astronautical Science (Version 4)
- Sato et al. (2006) Sato, J., Matsumoto, Y., Yoshimura, K., et al. 2006, Sol. Phys., 236, 351 (Version 5)
- Saint-Hilaire et al. (2008) Saint-Hilaire, P., Krucker, S., & Lin, R. P. 2008, Sol. Phys., 250, 53
- Saldanha et al. (2008) Saldanha, R., Krucker, S., & Lin, R. P. 2008 ApJ, 673, 1169
- Shimizu et al. (2008) Shimizu, M., Nishida, K., Takasaki, H., et. al. 2008, ApJ, 683, L203
- Sterling et al. (1996) Sterling, A. C., Harra-Murnion, L. K., Hudson, H. S., & Lemen, J. R. 1996, ApJ, 464, 498
- Takasaki et al. (2007) Takasaki, H., Kiyohara, J., Asai, A., et al. 2007, ApJ, 661, 1234
- Tomczak (1997) Tomczak, M. 1997, A&A, 317, 223
- Tomczak (2001) Tomczak, M. 2001, A&A, 366, 294
- Tomczak (2004) Tomczak, M. 2004, A&A, 417, 1133
- Tomczak (2005) Tomczak, M. 2005, Adv. Space Res., 35, 1732
- Tomczak (2008) Tomczak, M. 2008, Cent. Eur. Astrophys. Bull., 32, 59
- Tomczak & Ciborski (2007) Tomczak, M., & Ciborski, T. 2007, A&A, 461, 315
- Veronig & Brown (2004) Veronig, A. M., & Brown, J. C. 2004, ApJ, 603, L117
- Ward (1966) Ward, F. 1966, ApJ, 145, 416
- Zhang & Huang (2003) Zhang, J., & Huang, G. L. 2003, ApJ, 592, L49
- Zirin et al. (1969) Zirin, H., Ingham, W., Hudson, H., McKenzie, D. 1969, Sol. Phys., 9, 269
| (1) | (2) | (3) | (4) | (5) | (6) | (7) | (8) | (9) | (10) | (11) | (12) | (13) | (14) |
|---|---|---|---|---|---|---|---|---|---|---|---|---|---|
| 00180 | 1991/10/21 | 12:51:00+38 | C7.8 | 6891 | S12E92.5 | 0.8 | 4.6 | 1.0 | 2.5 | 8.0 | … | … | e,o,s |
| 01050 | 1991/11/30 | 19:07:01+288 | M1.0 | 6952 | N21E108.4 | 1.2 | 34.4 | 1.0 | 42.0 | 9.4 | … | … | m |
| 01060 | 1991/12/02 | 04:53:11+76 | M3.6 | 6952 | N18E91.5 | 2.4 | 2.8 | 4.3 | 7.9 | 5.5 | 5.0 | … | m |
| 01320 | 1991/12/09 | 02:03:08+57 | M1.4 | 6966 | S06E91.0 | 1.0 | 1.9 | 2.0 | 3.7 | 9.5 | … | … | e,o,s |
| 01340 | 1991/12/09 | 04:19:09+242.5 | M3.6 | 6966 | S06E89.8 | 1.0 | 0 | 3.5 | 6.2 | 10.6 | … | … | e,m,o |
| 02270 | 1992/01/13 | 19:04:35+349.5 | M1.3 | 7012 | S10E95.3 | 0.9 | 10.1 | 4.9 | 11.8 | 9.9 | … | … | m |
| 02860 | 1992/02/06 | 20:51:22+240.5 | M4.1 | 7030 | N05W93.8 | 3.0 | 6.8 | 4.6 | 9.7 | 8.7 | … | … | m |
| 03270 | 1992/02/19 | 14:45:14+429 | C9.4 | 7067 | N06E94.4 | 1.8 | 8.4 | 3.0 | 7.4 | 8.5 | … | … | m |
| 04270 | 1992/06/28 | 04:47:05+153.5 | X1.8 | 7205 | N12W101.5 | 2.2 | 21.3 | 14.8 | 41.4 | 6.3 | 6.4 | … | e,s |
| 05090 | 1992/08/25 | 19:02:52+160 | C8.7 | 7260 | N13W98.2 | 2.0 | 15.2 | 14.1 | 32.7 | 8.5 | … | … | s |
| 05210 | 1992/09/06 | 09:20:11+27 | C8.3 | 7276 | N15E101.4 | 0.5 | 21.1 | 1.0 | 16.3 | 6.1 | … | … | s |
| 05260 | 1992/09/06 | 23:37:17+29 | M1.3 | 7276 | N17E93.6 | 2.6 | 6.4 | 1.0 | 3.2 | 8.3 | 7.5 | … | o,s |
| 05590 | 1992/10/05 | 09:24:28+47.5 | M2.0 | 7293 | S08W89.7 | 3.9 | 0 | 2.0 | 3.6 | 4.3 | 4.3 | … | o,s |
| 05920 | 1992/10/27 | 22:17:44+104.5 | C5.4 | 7315 | N07W88.5 | 1.5 | 0 | 4.1 | 7.5 | 7.6 | … | … | m,o |
| 06230 | 1992/11/01 | 11:44:06+53.5 | C4.9 | 7321 | S25W89.3 | 2.2 | 0 | 11.9 | 21.2 | 5.9 | 8.7 | … | o,s |
| 06240 | 1992/11/02 | 02:59:49+42 | X9.0 | 7321 | S25W97.9 | 2.3 | 14.2 | 14.6 | 33.6 | 8.0 | 7.3 | 6.0 | e,g,s |
| 06280 | 1992/11/05 | 20:30:17+167.5 | C8.2 | 7323 | S17W91.5 | 2.0 | 2.6 | 5.0 | 9.1 | 8.7 | … | … | s |
| 06440 | 1992/11/24 | 10:01:02+157 | C6.9 | 7342 | S07W95.5 | 5.0 | 7.4 | 3.0 | 8.6 | 6.5 | … | … | s |
| 06480 | 1992/11/24 | 20:31:03+271.5 | C6.4 | 7342 | S07W101.2 | 5.2 | 17.9 | 1.5 | 16.3 | 8.7 | … | … | e,m |
| 06810 | 1993/02/01 | 01:57:59+151 | M2.2 | 7416 | S10E92.6 | 1.7 | 4.6 | 1.0 | 2.5 | 6.9 | 4.6 | … | m,o |
| 06820 | 1993/02/01 | 06:58:25+119.5 | M1.4 | 7416 | S09E89.8 | 2.3 | 0.0 | 0.5 | 0.9 | 9.9 | … | … | e,m,o |
| 07580 | 1993/03/15 | 19:07:00+138.5 | C5.5 | 7440 | S06W91.6 | 2.0 | 3.0 | 3.5 | 6.5 | 7.5 | … | … | m |
| 07590 | 1993/03/15 | 21:05:53+479 | M3.0 | 7440 | S03W92.7 | 2.0 | 4.9 | 29.5 | 53.3 | 10.5 | … | … | e,m |
| 07680 | 1993/03/24 | 03:21:45+42 | C6.6 | 7448 | N15W92.1 | 3.7 | 3.8 | 2.7 | 5.3 | 6.2 | 7.4 | … | s |
| 08220 | 1993/06/24 | 14:54:48+176 | C5.9 | 7530 | S11E90.9 | 0.7 | 1.7 | 1.0 | 1.9 | 9.8 | … | … | m,o |
| 08230 | 1993/06/24 | 17:27:32+132.5 | M4.2 | 7530 | S11E89.5 | 0.7 | 0 | 4.6 | 8.2 | 10.8 | … | … | e,s |
| 08460 | 1993/09/26 | 10:26:04+63 | C3.4 | 7590 | N14E98.0 | 1.1 | 14.0 | 1.0 | 8.8 | 7.1 | … | … | e,s |
| 08470 | 1993/09/26 | 17:26:03+61 | C3.4 | 7590 | N14E94.0 | 1.1 | 7.0 | 1.0 | 3.5 | 7.6 | … | … | s |
| 08480 | 1993/09/26 | 18:29:18+54.5 | C2.6 | 7590 | N14E93.4 | 1.1 | 5.9 | 1.1 | 3.2 | 5.6 | 5.7 | … | s |
| 09650 | 1994/01/29 | 04:10:16+132 | M2.4 | 7654 | N05W92.9 | 1.9 | 5.2 | 3.0 | 6.2 | … | … | … | c,s |
| 09660 | 1994/01/29 | 11:24:49+80.5 | M2.4 | 7654 | N07W97.0 | 1.9 | 12.4 | 6.5 | 16.9 | 7.0 | 8.1 | … | m |
| 09700 | 1994/02/27 | 09:06:47+541 | M2.8 | 7671 | N08W97.5 | 3.8 | 13.6 | 12.6 | 38.6 | 7.9 | … | … | h,m |
| 11090 | 1997/11/25 | 05:34:45+162.5 | C5.0 | 8113 | N21E96.4 | 0.7 | 12.2 | 8.9 | 20.6 | 8.0 | … | … | s |
| 11100 | 1997/11/25 | 14:40:44+37.5 | C1.1 | 8113 | N21E91.6 | 0.6 | 3.1 | 0.5 | 1.2 | 5.6 | … | … | o,s |
| 11290 | 1998/01/03 | 17:13:25+127 | M2.7 | 8124 | S20W102.0 | 2.8 | 22.0 | 3.5 | 22.9 | 7.1 | 7.8 | … | m |
| 11510 | 1998/03/23 | 02:59:31+121.5 | M2.3 | 8179 | S22W99.3 | 1.9 | 16.6 | 15.7 | 38.3 | 8.4 | … | … | s |
| 11530 | 1998/03/24 | 01:47:46+60 | C2.3 | 8180 | S32W98.9 | 3.0 | 16.7 | 10.8 | 29.4 | 5.8 | … | … | s |
| 11540 | 1998/03/24 | 04:42:15+75 | C4.3 | 8180 | S32W100.5 | 3.0 | 19.7 | 10.0 | 32.0 | 6.3 | … | … | s |
| 11650 | 1998/04/23 | 05:39:55+151 | X1.2 | 8210 | S18E103.7 | 0.7 | 25.5 | 2.2 | 30.0 | 7.7 | 7.7 | 2.4 | g,s |
| 11660 | 1998/04/24 | 08:46:23+74.5 | C8.9 | 8210 | S20E91.3 | 2.2 | 2.3 | 13.5 | 24.2 | 4.7 | 5.1 | … | s |
| 11910 | 1998/05/08 | 14:20:54+67.5 | M1.8 | 8210 | S17W95.2 | 1.5 | 9.7 | 7.4 | 16.2 | 10.2 | … | … | e,s |
| 11930 | 1998/05/09 | 00:17:53+22.5 | C8.3 | 8210 | S14W100.6 | 1.6 | 19.7 | 1.1 | 14.4 | 6.3 | … | … | s |
| 11950 | 1998/05/09 | 03:22:56+70.5 | M7.7 | 8210 | S17W102.3 | 1.6 | 22.8 | 1.4 | 19.6 | 6.8 | 6.1 | 3.9 | g,h,s |
| 12000 | 1998/05/10 | 08:26:33+113 | M1.6 | 8220 | S27E91.4 | 2.4 | 2.6 | 4.5 | 8.2 | 9.8 | … | … | e,s |
| 12010 | 1998/05/10 | 13:18:30+14 | M3.9 | 8220 | S27E88.8 | 2.4 | 0 | 1.1 | 2.1 | 4.9 | 3.5 | 3.3 | e,o,s |
| 13580 | 1998/11/22 | 12:21:38+317.5 | C8.8 | 8393 | S17E93.4 | 4.2 | 6.2 | 3.0 | 6.6 | 8.8 | … | … | m |
| 13610 | 1998/11/23 | 05:58:41+39.5 | C4.9 | 8384 | S29W92.3 | 2.0 | 4.3 | 4.2 | 8.1 | 6.1 | 7.5 | … | s |
| 13620 | 1998/11/23 | 06:53:06+5.5 | X2.2 | 8384 | S29W92.8 | 2.0 | 5.2 | 8.3 | 15.7 | 10.3 | … | … | e,s |
| 13650 | 1998/11/24 | 02:17:48+316.5 | X1.0 | 8384 | S30W103.1 | 2.0 | 24.5 | 3.2 | 27.3 | 8.8 | 9.6 | 4.5 | e,g,m |
| 15640 | 1999/06/17 | 17:20:47+56.5 | M3.6 | 8584 | N22W?? | … | 0 | 5.9 | 10.5 | 7.7 | … | … | e,s |
| 16290 | 1999/07/23 | 05:01:27+44 | C9.4 | 8645 | S23E97.4 | 3.3 | 13.8 | 4.0 | 13.5 | 6.8 | … | … | s |
| 16310 | 1999/07/23 | 15:56:13+21.5 | M1.0 | 8645 | S26E91.6 | 3.3 | 3.0 | 1.1 | 2.3 | 5.5 | 6.5 | … | o,s |
| 16810 | 1999/08/07 | 19:13:10+309 | M1.2 | 8645 | S20W103.1 | 3.3 | 24.4 | 9.3 | 36.8 | 10.9 | … | … | e,s |
| 16820 | 1999/08/07 | 20:54:08+741 | M1.7 | 8645 | S29W104.0 | 3.3 | 26.1 | 3.9 | 31.5 | 10.0 | … | … | m |
| 17400 | 1999/10/01 | 00:15:28+60.5 | C7.7 | 8716 | N22E95.8 | 2.2 | 10.7 | 1.1 | 5.8 | 7.8 | … | … | s |
| 17710 | 1999/10/27 | 09:09:39+90.5 | M1.0 | 8737 | S12W87.8 | 5.9 | 0 | 1.8 | 3.2 | 6.0 | 4.4 | … | o,s |
| 17720 | 1999/10/27 | 13:28:21+535 | M1.8 | 8737 | S15W90.3 | 6.0 | 0.6 | 4.0 | 7.1 | 9.1 | … | … | m |
| 17730 | 1999/10/27 | 15:28:00+762 | M1.4 | 8737 | S14W91.6 | 6.0 | 2.6 | 11.5 | 20.7 | 9.9 | … | … | m |
| 17790 | 1999/11/05 | 18:16:47+34 | M3.0 | 8759 | N12E95.8 | 1.3 | 11.0 | 7.0 | 16.2 | 8.4 | … | … | e,s |
| 18610 | 1999/12/17 | 00:19:22+74 | C7.0 | 8806 | N19E91.8 | 0.7 | 3.4 | 1.0 | 2.1 | 7.9 | 7.8 | … | o,s |
| 19030 | 2000/01/18 | 09:37:03+299 | M1.2 | 8827 | S15W105.6 | 3.1 | 28.2 | 1.8 | 30.9 | 6.8 | 7.0 | … | m |
| 19630 | 2000/03/07 | 03:48:58+24 | C2.9 | 8906 | S16E95.9 | 6.7 | 10.7 | 1.6 | 6.7 | 7.0 | … | … | o,s |
| 20920 | 2000/05/03 | 22:58:52+741 | M1.1 | 8970 | S18W90.1 | 2.2 | 0.0 | 7.4 | 13.2 | 9.3 | … | … | m |
| 20930 | 2000/05/05 | 15:18:42+1954 | M1.5 | 8970 | S18W110.1 | 3.7 | 37.5 | 2.2 | 51.6 | 8.5 | 4.7 | … | m |
| 20980 | 2000/05/12 | 08:41:48+85 | C8.1 | 8998 | S14E90.5 | 3.9 | 0.9 | 3.6 | 6.4 | 9.1 | … | … | s |
| 21030 | 2000/05/13 | 01:36:19+232 | M1.1 | 9002 | N22E108.8 | 0.8 | 33.8 | 4.9 | 51.5 | 9.5 | … | … | e,s |
| 21050 | 2000/05/14 | 00:25:08+97.5 | C7.5 | 9002 | N22E96.1 | 0.7 | 11.0 | 4.5 | 12.3 | 7.2 | … | … | e,s |
| 21280 | 2000/05/17 | 04:02:46+14 | C7.1 | 8993 | S20W90.4 | 1.7 | 0.7 | 2.0 | 3.6 | 4.6 | 5.0 | … | o,s |
| 21530 | 2000/05/24 | 03:13:26+83.5 | C7.0 | 9017 | S12E92.9 | 3.0 | 5.3 | 2.1 | 4.6 | 7.9 | … | … | o,s |
| 21880 | 2000/06/12 | 01:37:32+10 | C6.1 | 9042 | N21E91.2 | 7.8 | 2.2 | 1.6 | 3.0 | 5.8 | 4.1 | … | o,s |
| 22570 | 2000/07/15 | 04:33:29+32 | C2.7 | 9090 | N14E94.8 | 0.8 | 8.5 | 0.5 | 3.4 | … | … | … | l,s |
| 23070 | 2000/07/27 | 16:46:58+111 | M1.5 | 9087 | S09W105.4 | 1.2 | 26.9 | 5.7 | 36.7 | 7.2 | 8.4 | … | s |
| 23590 | 2000/09/22 | 23:46:52+69 | C8.5 | 9165 | N14W94.5 | 1.5 | 8.0 | 4.6 | 10.4 | 5.6 | 6.6 | … | s |
| 23750 | 2000/09/30 | 20:15:37+17.5 | M1.8 | 9169 | N07W90.8 | 2.3 | 1.4 | 3.6 | 6.5 | 9.2 | … | … | e,s |
| 23780 | 2000/10/01 | 07:01:39+26 | M5.0 | 9169 | N08W96.8 | 2.4 | 12.2 | 10.6 | 23.9 | 10.2 | … | … | e,s |
| 23790 | 2000/10/01 | 14:00:08+56 | M2.2 | 9169 | N09W100.7 | 2.4 | 19.2 | 2.1 | 16.3 | 6.0 | 6.6 | … | m |
| 23810 | 2000/10/02 | 02:17:44+23 | C5.0 | 9182 | N01E89.6 | 1.4 | 0 | 2.0 | 3.6 | 4.8 | 4.6 | … | o,s |
| 23940 | 2000/10/16 | 05:41:56+166 | C7.0 | 9182 | N04W107.4 | 3.3 | 30.1 | 3.0 | 39.0 | 7.1 | 9.6 | … | m |
| 23950 | 2000/10/16 | 06:59:48+1018.5 | M2.5 | 9182 | N03W108.3 | 3.3 | 31.5 | 4.0 | 44.6 | 10.8 | … | … | s |
| 24480 | 2000/12/08 | 16:18:57+90.5 | C4.3 | 9246 | S09W90.6 | 1.3 | 1.1 | 2.1 | 3.8 | 7.0 | … | … | m,o |
| 24580 | 2000/12/18 | 20:12:57+27 | C2.7 | 9280 | N08E92.5 | 0.5 | 4.4 | 2.0 | 4.2 | 9.3 | … | … | o,s |
| 24840 | 2001/01/03 | 18:05:31+44.5 | C2.7 | 9302 | N20E97.2 | 1.2 | 12.8 | 9.0 | 22.0 | … | … | … | c,s |
| 25540 | 2001/04/01 | 11:42:36+36 | M5.5 | 9415 | S21E107.0 | 0.7 | 30.3 | 23.6 | 77.9 | 9.2 | 6.7 | … | e,h,s |
| 25870 | 2001/04/05 | 02:06:55+75 | M3.1 | 9393 | N15W99.2 | 1.6 | 16.3 | 3.2 | 15.2 | 6.1 | 6.8 | … | s |
| 25880 | 2001/04/05 | 05:12:45+119 | M1.1 | 9393 | N15W100.8 | 1.6 | 19.3 | 4.6 | 21.3 | 8.1 | … | … | m |
| 25890 | 2001/04/05 | 08:33:08+8 | M8.4 | 9393 | N14W102.9 | 1.7 | 23.1 | 6.3 | 30.1 | 8.3 | 6.6 | … | e,s |
| 26060 | 2001/04/18 | 02:14:29+36.5 | C2.2 | 9415 | S21W116.9 | 1.8 | 47.9 | 9.0 | 108.4 | 3.4 | 3.7 | 3.7 | g,s |
| 26480 | 2001/05/20 | 06:02:17+6.5 | M6.4 | 9455 | S17W94.4 | 2.6 | 8.1 | 0.7 | 3.4 | 4.0 | 3.4 | 3.6 | o,s |
| 26490 | 2001/05/20 | 09:19:43+51.5 | M1.5 | 9455 | S20W96.2 | 2.6 | 11.3 | 1.0 | 6.1 | 8.5 | 5.8 | … | m |
| 27080 | 2001/08/09 | 00:39:15+120 | C6.0 | 9557 | S19W91.7 | 3.3 | 3.1 | 5.4 | 9.9 | 6.6 | 7.9 | … | s |
| 27400 | 2001/08/29 | 09:12:02+59.5 | C6.5 | 9587 | S12W97.4 | 3.5 | 12.7 | 1.0 | 7.8 | 6.7 | 8.3 | … | s |
| 27500 | 2001/09/03 | 01:54:38+133 | C9.0 | 9607 | S15E93.1 | 3.3 | 5.6 | 3.4 | 7.1 | 10.1 | … | … | s |
| 27540 | 2001/09/03 | 18:23:03+193.5 | M2.5 | 9608 | S22E96.2 | 1.0 | 12.2 | 1.4 | 6.9 | 8.1 | 6.9 | … | m |
| 27890 | 2001/09/11 | 07:00:00+69 | M1.2 | 9616 | S10E92.3 | 4.4 | 4.1 | 6.8 | 12.7 | 8.0 | … | … | s |
| 28260 | 2001/09/19 | 06:54:11+56.5 | C7.2 | 9608 | S23W93.9 | 2.2 | 7.6 | 10.2 | 19.9 | 5.6 | 7.2 | … | s |
| 29110 | 2001/10/29 | 01:56:00+41.5 | M1.3 | 9669 | N12W103.9 | 3.0 | 25.5 | 2.5 | 26.0 | 5.3 | 5.0 | … | m |
| 30430 | 2001/12/01 | 15:12:21+847 | M4.8 | 9727 | S25E97.8 | 2.4 | 14.3 | 13.6 | 31.6 | 9.0 | … | … | e,m |
| 30470 | 2001/12/02 | 21:29:50+251.5 | M2.0 | 9714 | S11W108.1 | 2.9 | 32.5 | 8.6 | 53.0 | 9.7 | … | … | m |
-
a
Descriptions: (1) - catalogue event number; (2) - date (YYYY/MM/DD); (3) - time integration (start time [UT] + duration in seconds); (4) - GOES X-ray class; (5) - NOAA active region number; (6) - location in solar coordinates; (7) - uncertainty of longitude estimation; (8) - estimated number of hours before/after the limb passage; (9) - altitude of HXR centroid above the solar limb in SXT pixels [2.45 arcsec]; (10) - estimated total height in 103 km; (11) - , the power-law index from hardness ratio M1/L; (12) - , the power-law index from hardness ratio M2/M1; (13) - , the power-law index from hardness ratio H/M2; (14) - remarks: c - corrupted HXT file (no HXT diagnostics), e - maximum of flare outside the time integration, g - gamma rays, h - progressive spectral hardening, l - only channel L (no HXT diagnostics), m - multiple bursts, o - event situated too close to the solar limb, possible emission overshooting from footpoints, s - single burst.