Constraining the Spin-down of the Nearby Isolated Neutron Star RX J2143.0+065411affiliation: Hubble Fellow; KITP, Kohn Hall, University of California, Santa Barbara, CA 93106; dkaplan@kitp.ucsb.edu
Abstract
Magnetic field estimates for nearby isolated neutron stars (INS) help to constrain both the characteristics of the population and the nature of their peculiar X-ray spectra. From a series of XMM-Newton observations of RX J2143.0+0654, we measure a spin-down rate of . While this does not allow a definitive measurement of the dipole magnetic field strength, fields of G such as those inferred from the presence of a spectral absorption feature at 0.75 keV are excluded. Instead, the field is most likely around G, very similar to those of other INS. We not only suggest that this similarity most likely reflects the influence of magnetic field decay on this population, but also discuss a more speculative possibility that it results from peculiar conditions on the neutron-star surface. We find no evidence for spectral variability above the % level. We confirm the presence of the 0.75-keV feature found earlier, and find tentative evidence for an additional absorption feature at 0.4 keV.
Subject headings:
stars: individual (RX J2143.0+0654) — stars: neutron — X-rays: stars1. Introduction
The so-called isolated neutron stars (INS; see Haberl 2007 and Kaplan 2008 for reviews) are a group of seven nearby (kpc) neutron stars with low () X-ray luminosities and long (3–10 s) spin periods. When first discovered, a range of possible reasons for their long periods was suggested, with a corresponding range in magnetic field strengths of –G : accretors (Konenkov & Popov, 1997; Wang, 1997), long-period pulsars (Kulkarni & van Kerkwijk, 1998; Kaplan et al., 2002; Zane et al., 2002), and middle-aged magnetars (Heyl & Kulkarni, 1998). Field measurements can allow one to distinguish between these possibilities, and thus help understand the INS and their place in the greater neutron-star population. The magnetic field is also a necessary component of any realistic thermal emission models (Zane et al., 2004; Motch et al., 2003; Ho et al., 2007), required to interpret the surface emission and deduce radii and other properties of the INS.
Dipolar magnetic field strengths can be estimated from coherent timing solutions, and we used X-ray observations to derive such solutions for three INS,111Our provisional solution for RX J1856.53754 (vKK08) was confirmed by two additional observations taken in 2008 March and October. finding magnetic fields of G (Kaplan & van Kerkwijk 2005a, b, hereafter KvK05a,b; van Kerkwijk & Kaplan 2008, hereafter vKK08; also see van Kerkwijk et al. 2007). This breakthrough is complemented by the discovery of broad absorption features at energies of 0.2–0.75 keV in the thermal (with bolometric luminosities of times the spin-down luminosity, the emission is certainly thermal) spectra of six of the seven INS. Assuming a pure hydrogen atmosphere, fields of –G, and temperatures around K, the absorption could be due to either proton cyclotron or transitions between bound states of neutral hydrogen. Intriguingly, for the two objects with both spectroscopic and spin-down magnetic fields, the agreement appeared to be good (van Kerkwijk & Kaplan, 2007).
Here, we constrain the spin-down rate and hence magnetic field strength of the INS RX J2143.0+0654 (catalog RX J2143.0+0654) (also 1RXS J214303.7+065419 or RBS 1774; hereafter RX J2143) with a series of dedicated XMM-Newton observations. RX J2143 was identified as a possible neutron star by Zampieri et al. (2001) on the basis of a soft thermal spectrum and the absence of an optical counterpart. Using XMM, Zane et al. (2005, hereafter Z+05) confirmed that the spectrum was soft and blackbody-like. They also found a broad absorption feature around 0.75 keV and identified a candidate s periodicity. For hydrogen atmospheres, the high energy of the absorption (considerably higher than those of the other INS; see Haberl 2007 and van Kerkwijk & Kaplan 2007) should translate to a high magnetic field of G, which makes this object a particularly good test for models of the origin of the X-ray absorption and for understanding the INS population.
2. Observations and Analysis
We observed RX J2143 11 times with XMM (Jansen et al., 2001) in 2007 and 2008, and focus here on the data taken with the European Photon Imaging Camera (EPIC) with pn and MOS detectors, all used in small window mode with thin filters (Table 1). All our observations, as well as the one from Z+05 (taken with the same settings), were processed with SAS version 8.0. We used epchain and emchain and selected source events from a circular region of radius with energies below 2 keV (where flares are negligible; the source is not detected above 2 keV). As recommended, we included only one- and two-pixel (single and double patterns 0–4) events with no warning flags for pn, and single, double, and triple events (patterns 0–12) with the default flag mask for MOS1/2. We barycentered the event times using the Chandra X-ray Observatory position from Rea et al. (2007): and (J2000).
| Exp.aaThe exposure time and number of counts given here are for EPIC-pn only. | TOAbbThe TOA is defined as the time of maximum light of the pulsation closest to the middle of each observation computed from the combined EPIC-pn and EPIC-MOS1/2 datasets, and is given with 1- uncertainties. | |||
|---|---|---|---|---|
| Rev. | Date | (ks) | CountsaaThe exposure time and number of counts given here are for EPIC-pn only. | (MJD) |
| 820 (catalog ADS/XMM#0201150101) | 2004 May 31 | 30.0 | 50,032 | 53,156.821900(2) |
| 1360 (catalog ADS/XMM#0502040601) | 2007 May 13 | 12.9 | 22,915 | 54,233.762142(4) |
| 1362 (catalog ADS/XMM#0502040701) | 2007 May 17 | 13.0 | 22,926 | 54,237.950712(4) |
| 1368 (catalog ADS/XMM#0502040801) | 2007 May 30 | 7.0 | 12,369 | 54,250.632660(4) |
| 1375 (catalog ADS/XMM#0502040901) | 2007 Jun 12 | 8.3 | 14,497 | 54,263.916974(5) |
| 1447 (catalog ADS/XMM#0502041001) | 2007 Nov 03 | 8.5 | 15,049 | 54,407.453138(4) |
| 1449 (catalog ADS/XMM#0502041101) | 2007 Nov 07 | 11.1 | 19,480 | 54,411.246902(4) |
| 1449 (catalog ADS/XMM#0502041201) | 2007 Nov 08 | 9.5 | 16,687 | 54,412.213081(3) |
| 1457 (catalog ADS/XMM#0502041301) | 2007 Nov 23 | 5.3 | 9,229 | 54,427.463785(6) |
| 1465 (catalog ADS/XMM#0502041401) | 2007 Dec 10 | 7.7 | 13,517 | 54,444.074930(4) |
| 1538 (catalog ADS/XMM#0502041501) | 2008 May 03 | 11.5 | 20,812 | 54,589.198404(4) |
| 1546 (catalog ADS/XMM#0502041801) | 2008 May 19 | 7.7 | 13,414 | 54,605.222248(5) |
Note. — All observations used EPIC-pn in the small window mode and with the thin filter for both EPIC-pn and EPIC-MOS1/2.
2.1. Timing Analysis
We first determined the energy range that maximized the power in a periodogram for the combined EPIC data from 2004 (the longest single observation). We found that events below 130 eV ( of all events) were only marginally pulsed, and that removing those gave maximum power (; all events gives 56.9). With these, we found a best-fit frequency of Hz (our final timing solution does not change significantly when we include the low-energy events).
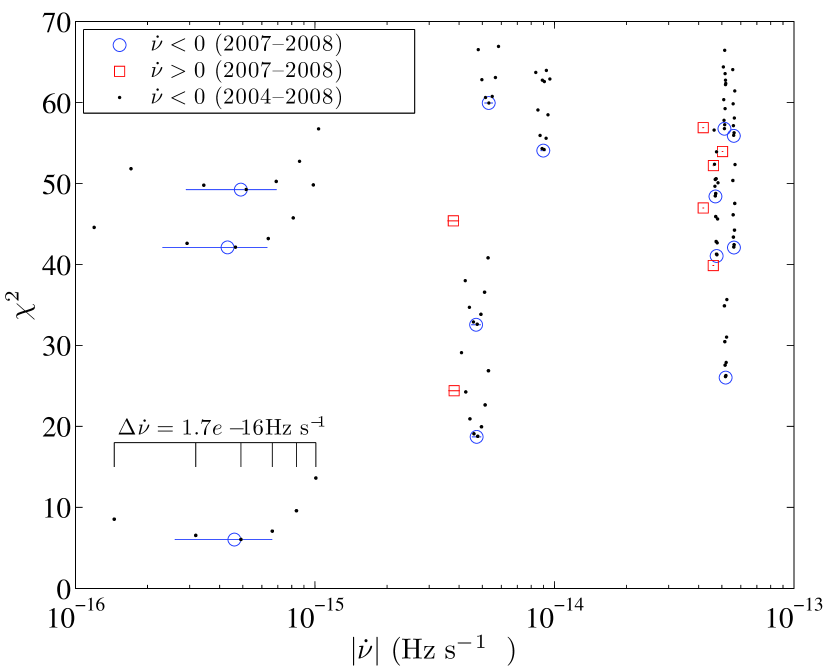
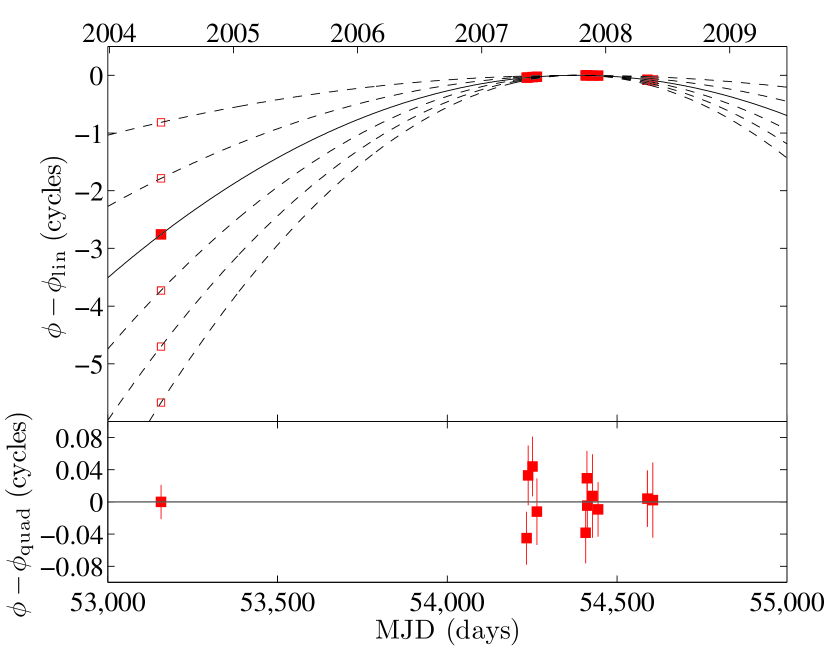
Using the above frequency, we determined the times of arrival (TOAs; see Table 1) for the combined EPIC data from each observation by fitting sine functions to the binned lightcurves (following KvK05a). The spacing and precision of the TOAs is insufficient for an unambiguous timing solution (unlike in KvK05a,b but as in vKK08). Instead we searched for possible coherent timing solutions by iteratively trying sets of cycle counts between the different TOAs from 2007 and 2008 (similar to vKK08, although we did not incorporate frequency information here because it does not add extra information). We find one solution (Fig. 1) that is considerably better than the alternatives (Fig. 2) with for 8 degrees of freedom (dof) and a small, marginally significant spin-down rate of for a dipole magnetic field of G (see Table 2). The next best solution has and a much larger spin-down rate: , resulting from a difference of 1 cycle for the gap between Revs. 1465 and 1538. For a fit with 3 free parameters, a change in of 12.7 means that the best-fit solution is favored at 99.5% confidence. Even less likely solutions are found for combinations of other cycle counts (Fig. 2).
We confirmed this solution in two ways. First, we verified that an analysis using the TOAs from the individual instruments gave the same result. Second, we did a coherent periodogram as a function of both and . The best four solutions identified were the same as those found in the TOA analysis. The best-fit peak has , consistent with the pulsed fraction of %. Spin-down is only marginally detected at about 93% confidence, consistent with the TOA analysis.
Unfortunately, we cannot unambiguously extend the solution back to the 2004 observation: given its offset days from the reference time of the above solution, the uncertainty on the cycle count is approximately cycles. As a result, about six solutions are within of the best-fit solution, with implied spin-down values differing by (Figs. 1 and 2).
2.2. Spectral Analysis
We examined the EPIC-pn spectra of RX J2143 from our new data to verify whether the basic fits of Z+05 are still valid with our times longer total exposure time, and to look for possible long-term variability such as what de Vries et al. (2004) found for RX J0720.43125. (A full spectral analysis, including the EPIC-MOS and RGS data and phase-resolved fits, is in progress.) For our spectra, we used the same extraction regions as for the timing analysis, and an offset circular region with the same radius for the background (which is low). We created response files, and binned the spectral files such that the bin width was at least 25 eV (about one third of the spectral resolution) and the number of counts was at least 25.
We first fit our 11 new observations with an absorbed blackbody model over the 0.2–1.5 keV range (we use sherpa and the xstbabs absorption model of Wilms et al. 2000). The best-fit model had column density , effective temperature eV, and blackbody radius km, where the blackbody parameters are those measured by an observer at infinity. The results are similar to those of Z+05 for the 2004 data, with the slight offset likely resulting from changes in the EPIC calibration and from the inclusion of the MOS data (for the reprocessed 2004 EPIC-pn data, we find values much closer to those given above). The fit is reasonable, with for 431 dof. The residuals, however, appear to show some systematic deviations, with dips near 0.75 keV and 0.4 keV. Overall, the absorbed and unabsorbed fluxes in the 0.2–2.0 keV band are and .
The reduced for the individual observations ranged from 0.9 to 1.5, with dof each, suggesting the spectra are consistent with each other. Indeed, fitting for both the blackbody temperature and normalization of each observation (including that from 2004), but keeping fixed, does not decrease significantly: for 22 fewer dof. The changes in temperature found are between % to %, comparable to the typical 2% uncertainties for the individual observations. The changes are anti-correlated with those in normalization, with , i.e., conserving flux. Thus, we see no evidence for variability, and can confidently exclude the types of changes observed for RX J0720.43125 (de Vries et al., 2004; Vink et al., 2004).
| Quantity | Value |
|---|---|
| Dates (MJD) | 54,234–54,605 |
| (MJD) | 54,383.648930(2) |
| (Hz) | 0.1060644595(11) |
| () | |
| TOA rms (s) | 0.3 |
| /dof | 6.0/8 |
| (s) | 9.42822888(9) |
| () | 4.1(18) |
| (Myr) | 3.7 |
| (G) | 2.0 |
| () | 1.9 |
Note. — Quantities in parentheses are the formal 1- uncertainties on the last digit. is the characteristic age, assuming an initial spin period and a constant magnetic field; is the magnetic field inferred assuming spin-down by dipole radiation; is the spin-down luminosity.
Returning to fits to the 2007–2008 data with a single model, we examined whether the broad absorption feature at 0.75 keV was present in our new observations. We modeled the absorption by a multiplicative Gaussian. First, constraining the absorption to be centered at 0.75 keV with a full width at half maximum of 0.06 keV, as used in Z+05, we find a best-fit fractional depth of %, with the remaining parameters similar to the blackbody fit and for 430 dof. Starting with the same values, but now fitting for the central energy and width, we find essentially identical results: a best-fit energy of 0.756 keV and width of 0.073 keV, and for 428 dof. A reduction of 61 in is highly significant: an F test222Using an F test for finding lines is incorrect when the line model is located at the boundary of parameter space (Protassov et al., 2002). This, however, is not the case here since can have either sign. gives a probability of random occurrence of . To verify this, we simulated 1000 sets of 11 observations like ours using the best-fit blackbody parameters, and fitted those to blackbody models with and without absorption. We found that the distribution of was centered at zero with a root-mean-square spread of 3%, similar to the uncertainty on in our fit to the actual data. The distribution of also conforms to expectations, with the including absorption never differing from the blackbody by more than 8.5 (compared to 61 for the real data). Thus, we confirm the detection of absorption at 0.75 keV by Z+05. Using the same continuum model but letting the absorption depth vary for each observation, we again find no statistically significant variability ( for 11 fewer dof).
If we vary the energy of the absorption line over the range 0.3–1.0 keV (avoiding the edges of the spectrum, where the continuum fit and the absorption are highly covariant), we find that, with one exception, only for keV is there significant absorption. Otherwise, and is around 0. The one exception is a hint of absorption at 0.42 keV, which gives and %. This detection is significant at the level given the 15 trials that we did (none of our 1000 simulations achieved such a high ). Such a line also improves the fit for the 2004 data, although not by a statistically significant amount (). Confirmation of this with the EPIC-MOS and RGS data is ongoing.
3. Discussion and Conclusions
A large magnetic field of G is inferred333This interpretation ignores the suppression of absorption lines due to vacuum resonance mode conversion in such strong magnetic fields; see Ho & Lai (2004). for RX J2143 if one interprets the 0.75 keV absorption in its spectrum as arising from either proton cyclotron absorption (G for a gravitational redshift ) or ionization of hydrogen (even higher, as in Z+05; also see van Kerkwijk & Kaplan 2007). This scenario appeared to work well for RX J0720.43125 and RX J1308.6+2127, where those transitions could match the observed absorption features for magnetic fields of a few times G, comparable to what was inferred from timing (van Kerkwijk & Kaplan 2007; Haberl 2007, and references therein). It also seemed consistent with the lack of features in RX J1856.53754, since that source has the weakest field (vKK08).
For RX J2143, though, the model breaks down: the required strong magnetic field is inconsistent with our timing measurements (G) at the level (given for 3 parameters). In principle, the possible absorption feature at 0.4 keV may be easier to accommodate, although it still occurs at higher energy than the features seen in RX J0720.43125 and RX J1308.6+2127 while the magnetic field that we measure here is nominally weaker than the fields of those sources (Fig. 3). Furthermore, this leaves the 0.75 keV feature unexplained. It being a “harmonic” of the 0.4 keV line seems unlikely, as it is almost twice as strong, while one would expect harmonics to be significantly weaker (Pavlov & Panov 1976; G. G. Pavlov 2007, private communication). A better match may be possible with an atmosphere with helium or even heavier elements (Pavlov & Bezchastnov 2005; Hailey & Mori 2002; Z+05; Mori & Ho 2007); of course, in this case hydrogen must be absent, given the rapid gravitational settling time (Alcock & Illarionov, 1980) and the small amount of hydrogen required to be optically thick (Romani, 1987).
Geometry may offer a partial solution. The magnetic field that we infer from the spin-down rate is actually the true dipolar field strength times a function of the angle between the magnetic and rotation axes. That function is in the traditional vacuum dipole model (Pacini, 1967), which would give a large range of possible true field strengths. More modern analyses, however, give something more like (Spitkovsky, 2008), and thus a range of only 40%. Therefore, it seems unlikely that this can remedy the situation. Modeling of the pulse profile and phase-resolved spectroscopy has the potential to constrain the geometry (e.g., Zane & Turolla, 2006), although X-ray polarimetry may be required for unambiguous results.
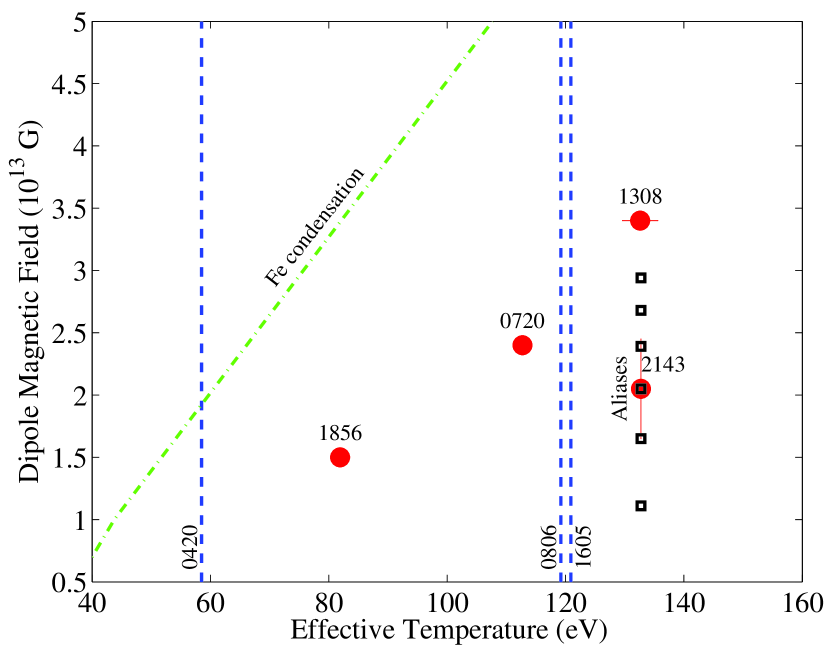
Turning to the properties of the INS as a whole, our result shows that not only do the INS cluster at long periods, but they are close in both axes of the plane. The inferred magnetic fields for RX J1856.53754, RX J0720.43125, RX J1308.6+2127, and now RX J2143 are all within a factor of 2 of each other. Intriguingly, we also find a possible correlation between the effective temperature and magnetic field (Fig. 3; a similar realization was made by Pons et al. 2007 for a larger but less uniform sample, but see also Turolla et al. 2004 where the use of magnetic fields inferred from spectroscopy led to different conclusions). Whether or not RX J2143 fits this trend, however, will require an unambiguous timing solution.
A possible explanation for the clustering of the magnetic field strengths, and perhaps also the correlation with temperature, is that the fields were originally significantly stronger (– G), and decayed. Such a scenario was originally proposed as a way to keep the INS hotter for much longer and thus make the natal population smaller (Heyl & Kulkarni 1998; also see Colpi et al. 2000). It is unlikely that field decay contributes much to the current thermal state, as the cooling and kinematic ages (from tracing the INS back to birth locations) agree well and the products of those ages and X-ray luminosities are about 100 times the energy currently in the dipole magnetic field, but decay may still have influenced the current field strengths. In particular, relatively fast field decay naturally leads to the tightly grouped periods and magnetic fields of the INS (Pons & Geppert, 2007). It also naturally resolves why the spin-down ages (which assume constant magnetic field) are significantly longer than the kinematic ages: Myr versus Myr (Kaplan et al. 2007; van Kerkwijk & Kaplan 2007; vKK08). Finally, field decay might also lead to a correlation between field and temperature, since both would be a function of age (note, however, that based on kinematic ages, RX J1856.53754 appears younger than RX J0720.43125 even though the former is colder; Kaplan et al. 2007). If field decay occurred, the INS would be the descendants of something like the magnetars, having had stronger fields ( G, especially in the interiors) in the past, but with merely above average fields now. It could point to an evolutionary difference between the INS and the high-magnetic-field radio pulsars (e.g., Camilo et al., 2000) that inhabit the same region of the - diagram.
The correlation between temperature and field strength might also be evidence for something rather different, viz., surface physics. For a given magnetic field, as the surface cools, it is expected to condense (Ruderman, 1974; Lai, 2001). For iron, the condensation line is quite similar to the correlation we observe (Turolla et al., 2004; Medin & Lai, 2007). From Fig. 3, one sees there is about a factor 2 difference in magnetic field, but this may just reflect the difference between the dipole and crustal fields, or between the true temperature and that inferred from a blackbody fit (indeed, differences in the right sense are expected from atmosphere models; see Zavlin & Pavlov 2002). If condensation indeed plays a role, it would help determine the surface composition (lighter elements do not condense as easily), perhaps help understand the peculiar spectra of the INS, and, since a condensed surface may inhibit the formation of a vacuum gap (Medin & Lai, 2007), help explain the lack of radio emission from the INS (e.g., Kondratiev et al., 2008). It is less clear, however, what would keep the INS on the condensation line, or make them evolve along it.
The above possibilities may well help understand what separates the INS from “normal” rotation-powered middle-aged pulsars, which have a much wider range of magnetic field strengths in a comparable sample (e.g., Kaplan, 2008). Understanding how the fields of these sources evolve and how this couples to the surface temperature is also required to derive meaningful constraints from cooling measurements (Page et al., 2004). To see whether the fields are indeed clustered and/or correlated with temperature, will require measurements of other sources, and refinement of that of RX J2143.
References
- Alcock & Illarionov (1980) Alcock, C. & Illarionov, A. 1980, ApJ, 235, 534
- Burwitz et al. (2003) Burwitz, V., Haberl, F., Neuhäuser, R., Predehl, P., Trümper, J., & Zavlin, V. E. 2003, A&A, 399, 1109
- Camilo et al. (2000) Camilo, F. et al. 2000, ApJ, 541, 367
- Colpi et al. (2000) Colpi, M., Geppert, U., & Page, D. 2000, ApJ, 529, L29
- de Vries et al. (2004) de Vries, C. P., Vink, J., Méndez, M., & Verbunt, F. 2004, A&A, 415, L31
- Haberl (2007) Haberl, F. 2007, Ap&SS, 308, 181
- Haberl et al. (2004) Haberl, F. et al. 2004, A&A, 424, 635
- Hailey & Mori (2002) Hailey, C. J. & Mori, K. 2002, ApJ, 578, L133
- Heyl & Kulkarni (1998) Heyl, J. S. & Kulkarni, S. R. 1998, ApJ, 506, L61
- Ho et al. (2007) Ho, W. C. G., Kaplan, D. L., Chang, P., van Adelsberg, M., & Potekhin, A. Y. 2007, MNRAS, 375, 821
- Ho & Lai (2004) Ho, W. C. G. & Lai, D. 2004, ApJ, 607, 420
- Jansen et al. (2001) Jansen, F. et al. 2001, A&A, 365, L1
- Kaplan (2008) Kaplan, D. L. 2008, in American Institute of Physics Conference Series, Vol. 983, 40 Years of Pulsars: Millisecond Pulsars, Magnetars and More, ed. C. Bassa, Z. Wang, A. Cumming, & V. M. Kaspi (New York: AIP), 331
- Kaplan et al. (2002) Kaplan, D. L., Kulkarni, S. R., van Kerkwijk, M. H., & Marshall, H. L. 2002, ApJ, 570, L79
- Kaplan & van Kerkwijk (2005a) Kaplan, D. L. & van Kerkwijk, M. H. 2005a, ApJ, 628, L45
- Kaplan & van Kerkwijk (2005b) —. 2005b, ApJ, 635, L65
- Kaplan et al. (2007) Kaplan, D. L., van Kerkwijk, M. H., & Anderson, J. 2007, ApJ, 660, 1428
- Kondratiev et al. (2008) Kondratiev, V. I., Burgay, M., Possenti, A., McLaughlin, M. A., Lorimer, D. R., Turolla, R., Popov, S., & Zane, S. 2008, in AIP Conference Series, Vol. 983, 40 Years of Pulsars, ed. C. Bassa, Z. Wang, A. Cumming, & V. M. Kaspi (New York: AIP), 348
- Konenkov & Popov (1997) Konenkov, D. Y. & Popov, S. B. 1997, Astron. Lett., 23, 498
- Kulkarni & van Kerkwijk (1998) Kulkarni, S. R. & van Kerkwijk, M. H. 1998, ApJ, 507, L49
- Lai (2001) Lai, D. 2001, Rev. Mod. Phys., 73, 629
- Medin & Lai (2007) Medin, Z. & Lai, D. 2007, MNRAS, 382, 1833
- Mori & Ho (2007) Mori, K. & Ho, W. C. G. 2007, MNRAS, 377, 905
- Motch et al. (2003) Motch, C., Zavlin, V. E., & Haberl, F. 2003, A&A, 408, 323
- Pacini (1967) Pacini, F. 1967, Nature, 216, 567
- Page et al. (2004) Page, D., Lattimer, J. M., Prakash, M., & Steiner, A. W. 2004, ApJS, 155, 623
- Pavlov & Bezchastnov (2005) Pavlov, G. G. & Bezchastnov, V. G. 2005, ApJ, 635, L61
- Pavlov & Panov (1976) Pavlov, G. G. & Panov, A. N. 1976, Sov. Phys. JETP, 44, 300
- Pons & Geppert (2007) Pons, J. A. & Geppert, U. 2007, A&A, 470, 303
- Pons et al. (2007) Pons, J. A., Link, B., Miralles, J. A., & Geppert, U. 2007, Phys. Rev. Lett., 98, 071101
- Protassov et al. (2002) Protassov, R., van Dyk, D. A., Connors, A., Kashyap, V. L., & Siemiginowska, A. 2002, ApJ, 571, 545
- Rea et al. (2007) Rea, N. et al. 2007, MNRAS, 379, 1484
- Romani (1987) Romani, R. W. 1987, ApJ, 313, 718
- Ruderman (1974) Ruderman, M. 1974, in IAU Symposium, Vol. 53, Physics of Dense Matter, ed. C. J. Hansen (Dordrecht: Kluwer), 117
- Schwope et al. (2005) Schwope, A. D., Hambaryan, V., Haberl, F., & Motch, C. 2005, A&A, 441, 597
- Spitkovsky (2008) Spitkovsky, A. 2008, in American Institute of Physics Conference Series, Vol. 983, 40 Years of Pulsars: Millisecond Pulsars, Magnetars and More, ed. C. Bassa, Z. Wang, A. Cumming, & V. M. Kaspi (New York: AIP), 20
- Turolla et al. (2004) Turolla, R., Zane, S., & Drake, J. J. 2004, ApJ, 603, 265
- van Kerkwijk & Kaplan (2007) van Kerkwijk, M. H. & Kaplan, D. L. 2007, Ap&SS, 308, 191
- van Kerkwijk & Kaplan (2008) —. 2008, ApJ, 673, L163
- van Kerkwijk et al. (2004) van Kerkwijk, M. H., Kaplan, D. L., Durant, M., Kulkarni, S. R., & Paerels, F. 2004, ApJ, 608, 432
- van Kerkwijk et al. (2007) van Kerkwijk, M. H., Kaplan, D. L., Pavlov, G. G., & Mori, K. 2007, ApJ, 659, L149
- Vink et al. (2004) Vink, J., de Vries, C. P., Méndez, M., & Verbunt, F. 2004, ApJ, 609, L75
- Wang (1997) Wang, J. C. L. 1997, ApJ, 486, L119
- Wilms et al. (2000) Wilms, J., Allen, A., & McCray, R. 2000, ApJ, 542, 914
- Zampieri et al. (2001) Zampieri, L. et al. 2001, A&A, 378, L5
- Zane & Turolla (2006) Zane, S. & Turolla, R. 2006, MNRAS, 366, 727
- Zane et al. (2004) Zane, S., Turolla, R., & Drake, J. J. 2004, Adv. Space Res., 33, 531
- Zane et al. (2002) Zane, S. et al. 2002, MNRAS, 334, 345
- Zane et al. (2005) —. 2005, ApJ, 627, 397
- Zavlin & Pavlov (2002) Zavlin, V. E. & Pavlov, G. G. 2002, in Neutron Stars, Pulsars, and Supernova Remnants, ed. W. Becker, H. Lesch, & J. Trümper, 263