Engineering solid-like structures via an arrested spinodal decomposition
Abstract
The possibilities to tune the structure of solid like material resulting from arrested spinodal decomposition is investigated using a system composed of lysozyme, a globular protein, dispersed in a water solution as model system for colloids with short range attraction. It is shown that the resulting arrested spinodal decomposition is driven by the interplay between the early kinetics of the spinodal decomposition and the dynamical arrest. The initial concentration, the quench depth and speed from the fluid state to the arrested state enable to tailor the mesh size of the solid network of the arrested spinodal decomposition.
pacs:
pacsI Introduction
Dynamical arrest reveals itself to be a powerful mechanism to prepare solid-like material and is widely used in food science, care product industry and material science Mezzenga et al. (2005). Recently, efforts have been made to understand the influence of interactions on dynamical arrest Trappe and Sandkuhlerb (2005); Zaccarelli (2007). In particular in short range attractive colloid-like system it is possible to form solid-like network through an interplay between dynamical arrest and phase separation Cardinaux et al. (2007); Lu et al. (2008); Manley et al. (2005); Buzzaccaro et al. (2007). In such systems, the spinodal decomposition process leads to a bi-continuous structure which gets ’pinned’ into a rigid self-supporting network because the particle-rich regions have undergone dynamical arrest before reaching the equilibrium conditions set by the coexistence curve. Experimentally this pinning of the phase separation due to dynamical arrest manifests itself as a crossover from a time dependent to a time independent behavior of the structure factor. Our ability to tune the properties of this arrested network depend very much on our understanding of its formation precisely because the resulting structure is out of equilibrium. We thus focus on the kinetic and path dependency (initial conditions such as the concentration in colloids and quench rate and depth from the fluid state to the arrested spinodal decompositon) on the final structure of the arrested spinodal decomposition.
In a first part we characterize the system, lysozyme,a globular protein, dispersed in water and develop the analogy with colloids. In a coarse grain approach, scattering data from the fluid phase, above the phase separation allows to extract interaction parameters of lysozyme in water such as the range and depth of the short range attraction. In a second part we show that for shallow quenches into the phase separation region, the system exhibits the classical features of spinodal decomposition whereas deeper quenches below the spinodal line lead to the formation of arrested spinodal decomposition where the resulting structure can be tailored mainly by controlling the rate and the depth of the quench. Finally we investigate the structure formed in the course of the arrested spinodal. We obtain quantitative and consistent information about the structure of the arrested spinodal with a combination of scattering and optical microscopy over a very large range of length scales. In particular, at low scattering vector moduli, , (i.e. large length scales) we combine microscopy and ultra small-angle light scattering (USALS) to get a straightforward analysis of the correlation length and mesh size of the arrested network. Similarly, at high (shorter length scales) we use small-angle neutron and x-ray scattering (SANS and SAXS, respectively) combined with a simple assumption of locally liquid-like structure in order to obtain rather detailed structural information that is fully consistent with the position of the arrest line determined in Cardinaux et al. (2007). However, the situation at intermediate is much more difficult if we like to get information beyond the fact that an extended Porod region Porod (1982) with behaviour indicates the formation of well separated regions of different concentrations with a well-defined interface typical of phase separation. Here we have introduced reverse Monte Carlo approach coupled to the coarse graining procedure to limit computational effort in order to obtain additional information and describe the problems that go hand in hand with the very large range of length scales.
II Materials and Methods
The study of the structures formed during the spinodal decomposition process requires the use of a broad variety of experimental techniques to bridge the gap between the building blocks, the lysozyme molecule, which sets the lower limit of the required accessible length scale to the nanometer, and the resulting final structure, a network with mesh sizes of a few microns which determines the upper limit Pusey (1991); Frenkel (2002); Anderson and Lekkerkerker (2002). The large scale structures are probed by phase contrast microscopy or by ultra small angle light scattering. The lower scale organization is monitored using small angle neutron scattering, small angle x-ray scattering and static light scattering (SLS).
II.1 Sample preparation
We use hen egg white lysozyme (Fluka, L7651) dispersed in an aqueous buffer (20 mM Hepes) containing M sodium chloride. Lysozyme is a monodisperse globular protein of a molecular mass of kDa carrying a net charge of electronic charges at pH, Tanford and Roxby (1972). Initially a suspension at is prepared in pure buffer without added salt, and its pH is adjusted to with sodium hydroxide Stradner et al. (2006); Cardinaux et al. (2007). Under these conditions the suspension is stable and is further used as stock. We then dilute it with a NaCl-containing buffer at pH to a final NaCl concentration of M. Particular care is taken to avoid partial phase separation upon mixing by pre-heating both buffer and stock solution well above the coexistence curve for liquid-liquid phase separation (cf. Fig. 1). This procedure results in completely transparent samples at room temperature with volume fractions ranging from to , where was obtained from the protein concentrations measured by UV absorption spectroscopy using , where = 1.351 is the protein partial specific density, Millero et al. (1976). To prepare samples at even higher volume fractions up to , we take advantage of the ability of the system to phase separate into a protein-rich and protein-poor phase. Typically, a sample at is quenched to a temperature CT 18∘C below its cloud point and centrifuged at g for minutes. Quasi-equilibrium is reached once the two phases are separated by a sharp meniscus and show only slight turbidity, Cardinaux et al. (2007). The supernatant is then removed and the bottom dense phase is used for further experiments.
II.2 Microscopy
The optical microscopy is performed with a Leica DM-IRB in phase contrast mode. The lysozyme solution is injected in a flat capillary tube (width 1 mm, depth 50 m) while it is in a state of a homogeneous fluid at 25∘C. The sample in the capillary is embedded in a thermostated holder on the microscope stage and imaged. Precautions were taken so that the experimental results were comparable, reproducible and artifact free. The illumination of the sample is kept constant to compare different images. To minimize the heat effects of the illumination, we illuminate the sample only during the time required to take pictures. Moreover we attenuate the heating effect of the UV and IR part of the illumination spectrum by placing a beaker of water between the light source and the sample. The microscope focus was set to image the mid-plane of the sample to avoid the influence from wetting effects at the interfaces between the lysozyme solution and the capillary. The objective aperture was opened to its maximum diameter to minimize the depth of the focal plan to a few microns.
II.3 Static light scattering
Light scattering experiments were performed with a commercial ALV/DLS/SLS-5000 monomode fibre compact goniometer system with an ALV-5000 fast correlator. We used NMR tubes as scattering cells (5 mm diameter). The data were corrected for background scattering (cell and solvent) and converted to absolute scattering intensity – the so called Rayleigh ratio – using toluene as reference standard. The Rayleigh ratio can be written as where is the contrast, the lysozyme concentration, the molar mass of lysozyme, the form factor and the structure factor. The refractive indices necessary for calculating the contrast term, which is given by with the index of refraction of the buffer, the refractive index increment, and the wavelength, , of the scattered light in vacuum, were determined for all solutions with an Abbe refractometer by interpolating the measurements of the index of refraction, done for three different wavelengths of 435.1 nm, 546.1 nm, 579.1 nm, to the ALV-5000 laser wavelength, 514.5 nm. The resulting refractive index increment, =0.194 mL/g, was found to be temperature and salt independent within an error of 2. Since lysozyme is much smaller than the wavelength of the ALV-5000 laser we are in the long wavelength limit. We are thus assuming that the scattered intensity is -independent , 1, that ) is obtained directly from the experiment.
The USALS setup is described elsewhere Bhat et al. (2006). It covers a range of 0.1 to 2 m-1. The sample is filled into square cells with a short optical path length of 10m to avoid multiple scattering and then transferred into a thermostated cell holder.
II.4 SANS and SAXS
SANS and SAXS are ideal tools for studying the structure of materials in the mesoscopic size range between 1 and 400 nm. SANS experiments were performed at the SANS I facility at the Swiss neutron source SINQ at the Paul Scherrer Institut, Switzerland, and at the instrument D11 at the Institut Laue Langevin in Grenoble, France. We used 1 mm Hellma quartz cells and a thermostatically regulated sample holder. Combinations of different wavelengths, sample-to-detector distances and collimation lengths were used to cover a range of 0.015 to 2 nm-1. In the SANS experiments, the contrast, , depends on the scattering length density of water -5.60x10⁷ , on the scattering length density of lysozyme x , the partial specific volume of lysozyme, mL/g Millero et al. (1976) and the Avogadro number, . It is equal to x m2.mol.g-2. SAXS experiments were carried out in Department of Chemistry at University of Aarhus, Denmark with a pinhole camera (NanoSTAR, Bruker AXS) employing a rotating anode (Cu Ka) x-ray source, a thermostatically regulated sample chamber and a two-dimensional gas detector Pedersen (2004). For the present experiments the sample to detector distance was 24 cm providing range of 0.2 to 8 nm-1.
II.5 Temperature quenches
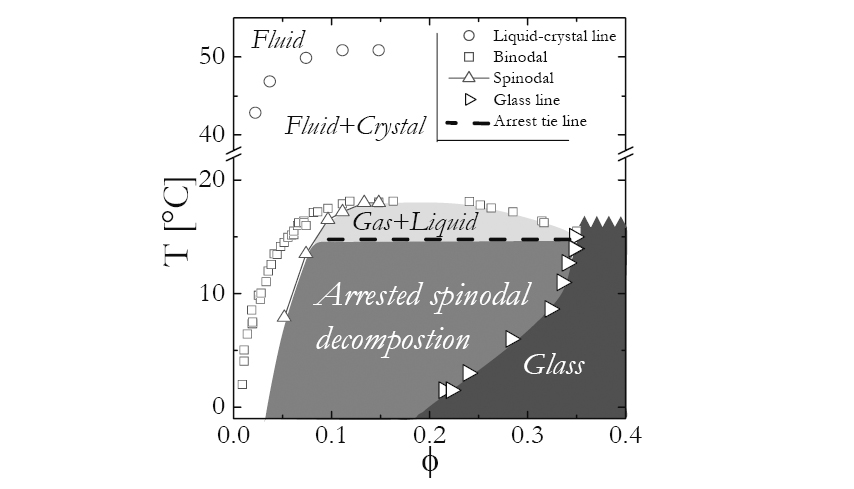
The phase diagram of the lysozyme solution we use (Fig. 1) exhibits the classical features of a colloidal system with short range attractions Vliegenthart et al. (1999). We observe a liquid-liquid coexistence curve that is metastable with respect to the solid-liquid phase boundary. The dynamical arrest line intercepts the coexistence curve leading in particular to arrested spinodal decomposition Cardinaux et al. (2007); Foffi et al. (2005). We investigated two types of temperature quenches differing by their cooling rate. For both types of quenches, the cuvette used in the experiment was filled with a fresh lysozyme dispersion around 25∘C. As shown in Figure 1, the sample is in an homogeneous fluid state provided we work fast enough so that crystals don’t have time to develop (crystal start forming after one to two hours after the sample preparation). The lysozyme solution is then quenched below the spinodal line to the desure final temperature, . In the ’fast’ quench the sample is pre-quenched for a minute in an ethanol bath at . It is then quickly transferred to the thermostated cuvette holder of the experiment, also at . This procedure allows to obtain the fastest experimental quenches possible with this cell size. We estimate the time for the sample to go from 25∘C to to be less than 30 s. ’Slow’ quenches result from a simple cooling down of the sample from 25∘C to as the sample is inserted in the pre-thermostated sample holder of the experiment. It then takes about 100 s to thermalize the sample to .
III Lysozyme as a model colloid with a short range attraction
We worked with lysozyme which is a globular protein interacting via a temperature dependent short-range attraction and a combination of a hard core and a soft long range repulsion due to surface charges (around +8 at pH=7.8). We prepared the lysozyme sample at high ionic strength, [NaCl]=500 mM/mL, where the hard core repulsion and the short range attraction are dominating due to the screening of the charges on the proteins. Under these conditions the phase diagram, Fig. 1, is in agreement with simulations and experiments done on colloids interacting via a hard core repulsion and a short range attraction: the gas-liquid curve is metastable with respect to the fluid-crystal boundary and the dynamical-arrest line intercepts the coexistence curve leading to an arrested spinodal decomposition Cardinaux et al. (2007); Foffi et al. (2005). To further exploit the colloid-lysozyme analogy we measure the structure factor of lysozyme in a wide range of concentrations and temperatures. A comparison of the measurements with the structure factors calculated for different model interactions such as a DLVO potential, a square well potential, etc… allows us to obtain additional insight into lysozyme interactions.
Since 500 mM of screens almost totally the Coulomb repulsion, we decided to work with a square well interparticle pair potential, to model short range attraction for lysozyme:
where is an effective hard sphere radius, and and are the depth and the range of the square well, respectively. The square well potentials have unphysical shapes but they have been widely used to study colloids with short range attractions since the physics depends only weakly on the shape of the potential, Noro and Frenkel (2000).
In order to determine the rest of the parameters of the potential, and , we subsequently fit a temperature and a concentration series in the fluid state above the coexistence curve, Fig. 2. The series contains obtained from light scattering and obtained from SANS and SAXS. The effective structure factor is determined as the ratio between two measurements normalized with the particle concentrations:
| (3.1) |
where is the intensity scattered by the solution of concentration and is the intensity of the dilute sample, =7 mg/mL, used as the effective form factor. The inset in Fig. 2b shows measured both using SANS ( nm nm-1) and SAXS ( nm nm -1).
The theoretical expression for the effective structure factor was obtained through numerical calculations using integral equation theory with a Percuss-Yevick closure relation for a model of polydisperse spheres and an interaction potential given by a square well potential, Robertus et al. (1989); Klein and D’Aguanno (1996). We use polydisperse spheres to account of the slightly elliptical shape of lysozyme. This approach is further applied in the structure factor calculation.
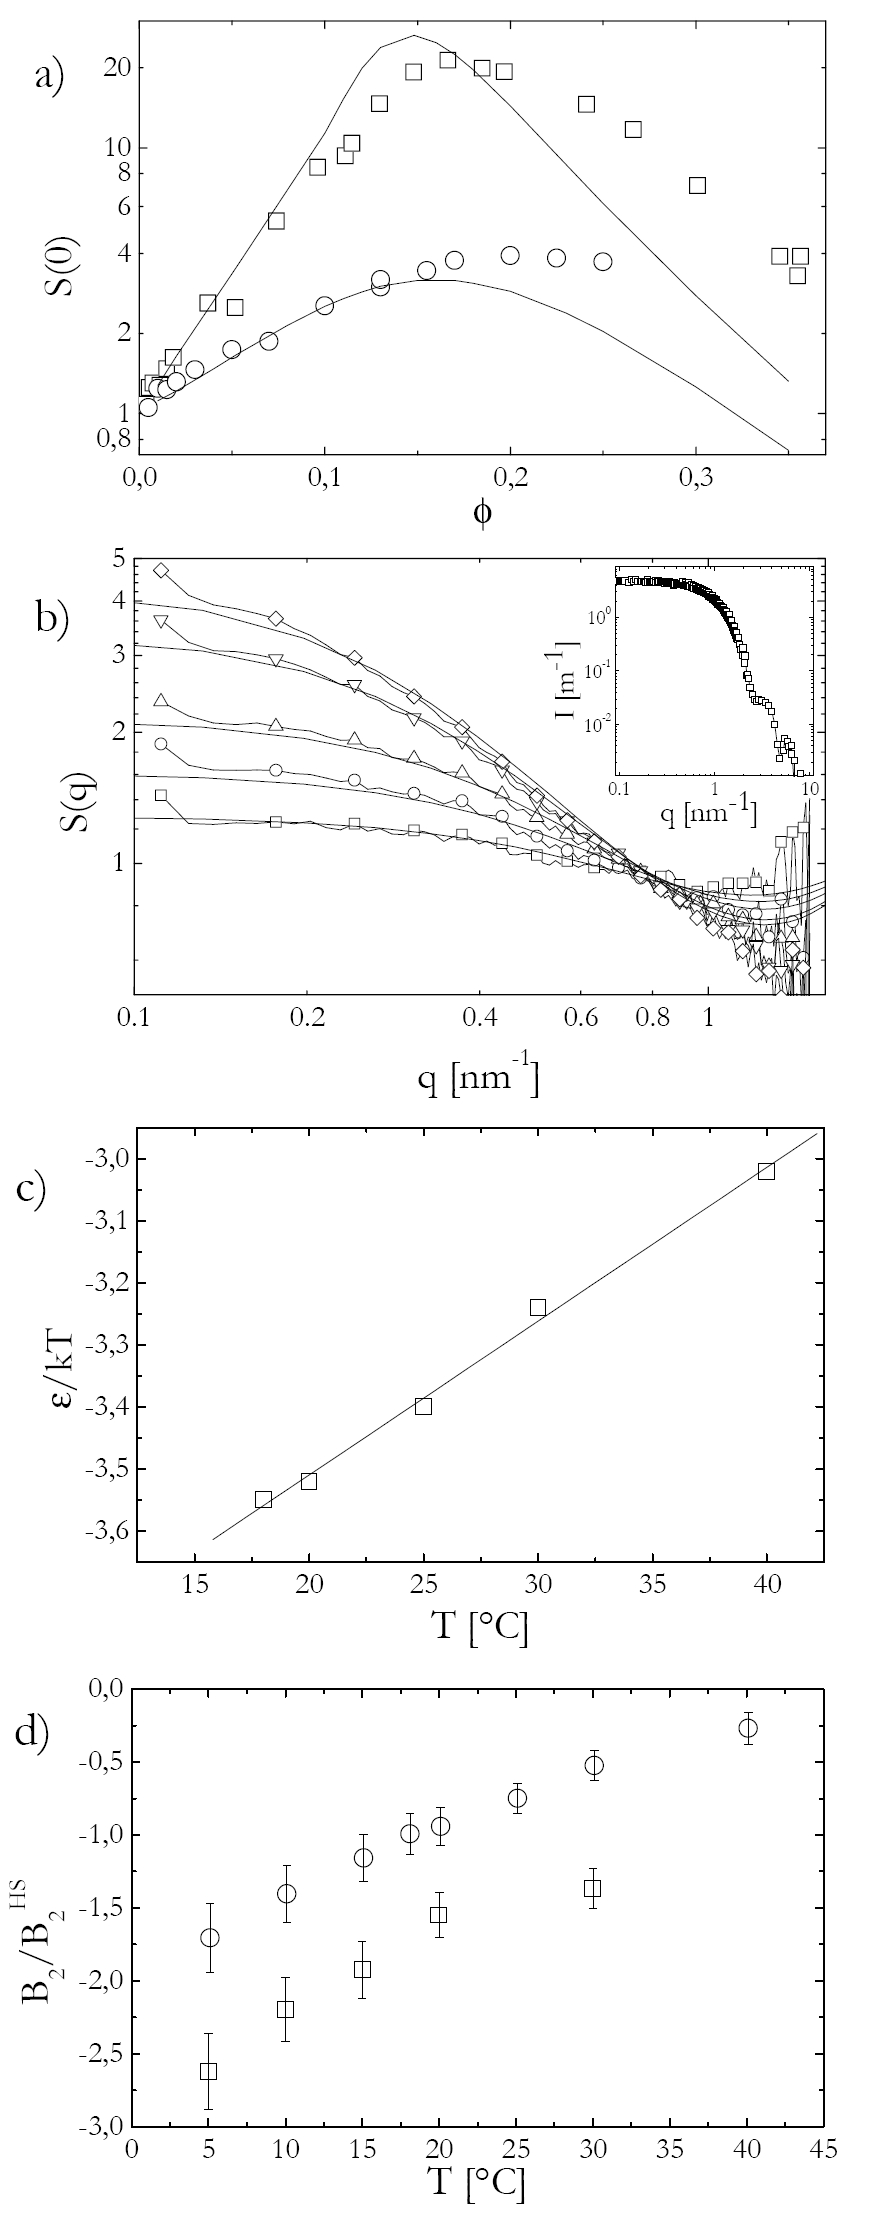
We obtain a satisfying fit of the temperature dependence of the structure factor with a square well interparticle interaction. For the concentration series at a given temperature the range and the depth of the well could be maintained constant, Fig. 2a: =-3,52 for 20∘C and -3.24 for 30∘C, . This simple model underestimates both the position of the critical point as well as the values of at high volume fractions. Those effects might come from the fact that we have taken into account the ellipsoidal shape of lysozyme by introducing polydispersity on spherical objects.
Moreover, the study of the structure factor as a function of temperature, , gives a direct relation between the depth of the short range attraction, and . For a given concentration, =70 mg/mL, could be fitted maintaining the range of the attraction constant (=2.2) as shown in Fig. 2c. This is consistent with the presence of an isosbestic point at . Isosbestic points indeed appear in scattering experiments when adjusting the strength of attraction at constant range, Duits et al. (1991); Ye et al. (1996); Dubois et al. (1999). The analysis of the data shown in Fig.3b provides an estimate of the temperature dependence of as shown in Fig. 2c. scales linearly with temperature, which would suggest that the main temperature dependence of the interparticle interaction is simply through the temperature factor, while other specific temperature effects, such as changes in the hydration of lysozyme, if present, play a minor role. In Fig. 3d, we compare the second virial coefficient measured from SLS and the one calculated based on (). We notice a similar temperature evolution but the calculated second virial coefficients underestimate the attraction.
This study is in agreement with recent work on lysozyme where an adhesive hard sphere model had been used. Rosenbaum and Zukoski as well as Piazza et al. Piazza et al. (1998); Rosenbaum and Zukoski (1996) found a similar temperature dependence of the potential well depth. Similar conclusions on the weak temperature dependence of the potential had also been made by Malfois et al. M. Malfois and Tardieu (1996).
IV ’Classical’ spinodal decomposition
For shallow quenches below the spinodal curve but above the arrest tie line at 15∘C as shown in Fig.1, phase separation proceeds classically via spinodal decomposition. After some time, we obtain two homogeneous phases, a gas like phase with volume fraction , and a liquid phase with volume fraction , separated by a sharp interface.
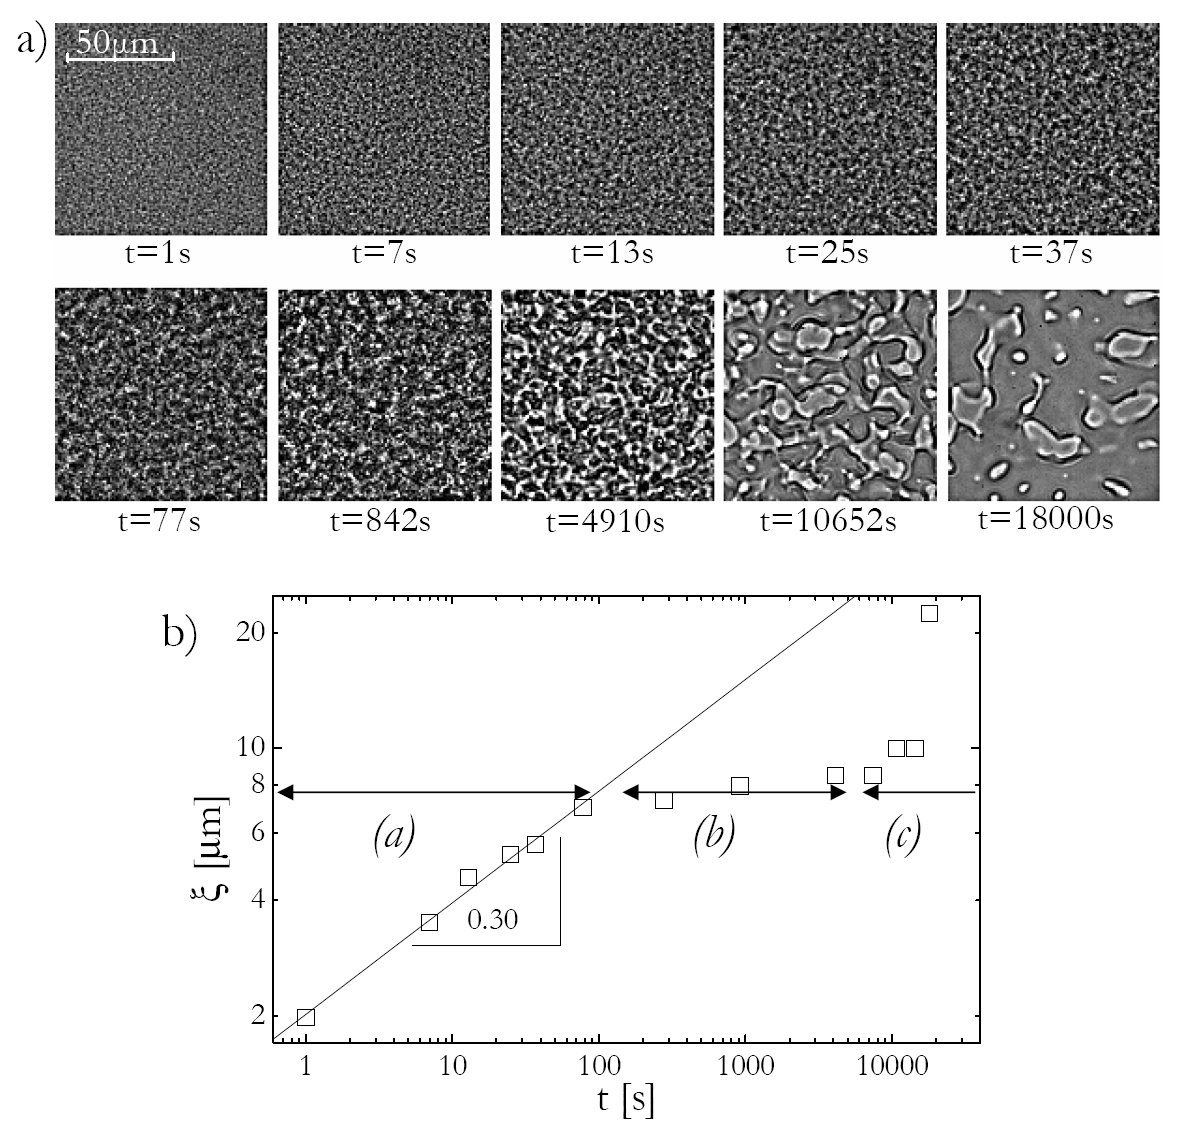
We proceed with a ’slow’ quench and observe the spinodal decomposition under the microscope. At early times, the micrographs in Fig. 3a show the typical evolution of a bicontinuous network with a characteristic size which increases with time, indicating a coarsening of the structures formed during the spinodal decomposition. After about 100 s, the dense phase starts to sediment due to the density mismatch. Micrographs indeed show an increassingly blurred appearance when the focus is moved to the upper part of the capillary. From then on the focus is maintained in the lower part of the capillary tube. Finally, around =1000 s, the dense phase wets the bottom of the capillary and spreads to totaly cover the bottom of the capillary tube. A quantitative evolution of the correlation length, , is obtained by directly measuring in the micrographs or by Fourier transforming the micrographs. The evolution of is presented in Fig. 3b and reflects the three regimes previously described: (a) growth ( 100 s), (b) sedimentation (100 s10000 s), and (c) wetting-spreading (10000 s).
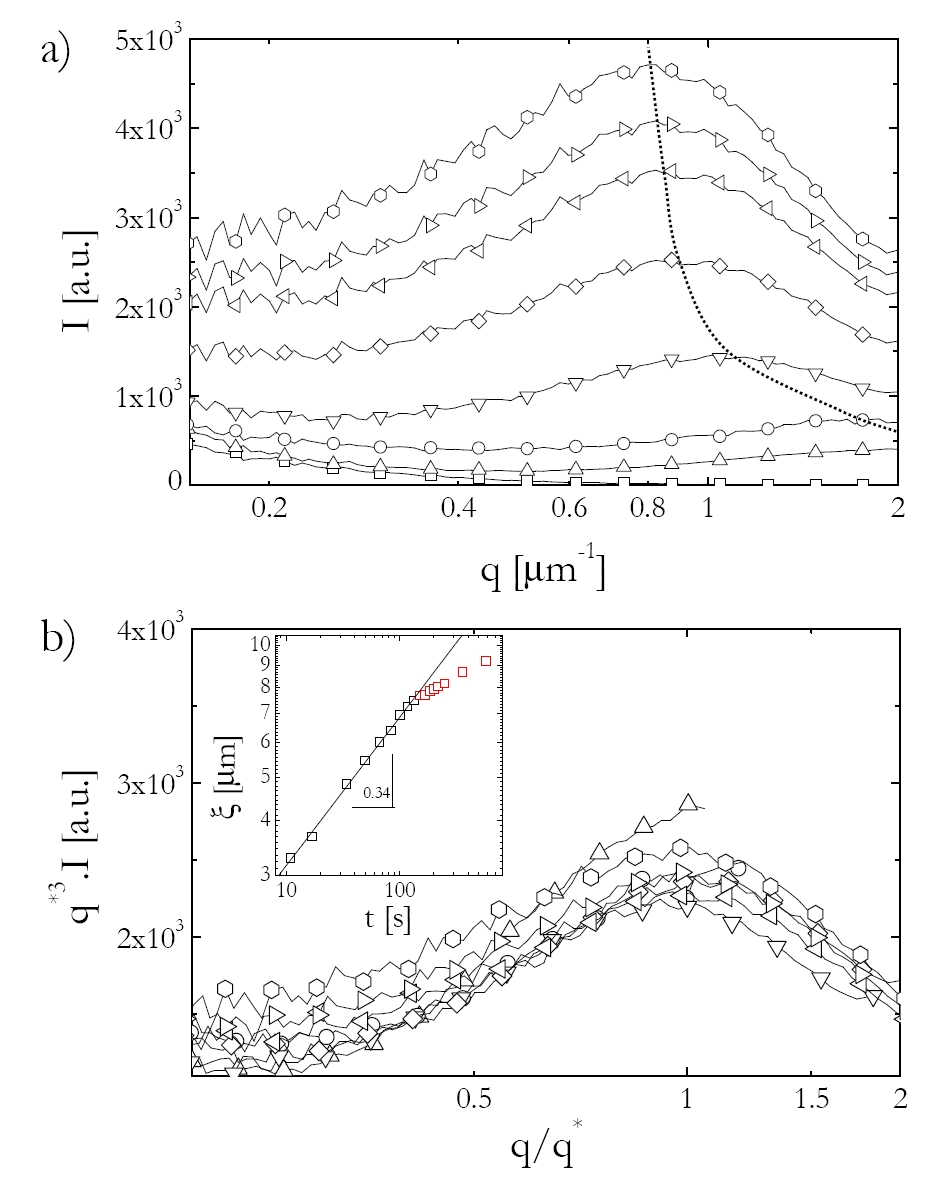
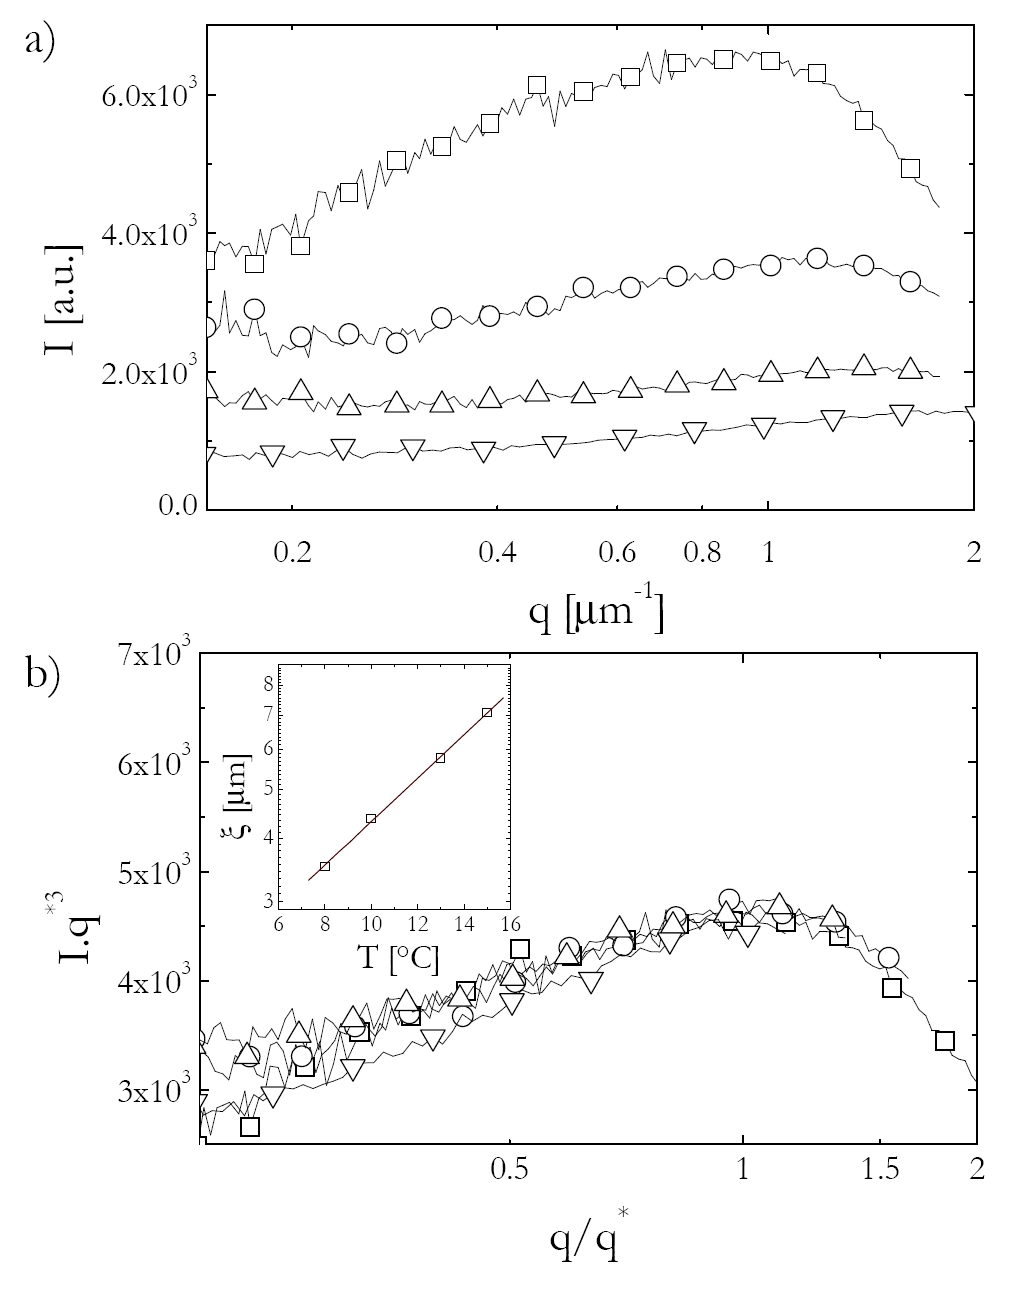
In parallel USALS experiments were carried out. In contrast to microscopy, where a small portion of the sample is imaged, USALS, due to the fact that a large scattering volume is probed, allows to obtain better statistics. The evolution of the spinodal decomposition process and the corresponding characteristic length scale is captured in the Fourier space as shown in Fig. 4a. A peak is observed in the scattering pattern at a scattering vector that corresponds to a characterestic length, . With time the peak increases in amplitude and moves towards lower scattering vectors, indicating a coarsening of the structures formed during the spinodal decomposition. At 100 s, the evolution is perturbed either by sedimentation of the dense phase or by the finite size of the cell. The scattering patterns shown in Fig.5a are typical for spinodal decomposition seen for example in binary mixtures, polymer blends or in classical colloid polymer mixtures Verhaegh et al. (1996); Gunton et al. (1988). This is illustrated in Fig.5b, where the data are shown to follow universal scaling typical for spinodal decomposition processes. We see that the scattering follows a form given by as proposed by Furukawa Furukawa (1984) and derived by Dhont for the spinodal decomposition of colloids in the initial and intermediate stage including hydrodynamic interactions Dhont (1996). We see that all the data obtained in the beginning of the intermediate regime collapse onto a single universal scaling function. The relationship between the peak position and the characteristic length scale now allows us to investigate the temporal evolution of the domain size. Commonly one distinguishes between at least three characteristic regimes during the spinodal decomposition process Bhat et al. (2006): (i) early, (ii) intermediate and (iii) late stage Gunton et al. (1988). The early stage is described by linear Cahn-Hillard theory Cahn and Hilliard (1958); Cahn (1959) and in essence predicts an increase of the amplitude at constant until the peak spatial concentration fluctuations have reached the final coexisting concentrations and domain growth and coarsening sets in. In a simple picture coarsening is expected to occur according to a simple power law , where the scaling exponent is in the intermediate (or diffusive) and in the late (or flow) stage of the coarsening regime Siggia (1995, 1979). A detailed calculation for the intermediate stage including hydrodynamics reveals that the exponent is between 0.2 and 1.1, depending upon the relative importance of hydrodynamic interactions Dhont (1996). Our measurements capture the intermediate diffusive regime. Before any onset of perturbation effects such as sedimentation and finite cell size effects the scattering is in agreement with theoretical predictions and other experiments. (see Verhaegh et al. (1996) and references therein).
V Arrested spinodal decomposition
We have previously demonstrated that lysozyme solutions at high ionic strength offer an interesting pathway to gelation via an arrested spinodal decomposition as sketched in Fig.1. If a sample is prepared above the critical temperature but below the crystal line it remains in a homogenous liquid state characterized by the value of the volume fraction and the temperature until finally crystallization sets in. If such a sample is quenched into the spinodal region to a final temperature below the arrest tie line at 15∘C the sample not only undergoes spinodal decomposition into a bicontinuous network with protein rich and protein poor domains, it also exhibits a non-ergodic transition. The non ergodicity transition is the result of dynamical arrest in the protein rich domains. The resulting arrested spinodal decomposition depends on the history of the sample. The history is indeed defined by the initial equilibrium state, in particular the concentration of the fluid sample, the rate of the temperature quench, the final temperature and the age of the sample. The quench rate influences the time the spinodal decomposition can proceed before it is frozen by dynamical arrest. Since the volume fraction of the arrested protein rich phase, , is lower than the expected value , we assume that the spinodal decomposition gets arrested during the early stage (Fig. 5). In this theory, Verhaegh et al. (1997), fluctuations of concentrations initially have an amplitude that increases with time without changing wavelengths. The wavelength initially favored, , can be deduced from the amplification factor, Verhaegh et al. (1997) which depends on the relative values of the derivative of the chemical potential and the energy cost of a concentration gradient. is related to to by .
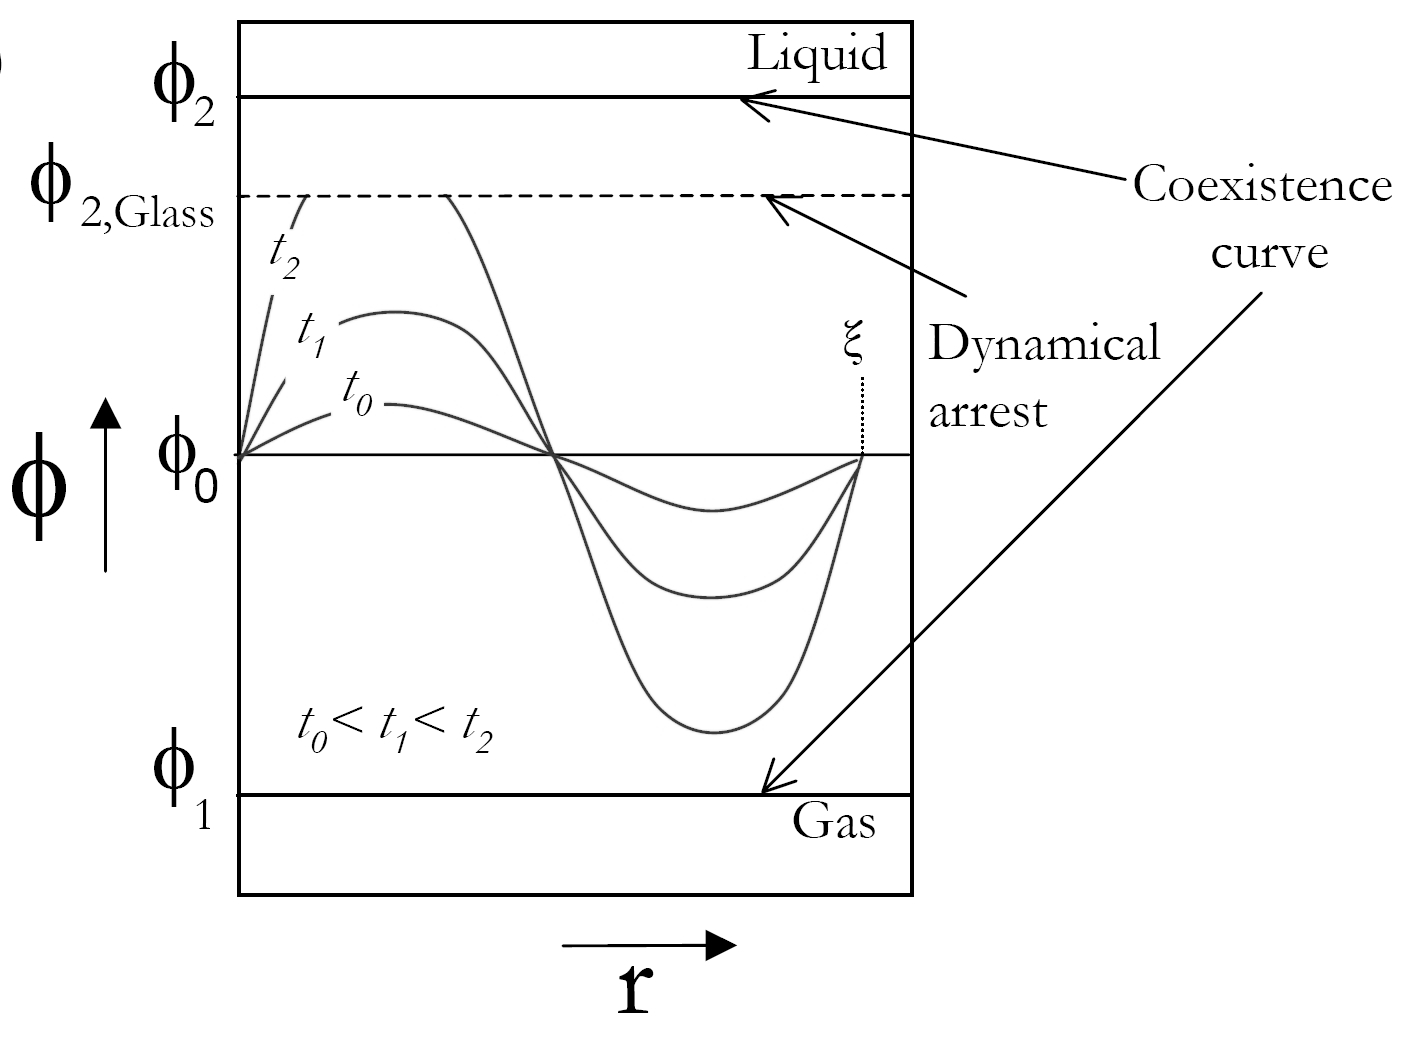
We want to address the question: can we show qualitative agreement between the theory of the early stage of the spinodal decomposition and the relevant experimental parameters? By this we mean: can we show agreement between the evolution the structure and thus the characteristic length of the arrested spinodal decomposition, , as a function of the final temperature, , the initial concentration, , and the position of the dynamical arrest line, ?
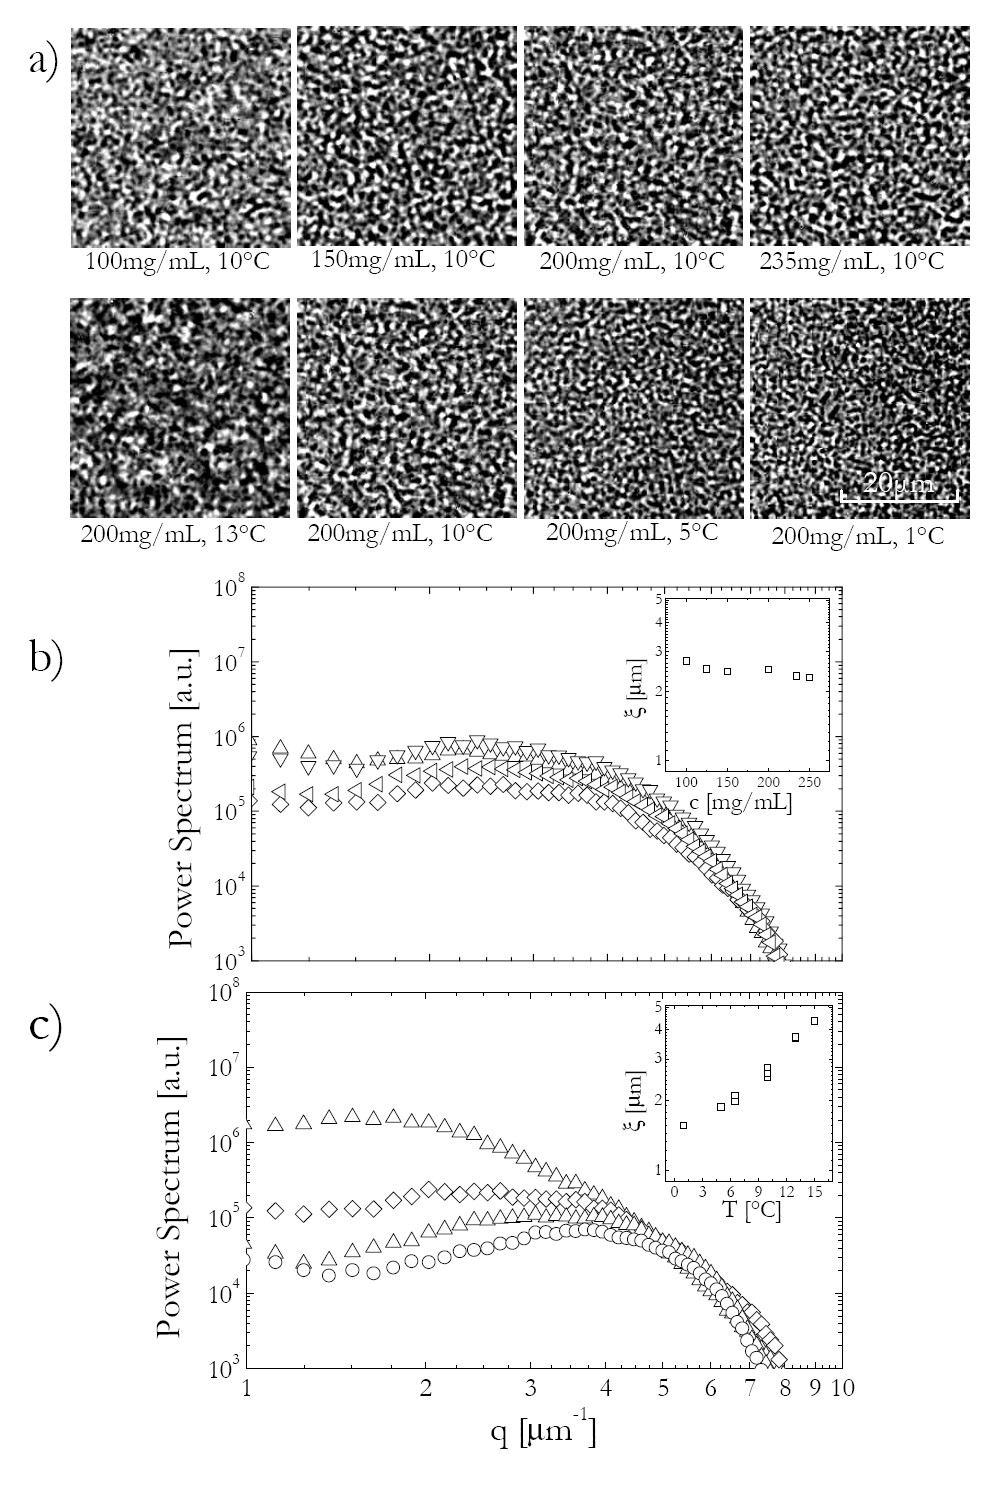
We first focus on the effect of the overall concentration at =10∘C and on the effect of at constant , Fig.6. The quantitative evolution of the the characteristic length for these two series shows two trends. In the concentration series at constant temperature the characteristic length is constant or decreases slightly with an increase in initial concentrations. This suggests that is malmost independent of as the arrest condition is the same: (10∘C)=0.32.
In the temperature series the characteristic length decreases with decreasing temperatures (Fig. 6c). It implies that the wavelength initially favored, , moves to higher values as decreases. We also observe that the amplitude of the peak (Fig. 6c), diminishes with decreasing temperatures. Fig.7 shows similar results obtained in USALS. This implies that the contrast is lower and that the phase separation gets arrested earlier when decreases. This is in agreement with the fact that the difference between and , which set the contrast, decreases as decreases.
We then look at the influence of the rate of the quenches on the characteristic length of samples showing arrested spinodal decomposition (Fig. 8). We observe larger characteristic lengths for slow quenches at constant . This in agrement with the previous assumptions. Since is shifted toward larger values as decreases and the system spends more time at high in slow quenches and possibly arrests before reaching the final temperature , and we expect to obtain larger characteristic length for ’slow’ quenches.
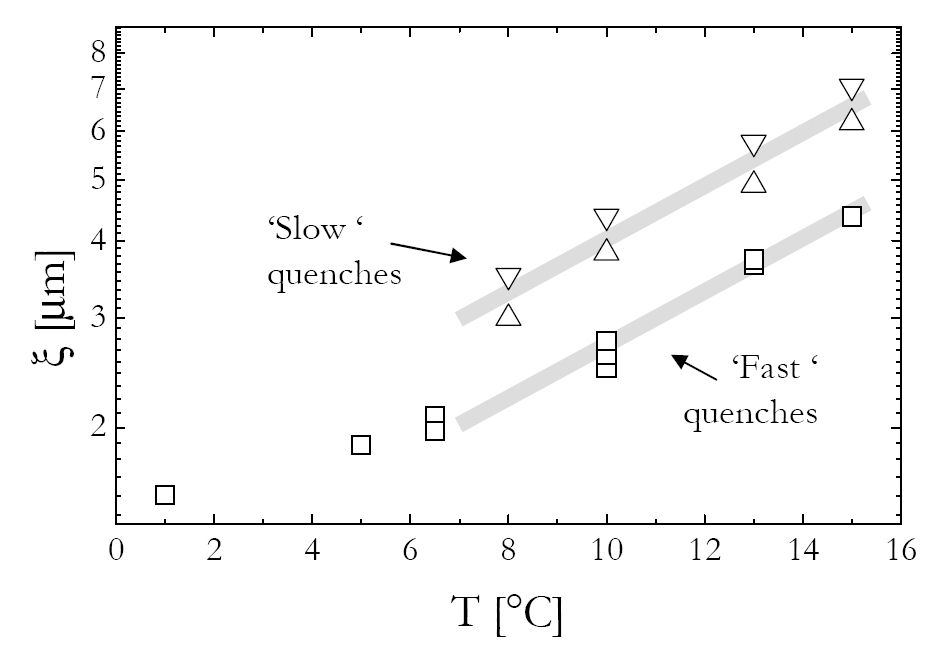
To conclude, the structure of the system created in the course of an arrested spinodal decomposition is mainly determined by the interplay between the early stages of the demixing process and the position of the glass line. Moreover, the resulting characteristic mesh size of the network is strongly influenced by the quench rate. Theoretical support would be needed to test the following assumption: predominantly depends on but only slightly on .
VI Local structure of the arrested spinodal decomposition
VI.1 Simple approach
In a next step we take a closer look at the local structure of the arrested spinodal network probed with SAXS and SANS. We aim at characterizing the interface between the gas-like and the glass-like phases and the local structure of the glass-like phase. The local structure of the dense phase depends on the local volume fraction but also on the interactions between the proteins. Given the fact that we expect the local structure to exhibit only weak variations as the system dynamically arrests when crossing the arrest line, we use liquid state theory to calculate the static structure factor at length scales comparable to the monomer diameter. We then compare the scattering results with model calculations where we use a square-well potential as defined in section III to approximate the protein-protein interactions.
Figure 9a shows the evolution of the intensity as a function of the final temperature after a fast quench at =0.15. Figure 9b shows the evolution of the intensity as a function the initial volume fraction, at 10∘C. At low we observe a Porod regime, , which confirms the idea that the gel is a bicontinuous network with a sharp interface between the gas phase and the dense glass-like phase. As temperature decreases, the intensity of the Porod regime increases, reflecting an increase of the surface to volume ratio of the glassy backbone backbone (see equation below). At the same temperature but different concentrations the network seems to have the same characteristic length, which then appears to depend mainly on the common arrest condition, =0.32. One can deduce the surface to volume ratio from the Porod regime:
| (6.2) |
In this equaton is the total interface area and is the volume of the sample. is the excess scattering length density and it is given by contrast between the dilute phase and the dense phase. The gas phase is characterized by its volume fraction and the relative volume of the gas network ( is determined using centrifugation experiments, Cardinaux et al. (2007)). The dense phase is characterized by its volume fraction and the relative volume of the dense network, . can be approximated by
| (6.3) |
The results of the calculation of the volume to surface ratio using equations 2 and 3 are tabulated in Tab.1. The results indicate that the ratio increases as the initial concentration decreases. This seems reasonable as the characteristic length and the local concentrations are independent of the initial concentration. The ratio increases with temperature. This seems also reasonable as the characteristic length increases with temperature.
.
| [] | 13 | 10 | 5 | 10 |
|---|---|---|---|---|
| [mg/mL] | 200 | 200 | 200 | 150 |
| [mg/mL] | 34 | 55 | 65 | 55 |
| [mg/mL] | 465 | 444 | 353 | 444 |
| 0.33 | 0.37 | 0.47 | 0.24 | |
| [m] | 3.5 | 2.5 | 1.9 | 2.5 |
| [nm] | 332 | 183 | 76 | 326 |
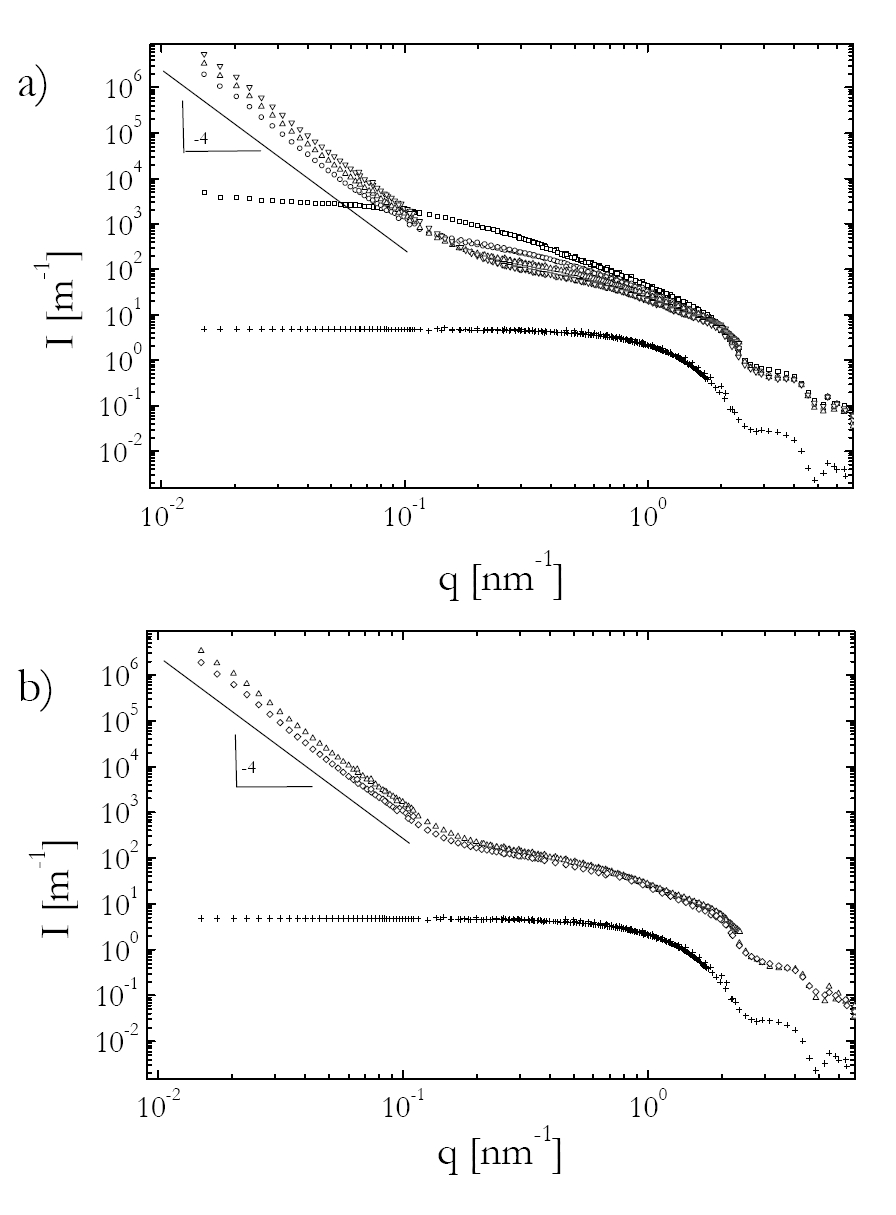
At larger the intensity reflects the local organization of the dense phase and the particle interactions. was again obtained solving numerically the Percus-Yevick (PY) theory with a square-well potential including polydispersity using the algorithm in Robertus et al. (1989); Klein and D’Aguanno (1996). The square-well potential parameters were taken from the fits from the previous section based on the extrapolation of obtained in the fluid region to . Assuming that the contribution of the gas phase (1) and the glass phase (2) are uncorrelated, the intensity was estimated as follows:
| (6.4) |
where the calculated structure factor, , is given by Spalla et al. (2003):
| (6.5) |
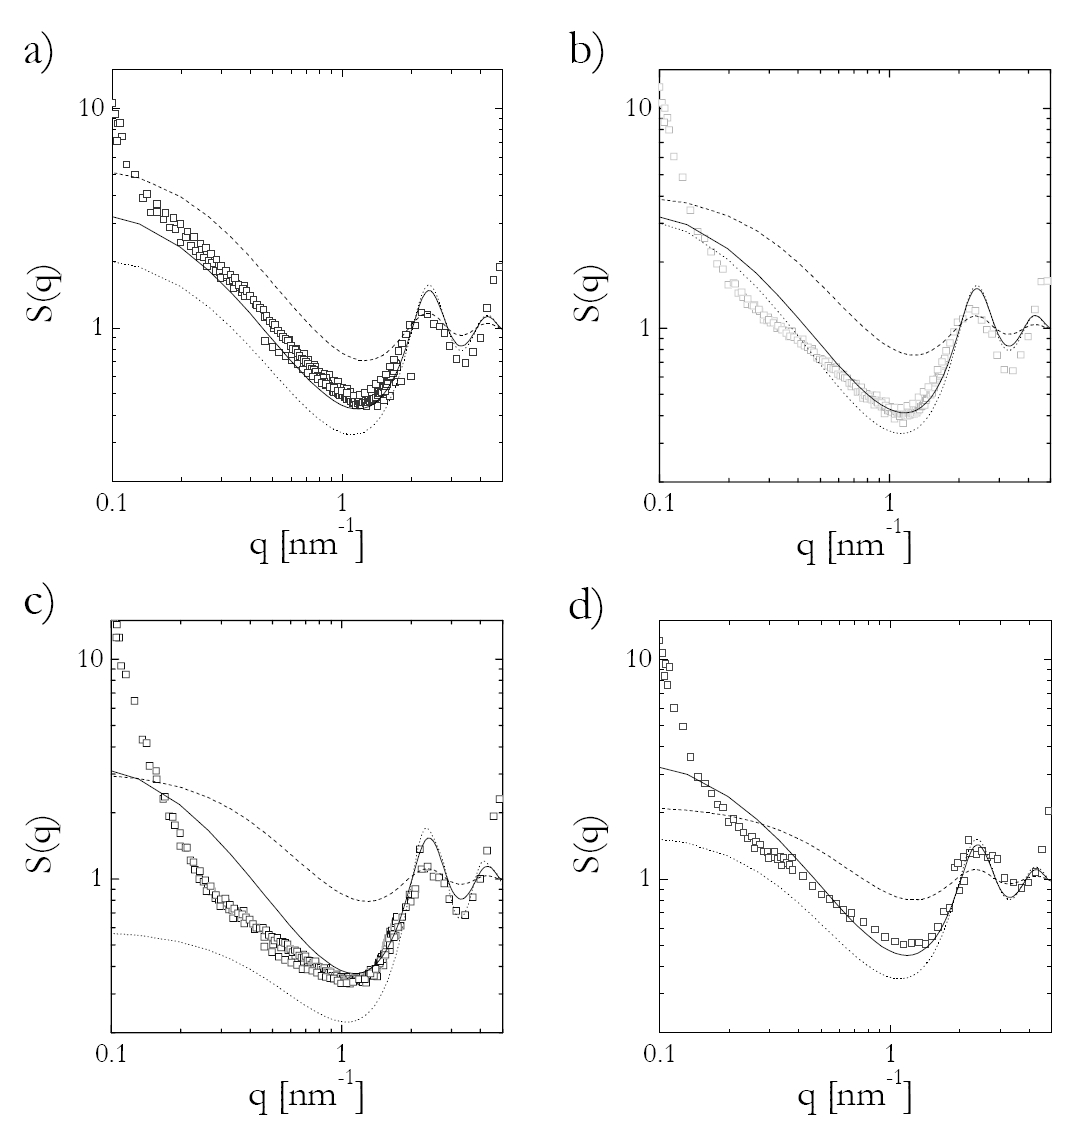
Table 1 displays the values of the parameters used in the calculations.
This approach is motivated by the fact that in general repulsive and attractive glasses show typical fluid structure as the system goes through the dynamical arrest transition. The results of these calculations are shown in Fig. 10. Although this empirical model provides surprisingly good agrement at intermediate and high , deviations at large show that the approach does not capture the structure on larger length scale. Therefore the analysis in the next section is applied.
VI.2 Russian Doll Reverse Monte Carlo analysis of the intensity
We have shown that we obtain quantitative and consistent information about the structure of the arrested spinodal with a combination of scattering and optical microscopy over a very large range of length scales. A remaining difficulty is the situation of structure at intermediate length scales or wave vectors, in particular if we like to get information beyond the fact that the extended Porod region indicates the formation of well-separated regions of different concentrations with a well-defined interface. Therefore, we have developed a new reverse Monte Carlo (RMC) method for the analysis of the structure of the concentrated phase based on the scattering data (Fig. 11).
Use of standard direct Monte Carlo would be extremely time consuming, as typically some 106 particles make up the biggest structures. Indeed, the experimental range is very large (down to 0.01 nm-1), and the size of the primary lysozyme quite small ( nm). To limit the computational efforts, we need a course graining procedure, which we term ’Russian Doll RMC’. The idea is to describe the structure on a small length scale with few particles, regroup them into a ’meta-particle’, and use it to build a higher order structure, and so on. Each level is described by an ensemble of particles, using a conventional reverse Monte Carlo (RMC) algorithm Oberdisse et al. (2007); McGreevy (2001). The idea is to build a first-guess-structure, and improve the agreement of its in the corresponding -range with the experimentally measured one by randomly displacing individual subunits. These displacements are confined inside the spherical next order metaparticles, which is a way to control internal volume fraction and interactions. Due to possible interpenetration of the less dense metaparticles, the excluded volume condition is maintained only on the smallest length scale. Structure factors can then be calculated using the Debye formula Debye (1947). Intensities are obtained by straightforward multiplication of the lysozyme form factor and structure factors for (on average) spherically symmetric metaparticles, followed by addition of the dilute-phase intensity. The intensity is average over many simulations to overcome one important short coming of the approach: the calculated scattering curve is that of only one structure whereas in reality, an ensemble of structures contribute.
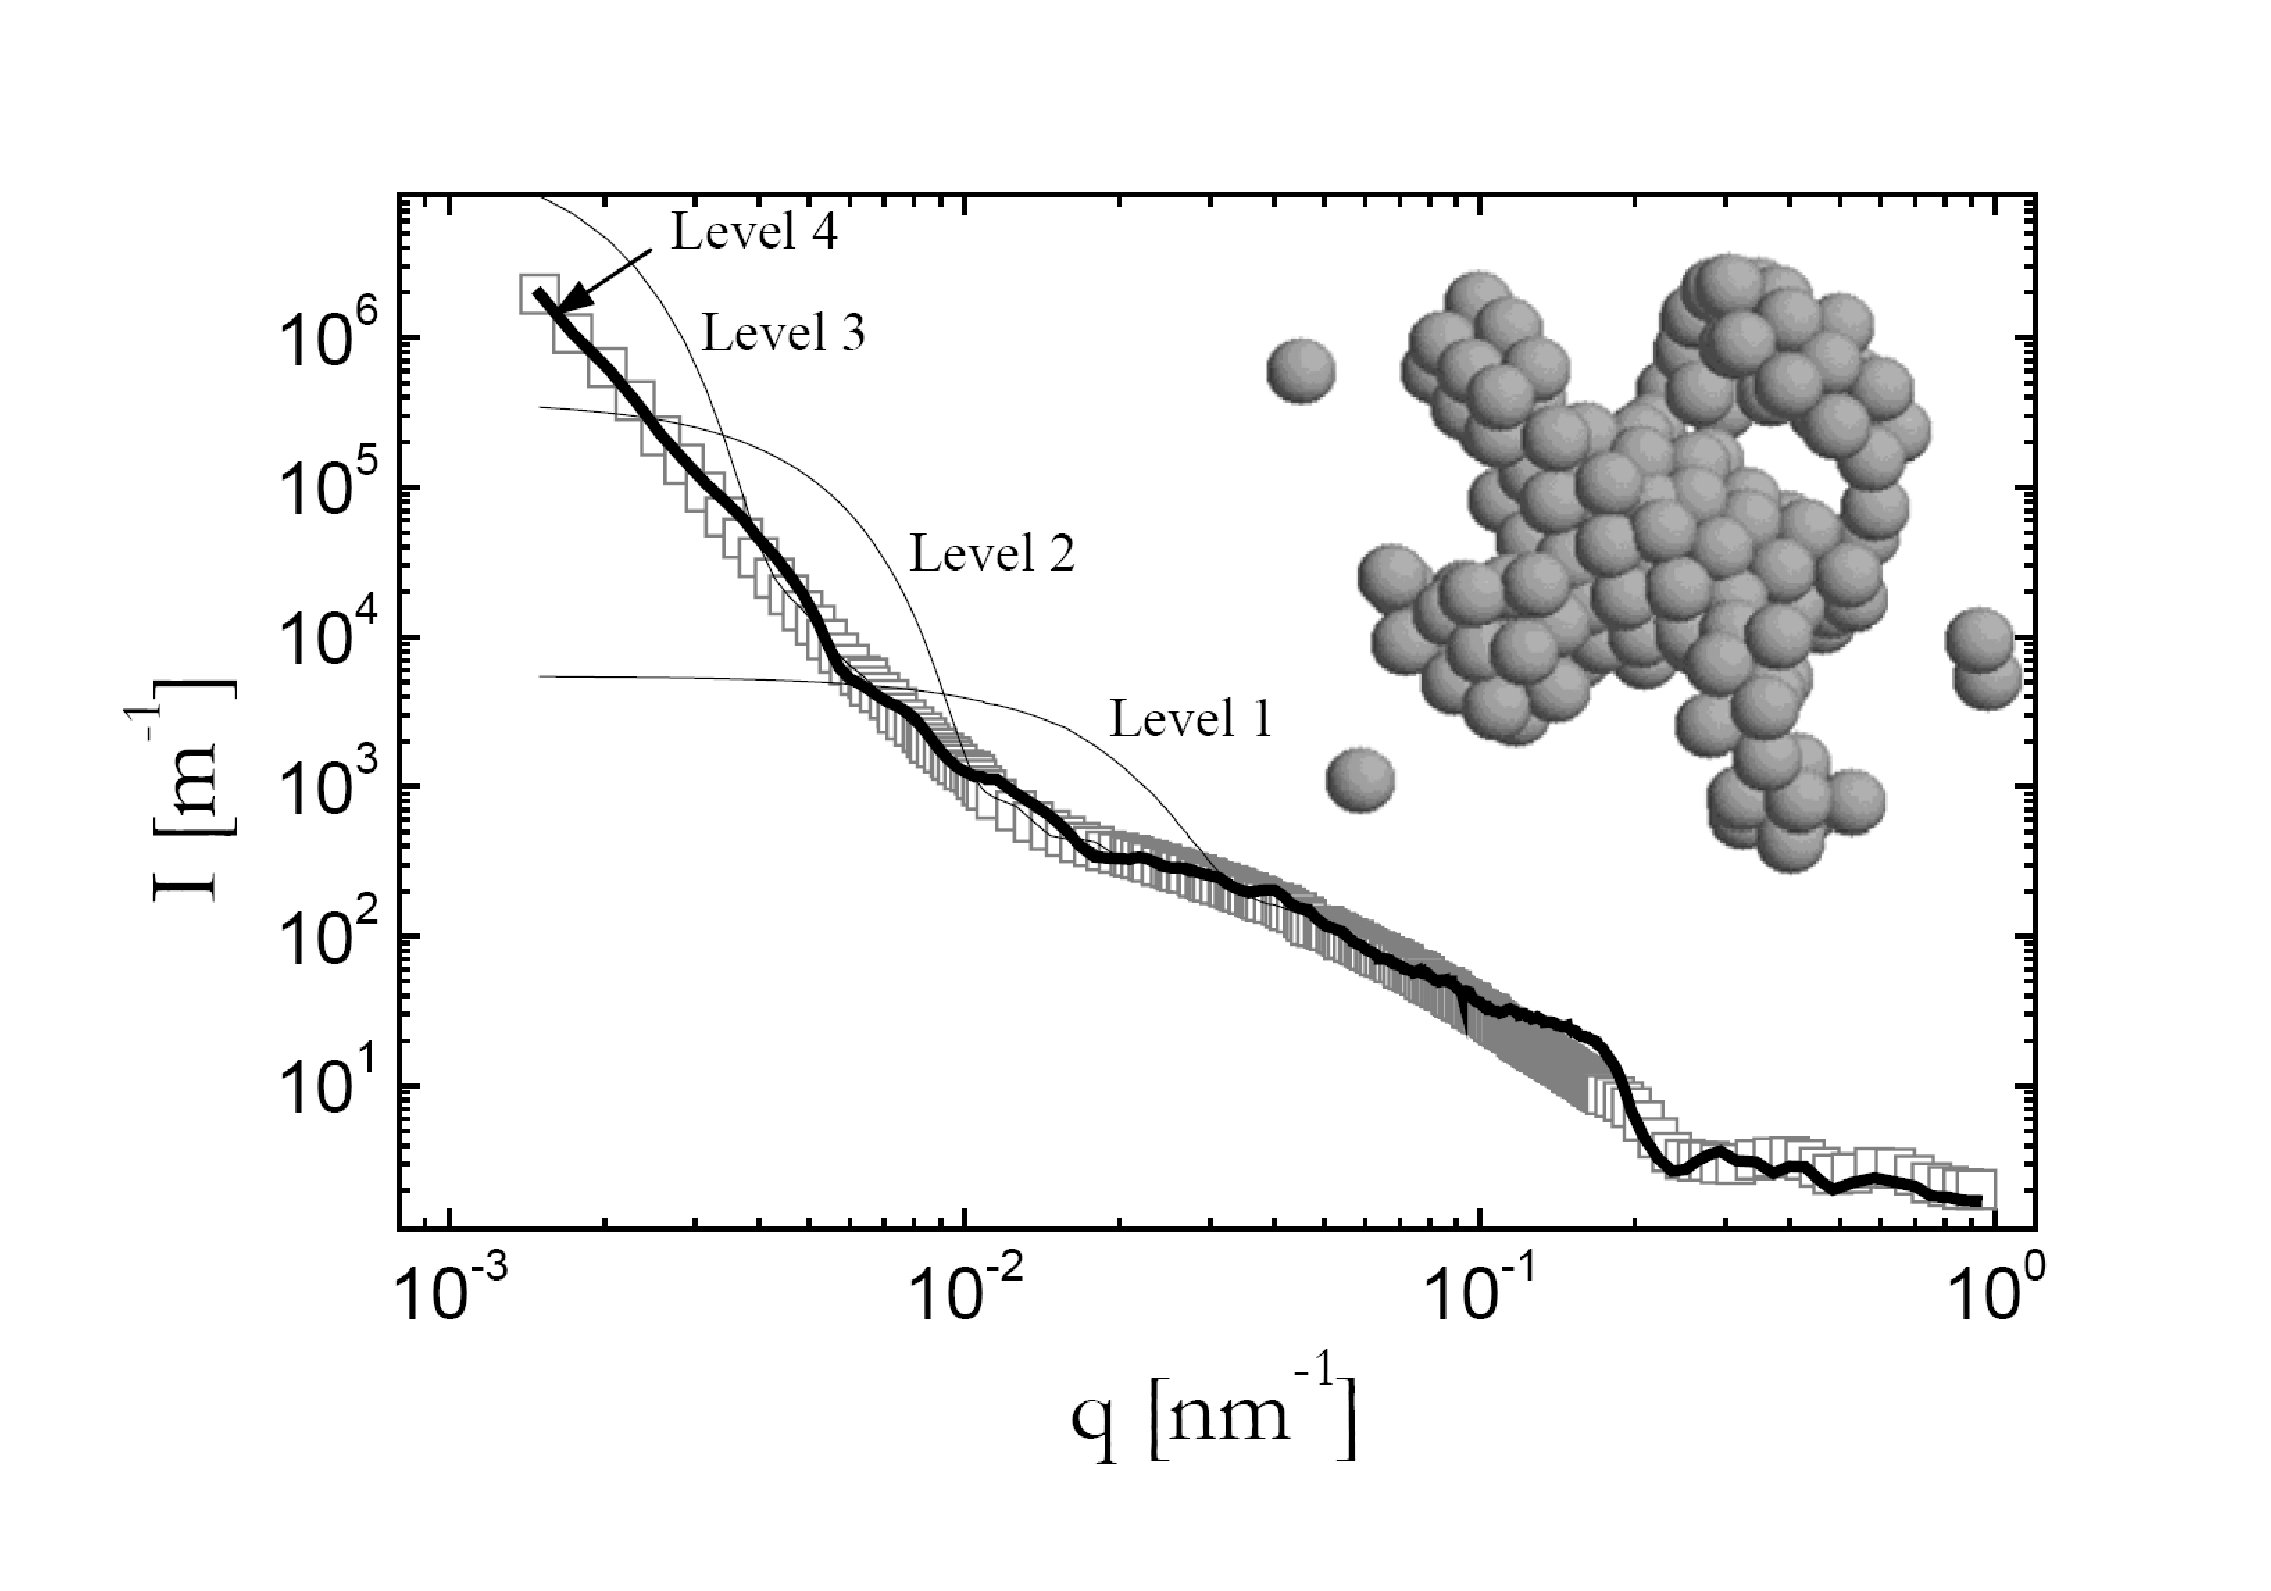
We focus on the temperature quench to 13∘C (=200 mg/mL), but a very similar approach could be applied to the other samples. In Figure 11, the experimental intensity is compared to the successive fits on the various length scales. At the smallest scale, 50 lysozyme particles make up a first metaparticle of radius 11.5 nm. Some deviations can be observed, presumably due to non sphericity of the proteins. At intermediate , 70 of these metaparticles form the next higher structure of radius 44 nm, 50 of which are then regrouped on the third level ( = 131 nm), and finally 200 of these biggest particles make up the largest structure (1000 nm). This structure represents 3.5x10⁶ lysozyme particles which make up the dense phase (35% volume fraction) inside the dilute one. For illustration, this biggest structure is plotted as an inset in figure 11. It reproduces the microscopic phase separation, on the typical length scale of which - two to three metaparticle diameters which approaches one micron (consistent with light scattering and microscopy). The scattered intensity is found to be well fitted by the RMC simulation. In particular, all major features (low- Porod, break in slope, high- lysozyme structure) are reproduced in an at least semi-quantitative manner.
To summarize, we have shown that our new Russian Doll-RMC leads to semi-quantitative agreement and reasonable consistency with other experiments. For future work, the limits of this approach will need to be tested, and in particular the set of working parameters (size and number of metaparticles) will have to be determined.
VII Conclusion
We have exploited the protein-colloid analogy to show that the short-range attraction of lysozyme at a high salt content could be successfully modeled by a square well potential. In such systems we have shown that it is possible to tailor the mesh size of an arrested spinodal network with respect to the quench rate and the quench depth. The origin of this comes from the interplay between the early stage of spinodal decomposition and the position of the glass line. This opens up new routes to prepare gel-like systems with adjustable structural and mechanical properties. It should be particulary useful in materials and food science. Moreover, the local structure of the arrested spinodal decomposition could be qualitatively modeled using a square well potential and an empirical decomposition of the structure factor into a contribution from the dilute gas-like and concentrated glass-like phase. We have developed a new method to analyze the intensity scattered by arrested spinodal decomposition: Russian Doll Reverse Monte Carlo. The first results are encouraging (semi-quantitative agreement and a reasonable consistency with other experiments) and we will in the future put more effort into improving this analysis method.
Acknowledgements.
We are deeply grateful for fruitful discussions with Veronique Trappe and Roberto Cerbino. This work was supported by the Swiss National Science Foundation, the State Secretariat for Education and Research (SER) of Switzerland and the Marie Curie Network on Dynamical Arrest of Soft Matter and Colloids (MRTN-CT-2003-504712). Julian Oberdisse thanks the Royal Society of Chemistry for an international author award financing his stay in Fribourg.References
- Mezzenga et al. (2005) R. Mezzenga et al., Nature Material 4, 729 (2005).
- Trappe and Sandkuhlerb (2005) V. Trappe and P. Sandkuhlerb, Curr. Opin. Coll. Interf. Sci. 18, 494 500 (2005).
- Zaccarelli (2007) E. Zaccarelli, J. Phys.: Condens. Matter 19, 323101 (2007).
- Cardinaux et al. (2007) F. Cardinaux et al., Phys. Rev. Lett. 99, 118301 (2007).
- Lu et al. (2008) P. Lu et al., Nature 453, 499 503 (2008).
- Manley et al. (2005) S. Manley et al., Phys. Rev. Lett. 95, 238302 (2005).
- Buzzaccaro et al. (2007) S. Buzzaccaro, R. Rusconi, and R. Piazza, Phys. Rev. Lett. 99, 098301 (2007).
- Porod (1982) G. Porod, Small Angle X-ray Scattering (Acamedic Press, London, 1982).
- Pusey (1991) P. N. Pusey, Liquids, Freezing and the Glass Transition (North-Holland, Amsterdam, 1991).
- Frenkel (2002) D. Frenkel, Science 296, 65 (2002).
- Anderson and Lekkerkerker (2002) V. J. Anderson and H. N. W. Lekkerkerker, Nature 416, 811 (2002).
- Tanford and Roxby (1972) C. Tanford and R. Roxby, Biochemistry 11, 2192 (1972).
- Stradner et al. (2006) A. Stradner et al., J. Phys. Chem. B 110, 21222 (2006).
- Millero et al. (1976) F. J. Millero, G. K. Ward, and P. Chetirkin, The Journal of Biological Chemistry 251, 4001 (1976).
- Bhat et al. (2006) S. Bhat, R. Tuinier, and P. Schurtenberger, J. Phys.: Condens. Matter 18, 339 (2006).
- Pedersen (2004) J. S. Pedersen, J. Appl. Crystallogr. 37, 369 (2004).
- Vliegenthart et al. (1999) G. A. Vliegenthart, J. F. M. Lodge, and H. N. W. Lekkerkerker, Physica A 263, 378 (1999).
- Foffi et al. (2005) G. Foffi, C. D. Michele, F. Sciortino, and P. Tartaglia, Phys. Rev. Lett. 94, 078301 (2005).
- Noro and Frenkel (2000) M. G. Noro and D. Frenkel, J. Chem. Phys. 113, 2941 (2000).
- Robertus et al. (1989) C. Robertus, W. H. Phillipse, J. G. H. Joosten, and Y. Levine, J. Chem. Phys. 90, 4482 (1989).
- Klein and D’Aguanno (1996) R. Klein and B. D’Aguanno, Light Scattering, Principles and Development (Owxford, 1996).
- Duits et al. (1991) M. H. G. Duits, R. P. May, A. Vrij, and C. G. D. Kruif, Langmuir 7, 62 (1991).
- Ye et al. (1996) X. Ye, T. Narayanan, P. Tong, and J. S. Huang, Phys. Rev. Lett. 76, 4640 (1996).
- Dubois et al. (1999) E. Dubois, V. Cabuil, F. Boue, and R. Perzynski, J. Chem. Phys. 111, 7147 (1999).
- Piazza et al. (1998) R. Piazza, V. Peyre, and V. Degiorgio, Phys. Rev. E 58, R2733 (1998).
- Rosenbaum and Zukoski (1996) D. F. Rosenbaum and C. F. Zukoski, J. Cryst. Growth 169, 752 (1996).
- M. Malfois and Tardieu (1996) L. B. M. Malfois, F. Bonnet and A. Tardieu, J. Chem. Phys. 105, 3290 (1996).
- Verhaegh et al. (1996) N. A. M. Verhaegh, J. S. van Duijneveldt, J. K. G. Dhont, and H. N. W. Lekkerkerker, Physica A 230, 409 (1996).
- Gunton et al. (1988) J. P. Gunton, M. S. Miguel, and P. S. Sahni, Phase Transitions and Critical Phenomena vol. 8 (New York: Academic, 1988).
- Furukawa (1984) H. Furukawa, Physica A 123, 497 (1984).
- Dhont (1996) J. K. G. Dhont, J. Chem. Phys. 105, 5112 (1996).
- Cahn and Hilliard (1958) J. W. Cahn and J. E. Hilliard, J. Chem. Phys. 28, 258 (1958).
- Cahn (1959) J. W. Cahn, J. Chem. Phys. 30, 1121 (1959).
- Siggia (1995) E. D. Siggia, Macromolecules 28, 4129 (1995).
- Siggia (1979) E. D. Siggia, Phys. Rev. A 20, 595 (1979).
- Verhaegh et al. (1997) N. A. M. Verhaegh et al., Physica A 242, 104 (1997).
- Spalla et al. (2003) O. Spalla, S. Lyonnard, and F. Testard, J. Appl. Cryst. 36, 338 (2003).
- Oberdisse et al. (2007) J. Oberdisse, P. Hine, and W. Pyckhout-Hintzen, Soft Matter 2, 476 (2007).
- McGreevy (2001) R. McGreevy, Journal of Physics: Condensed Matter 13, 877 (2001).
- Debye (1947) P. Debye, Phys. Coll. Chem. 51, 18 (1947).