SUZAKU OBSERVATION OF THE NEW SOFT GAMMA REPEATER SGR 0501+4516 IN OUTBURST
Abstract
We present the first Suzaku observation of the new Soft Gamma Repeater SGR 0501+4516, performed on 2008 August 26, four days after the onset of bursting activity of this new member of the magnetar family. The soft X-ray persistent emission was detected with the X-ray Imaging Spectrometer (XIS) at a 0.5–10 keV flux of erg s-1cm-2, with a spectrum well fitted by an absorbed blackbody plus power-law model. The source pulsation was confirmed at a period of s, and 32 X-ray bursts were detected by the XIS, four of which were also detected at higher energies by the Hard X-ray Detector (HXD). The strongest burst, which occurred at 03:16:16.9 (UTC), was so bright that it caused instrumental saturation, but its precursor phase, lasting for about 200 ms, was detected successfully over the 0.5–200 keV range, with a fluence of erg cm-2 and a peak intensity of about 89 Crab. The entire burst fluence is estimated to be times higher. The precursor spectrum was very hard, and well modeled by a combination of two blackbodies. We discuss the bursting activity and X/-ray properties of this newly discovered Soft Gamma Repeater in comparison with other members of the class.
Subject headings:
pulsar: individual (SGR 0501+4516) — stars: magnetic fields — X-rays: stars1. INTRODUCTION
A new Soft Gamma Repeater (SGR), SGR 0501+4516, was discovered on 2008 August 22 by the Swift Burst Alert Telescope, thanks to the detection of many short bursts (Holland and Sato 2008; Barthelmy et al. 2008). Archival ROSAT data showed a faint X-ray source consistent with the position of this new SGR, probably its quiescent counterpart (Kennea & Mangano 2008).
SGRs are a sub-class of the so called “magnetars”, believed to be isolated neutron stars with very strong magnetic fields ( G: Thompson & Duncan 1995). This extreme magnetic field powers their bright emission, rather than accretion or rotational power as for most of the X-ray pulsars. Only four confirmed SGRs are known to date, all sharing common properties with the other magnetars (the Anomalous X-ray Pulsars, aka AXPs) such as i) a spin period in a very small range of values ( s), ii) large period derivatives ( s s-1), iii) bright persistent X-ray emission ( erg s-1), compared to the rather dim infrared counterparts, iv) unpredictable bursting and flaring activity, with a large range of energetics ( erg s-1) and timescales (ms to years), and v) transient radio emission (sometimes pulsed) connected with their X-ray activity (Woods & Thompson 2006; Mereghetti 2008).
We report in this Letter on a Suzaku Target of Opportunity (ToO) observation of SGR 0501+4516, the first new SGR discovered in our Galaxy in the last ten years, which was performed only four days after the bursting activation.
2. OBSERVATION
A ToO observation of SGR 0501+4516 was performed with Suzaku (Mitsuda et al. 2007), on 2008 August 26 starting at 00:05 (UT), until August 27 08:25 (UT). The X-ray Imaging Spectrometer (XIS; Koyama et al. 2007) was operated in the normal mode with 1/4 window option, to ensure a time resolution of 2 s. The Hard X-ray Detector (HXD; Takahashi et al. 2007) was in the standard mode, wherein individual events have a time resolution of s, and the four-channel HXD-WAM counts are available every 1 s. The target was placed at the “XIS nominal” position.
The XIS and HXD data were both processed with the Suzaku pipeline processing ver. 2.2.8.20. Events were discarded if they were acquired in the South Atlantic Anomaly, or in regions of low cutoff rigidity ( GV for XIS and GV for HXD), or with low Earth elevation angles. The net exposures obtained with the XIS and the HXD were 43 ks and 55 ks, respectively.
3. ANALYSIS AND RESULTS
3.1. The persistent soft X-ray emission
The on-source XIS events were extracted from each of the 3 XIS cameras, over a region in radius centered on the target position. The background events were derived from a similar region as far away from the source as possible.
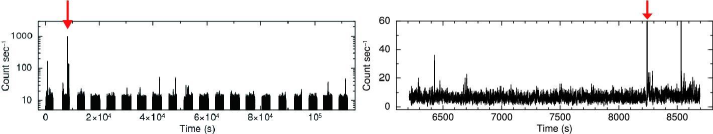
We detected SGR 0501+4516 at a 0.4–10 keV count rate of 1.74 count s-1 with each XIS front-illuminated (FI) CCD (XIS 0 and XIS 3), and 1.82 count s-1 with the back-illuminated (BI) one (XIS 1). The 0.4–10 keV XIS light curve presented in Figure 1 reveals 32 short ( s) burst episodes, where the count rate per 2 s, summed over the 3 cameras, increased by more than above the persistent emission (plus background). Several of them were also detected with the HXD (§3.2).
After eliminating the 32 bursts, we began the timing analysis (using Xronos 5.21) by converting all the event arrival times to the Solar System barycenter. A power spectrum analysis confirmed the reported s periodicity (Göğüş et al. 2008) in several harmonics. By folding the data at the fundamental period and employing a phase-fitting technique (Dall’Osso et al. 2003), the best-fit period was found to be s at the 14704.0 TJD epoch (all uncertainties are at the 90% confidence level). This is consistent with those measured with RXTE, Swift, and XMM-Newton (Göğüş et al. 2008; Israel et al. 2008a).
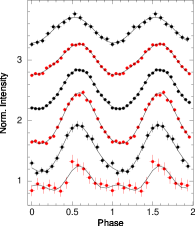
Given the XIS timing resolution of 2 s, we cannot study detailed pulse profile sub-structures. However, looking at the 0.5–12 keV XIS profiles as a function of energy (Figure 2 bottom), we found that below about 5 keV one sinusoidal function at the fundamental spin frequency fit the profile shape well, while at higher energies the second harmonic component is needed at a significance of 4 to reproduce the profile. The pulsed fraction (defined as the semi-amplitude of the fundamental sinusoidal modulation divided by the mean background-subtracted count rate) was 30(1)% on average, while it varied with energy as 21(3), 24(2), 30(2), 43(1), 30(3), and 20(3)%, at 0.4–1, 1–2, 2–3, 3–5, 5–7, and 7–10 keV, respectively.
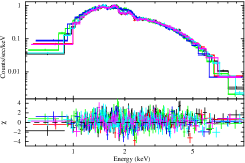
Soft X-ray spectra of the persistent emission were studied with XSPEC12. We modeled the background-subtracted XIS-FI (XIS 0 plus XIS 3) and XIS-BI spectra jointly with an absorbed blackbody plus power-law, a typical empirical spectral decomposition for magnetars. A multiplicative constant factor was used to account for calibration uncertainties between XIS-FI and XIS-BI, which were %. As presented in Figure 2, we found a good fit ( with 603 degrees of freedom) with an hydrogen column density of cm-2, a photon-index of , and a blackbody temperature and radius of keV and km, respectively, where is the source distance in units of 10 kpc. The observed and unabsorbed 0.5–10 keV fluxes were and erg s-1cm-2, respectively. While a good fit was also found using a resonant cyclotron scattering model (Rea et al. 2008), a two-blackbody model was unsuccessful. The HXD results on the persistent emission will be reported elsewhere.
3.2. The powerful burst and its light curves
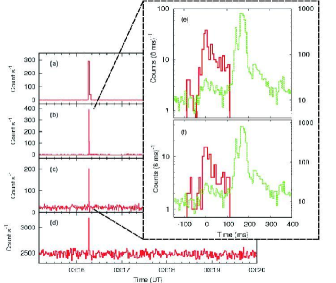
Among the 32 bursts detected by the XIS (§ 3.1), four were also detected by HXD-PIN, and three of them by HXD-GSO, all with significance. As shown in Figure 3 with a red arrow, the largest event on 2008 August 26 at 03:16:16.947 (UTC) was detected by all the Suzaku instruments, including the four HXD-WAM. It was also observed by the Konus-Wind instrument (Palmer 2008). The HXD-PIN and HXD-GSO light curves are rather similar with negligible relative delays (within ms), indicating that the spectrum is not significantly time-dependent.
The HXD-PIN signal intensity at the peak and that averaged over the ms duration are and counts per 8 ms, which translate to a source intensity of and Crab, respectively. Up to time 107 ms, these light curves are relatively free from instrumental dead times (), which have three components (Takahashi et al. 2007); processing times in the analog electronics (HXD-AE), the limited transfer rate from HXD-AE to the digital electronics (HXD-DE), and that from HXD-DE to the spacecraft data processor.
At 107 ms, the HXD signals suddenly terminated. This is an instrumental effect, caused by the second and third factors above, including a forced “flush” of an HXD-DE output buffer. The number of “lost” HXD events can be estimated from various scalar information. Over a 4-s interval including the burst, we found that HXD-PIN received photons, of which only , or 2%, were duly processed onboard and edited into the light curve. This fraction is similar in the HXD-GSO data, 2.7% (195 processed vs. 7164 received).
By comparing these Suzaku light curves with the Konus-Wind data (green in Fig. 3e and 3f), we found that the time history observed by the HXD is a “precursor” event. When the much stronger main burst began at ms, the HXD data became completely suppressed, until they returned to normal at ms. This is consistent with the main burst duration, s, recorded by Konus-Wind. The entire burst thus contained times more photons in the hard X-ray band than actually detected by the HXD.
In the XIS data, this burst was split into two readout frames of 2 s each. We accumulate the XIS data over the 4 s, which contains not only the precursor but also the large main peak (missed by the HXD). Around the XIS image centroid, the very high burst intensity caused strong event pile-up, and telemetry saturation which in turn caused some truncation of the XIS frame readout.
3.3. The burst spectra
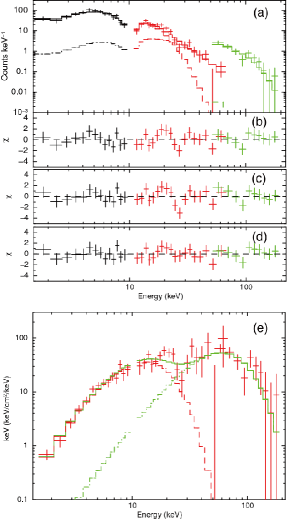
Figure 4a shows the spectra of the largest burst, where the ordinate is counts per unit energy (not divided by exposure). The HXD data were accumulated over a time interval of ms around the burst arrival time (see Figure 3). We subtracted the HXD-GSO background (22 count s-1, 50-250 keV) using a 400 s interval before and after the burst. The HXD-PIN background (0.56 count s-1, 10–70 keV) was negligible. Thus, the emission is detectable up to keV.
The XIS spectra in Figure 4a were accumulated from XIS-FI over the two frames containing the burst. Unlike the HXD data which cover only the precursor, the XIS events must be dominated by the main burst. To avoid the pile-up and readout truncation problems, we extracted the XIS 0 events using an annulus between radii of and , and XIS 3 events between and . The two XIS-FI cameras thus yielded 515 burst photons, among which pile-up events are estimated as 20%. We generated particular XIS ancillary response files that correctly reproduce the fraction of photons falling onto these limited accumulation regions.
To evaluate the precursor spectrum, we jointly fitted the HXD-PIN (10–70 keV) and the HXD-GSO (50–250 keV) spectra. The 1–10 keV XIS-FI data were also incorporated, assuming that the precursor has nearly the same spectrum as the much brighter main burst. To take into account the various uncertainties in the HXD and XIS data processing, we left relative model normalizations free between them. The interstellar absorption was fixed at cm-2 as specified by the persistent emission.
As shown in Figure 4, a model comprising two blackbodies (typical for magnetars bursts; e.g. Olive et a. 2004; Feroci et al. 2004; Nakagawa et al. 2007; Israel et al. 2008b; Esposito et al. 2008) reproduced the data fairly well with . The deconvolved spectra are shown in Figure 4e. The fit yielded two temperatures: keV and keV. Assuming spherical emission regions, the the cooler and hotter blackbodies are estimated to have radii of km and km, respectively. The average (over the 200 ms) and peak 1–200 keV fluxes of the precursor are and erg s-1 cm-2, respectively, and the corresponding fluence is erg cm-2. The total burst fluence is estimated to be times higher. The model normalization for the HXD data (PIN and GSO together) was of that of XIS-FI.
When a thermal Comptonization model, CompTT, is alternatively used, the fit becomes slightly worse (; Fig. 4c).
Although the above models are roughly successful for the burst spectrum, a hint of negative residuals is present at keV (Fig. 4b), where the two blackbodies cross over. Applying a Gaussian absorption (Gabs) or cyclotron absorption (Cyclabs) factor at keV, the fit was improved to (Fig. 4d). However, its addition is significant only at 1.9 level.
4. DISCUSSION
SGR 0501+4516 was observed by Suzaku four days after the burst activation at a flux level of (0.5–10 keV). The persistent 0.5–10 keV spectrum obtained with the XIS is described by a keV blackbody plus a power-law.
If the identification of SGR 0501+4516 with the ROSAT source 2RXP J050107.7+451637 (Kennea & Mangano 2008) is correct, the unabsorbed 0.2–10 keV flux increased by a factor with respect to the 1992 value (for a power-law model). Large spectral and flux variations have been recorded in other SGRs as well, in coincidence with the onset of phases of bursting activity. The two most active repeaters, SGR 180620 and, to a lesser extent, SGR 1900+14, are known to undergo rather gradual variations in luminosity and spectral properties. In fact, prior to the Giant Flare of 2004 December 27th (Hurley et al. 2005; Palmer et al. 2005), SGR 180620 exhibited a factor flux increase and a decrease in from to (Mereghetti et al. 2005). In the case of SGR 1900+14 in 2006, the spectral index went from to and the flux increased by (Israel et al. 2008b). In contrast, sources which experience long stretches of quiescence show much more dramatic changes. In May 2008, when SGR 162741 reactivated after more than 10 yrs, its switched from to , and the observed 2–10 keV flux increased by a factor of 40 (Esposito et al. 2008). While the luminosity increase in SGR 0501+4516 is not dissimilar to that of SGR 162741, while in outburst its persistent spectrum is much softer.
Among other short X-ray bursts from SGR 0501+4516, we detected a very powerful one, observed also by Konus-Wind (V. Palshin private communication 2008). The 1–200 keV precursor spectrum detected with the XIS and the HXD was fitted reasonably well by the two blackbody model. One possible interpretation of the two temperatures (3 keV and 15 keV) is that they represent the photospheres of the ordinary and extraordinary modes (Harding & Lai 2006; Israel et al. 2008b), which can have different radii and temperatures due to suppression of extraordinary-mode scattering and photon-splitting in the super-critical magnetic field.
References
- Barthelmy et al. (2008) Barthelmy, S. D., et al. 2008, GCN Circ., 8113, 1
- Dall’Osso et al. (2003) Dall’Osso, S., Israel, G. L., Stella, L., Possenti, A., & Perozzi, E. 2003, ApJ, 599, 485
- (3) Esposito, P., et al. 2008, MNRAS, 390, L34
- (4) Feroci, M., Caliandro, G. A., Massaro, E., Mereghetti, S., Woods, P. 2004, ApJ, 612, 408
- Göğüş et al. (2008) Göğüş , et al. 2008, The Astronomer’s Telegram, 1677
- Harding & Lai (2006) Harding, A. K., & Lai, D. 2006, Reports on Progress in Physics, 69, 2631
- Holland & Sato (2008) Holland, S. T., & Sato, G. 2008, GCNR, 160, 1-2
- Hurley et al. (2005) Hurley, K., et al. 2005, Nature, 434, 1098
- Israel et al. (2008a) Israel, G. L., et al. 2008a,The Astronomer’s Telegram,1692
- Israel et al. (2008b) Israel, G. L., et al. 2008b , ApJ, 685, 1114
- Kennea & Mangano (2008) Kennea, J. A., & Mangano, V. 2008, The Astronomer’s Telegram, 1675
- (12) Koyama, K. et al. 2007. PASJ 59, S23
- Mereghetti (2008) Mereghetti, S. 2008, A&A Rev., 15, 225
- Mereghetti et al. (2005) Mereghetti, S. et al. 2005, ApJ, 628, 938
- Mitsuda et al. (2007) Mitsuda, K. et al. 2007. PASJ 59, S1
- (16) Nakagawa, Y. E. et al. 2007, PASJ, 59, 653
- Olive i et al. (2004) Olive, J.-F. et al. 2004, ApJ, 616, 1148
- Ouyed et al. (2007) Ouyed, R., Leahy, D., & Niebergal, B. 2007, A&A, 473, 35
- Palmer (2008) Palmer, D. 2008, The Astronomer’s Telegram, 1683
- Palmer et al. (2005) Palmer, D. M. et al. 2005, Nature, 434, 1104
- (21) Rea, N., et al. 2008, ApJ, 686, 1245
- (22) Takahashi, T. et al. 2007. PASJ 59, S35
- (23) Thompson, C., & Duncan, R.C. 1995, MNRAS, 275, 255
- (24) Woods, P.M. & Thompson, C. 2006, Compact stellar X-ray sources. Ed. W. Lewin & M. van der Klis, Cambridge University Press