X-ray Absorption and Optical Extinction in the Partially Obscured Seyfert Nucleus in Mrk 1393
Abstract
We present a detailed study of the X-ray and optical spectra of the luminous Seyfert galaxy Mrk 1393, which revealed variable partial obscuration of the active nucleus. The X-ray spectra obtained by XMM-Newton and Swift show moderate absorption with a column density around 3 cm-2, consistent with a dust-reddening interpretation of the steep Balmer decrement seen in recent optical spectra. The X-ray flux in the 0.5 to 2 keV band during the XMM-Newton observation in 2005 and Swift observation in 2006 was a factor 6 brighter than that of the ROSAT All Sky Survey in 1991. In the past 4 years, the broad H line brightened by a factor of 4 accompanied by a decrease in the Balmer decrement. A comparison with literature spectra reveals variations in the dust extinction on time scales of several years, suggesting that the obscuring material is very close to the active nucleus. These observations indicate that a dust-to-gas ratio as high as the Galactic value can be present in moderately thick gas in the vicinity of the central engine within a few parsecs. We suggest that the obscuring material may be debris disrupted from the dusty torus.
1 Introduction
The unification scheme for type I and type II nuclei of Seyfert galaxies has been very successful in explaining various observational facts: detection of polarized broad emission lines in a significant fraction of Seyfert 2 galaxies, large X-ray absorption column densities and/or reflection dominated X-ray spectra in Seyfert 2 galaxies [e.g. 58], presence of ionization cone and a torus-like near-infrared image [45, 29]. However, we still do not understand the properties of the torus. Clumpy distribution is preferred by recent modeling of high resolution infrared image of nearby Seyfert galaxies and the infrared spectral energy distribution [e.g. 27], but yet little is known about the properties of dust clouds, such as their dust-to-gas ratio. Furthermore, it is highly controversy whether the subtending angle of dust torus varies with nuclear luminosity [53, 4, 25], [c.f., 43, 15, 62].
Partially obscured active galactic nuclei (AGNs) are ideal targets for exploring some of these questions. First, since the transmitted light can be directly measured, the estimation of the reddening/absorption column density is much more reliable than in type II quasars [e.g. 41]. This allows a reliable measurement of the dust-to-gas ratio of the obscuring material. The transmitted light also allows us to measure properly the nuclear properties [e.g., intrinsic nuclear variability, 13], and puts better constraints on the other parameters (such as the size of the broad emission line region). Second, optical and X-ray observations also show that at least some of these partially obscured AGNs display transitions from type 1.8/1.9 to 1.2/1.5 or vice-versa [e.g. 19]. Two different scenarios are proposed to explain these transitions: a continuum luminosity dependent Balmer decrement variation [e.g., 61, 55, 51], and the dust absorbing material moving in/out of line sight. Clearly, simultaneous X-ray and optical observation can give important constraints of these models. If the latter scenario is confirmed, these transitions carry important information of the distribution and kinematics of absorbing material.
We initiated a program to observe partially obscured AGNs and quasars in X-rays with the XMM-Newton Observatory [30]. The targets were selected from the Sloan Digital Sky Survey (SDSS, York et al. 2000) by their large Balmer decrements [13]. In this paper, we report of the detections of X-ray absorption and large variations of the Balmer decrement in one of these objects, Mrk 1393 (). The X-ray observations were performed by XMM-Newton and Swift. Mrk 1393 appears to be a partially obscured Seyfert galaxy due to its Balmer decrement as large as H/H measured from its SDSS spectrum. Mkn 1393 is a Seyfert 1 galaxy with prominent broad H [32], and is also included in the broad line AGN sample of Hao et al. (2005). The reddening corrected H luminosity of 1042 erg s-1 makes this AGN a borderline object between Seyferts and QSOs. It is also infrared luminous with and was detected by ROSAT in X-ray (Anderson et al 2003). With a radio flux of 23 mJy detected in the FIRST survey (Becker, White & Helfand 1995), it is formally radio loud with an (Ivezic et al. 2002). The paper is organized as follows: the X-ray data obtained by XMM-Newton and Swift are analyzed in §2. The optical spectroscopic observations and analysis are presented in §3. The properties of the obscuring material is discussed in §4. Throughout this paper, luminosities are calculated assuming a CDM cosmology with =0.27, =0.73 and a Hubble constant of =72 km s-1 Mpc-1, corresponding to a luminosity distance of D=236.2 Mpc to the galaxy.
2 Results from X-ray data
2.1 XMM-Newton and Swift observations and data reduction
Mrk 1393 was observed by XMM-Newton on 2005 July 20 with the EPIC PN [54] and MOS1+2 [57] for 4423s, 6565s, and 6570s, respectively. The PN and the MOS detectors were operated in full-frame mode with the thin filter. Due to some strong background flares at the beginning of the observation, part of the data had to be excluded from further analysis. After excluding the time intervals with a hard X-ray background ( keV) of more than 10 counts s -1, the net observing times are 4099s, 5324s, and 5335s for the PN, MOS-1, and MOS-2, respectively. The XMM-Newton data were reduced with XMMSAS 7.1.0. Only single and double events were used for the PN data analysis, and single to quadruple events for the MOS data analysis. Data were also selected with the quality flag set to FLAG=0. The source counts are extracted from a circular region with a radius of 90 around the source position. Background counts were accumulated in a circular region of the same radius close by. The net source count rates in the 0.2-10 keV band are 2.087 cts s-1 for the PN detector and 1.577 cts s-1 for MOS1+2 detectors, indicating that the data are not significantly affected by pileup. The light curves were binned in 100s bins. The X-ray spectra were rebinned using grppha version 3.0.0 with at least 20 counts per bin. The redistribution and auxiliary response matrices were created by the XMMSAS tasks rmfgen and arfgen, respectively.
During the XMM-Newton observation, Mrk 1393 was observed with the on-board Optical Monitor [OM; 44] with the UVM2 filter. The OM data were reduced with the XMMSAS task omichain. The measured UVM2 magnitude from the source list is M2=16.170.08 mag. Correcting for the Galactic reddening of =0.059 mag [50] results in M2=15.60 mag.
Mrk 1393 was observed by Swift [18] on 2005 September 10 for a total exposure time of 9.6 ks. The Swift-XRT [10] observation was performed in photon counting mode [26]. The event file of the observation was created by using the Swift analysis tool xrtpipeline version 0.11.4. Source photons were extracted in a circle with a radius of 47 centered on the source, and the background was selected from a source-free region with a radius of 188. Only single to quadruple events in the energy range of 0.3-10.0 keV were selected for further analysis. Source and background spectra were extracted from the event file by using XSELECT version 2.3. Spectra were rebinned within grppha 3.0.0 to have at least 20 photons per bin. The auxiliary response files were created by the Swift tool xrtmkarf. We used the response matrix version 010 with a grade selection 0-12. The data are not significantly affected by pileup due to the low count rate (0.2 cts s-1). The XRT light curve was created by a program in MIDAS111MIDAS = ESO’s Munich Image Data Analysis System having at least 200 photons per bin (see e.g. Nousek et al. 2006 for details).
In addition to the X-ray data, we also obtained photometry with the UV/Optical Telescope [UVOT; 49] in the UVM2 filter. Source photons were extracted from a circular region with r=5, and the background in an annulus around the source with an inner radius of 7 and an outer radius of 20222At the SDSS u-band, the radius containing 50% of Petrosian flux is about .. The UVOT tool uvotsource was used to determine the magnitudes and fluxes. We searched for UV variability in the individual segments of the observation and did not detect any. The average observed magnitude based on the co-added images is m mag (corresponding to a flux of ergs s-1 cm2 Å-1 corrected for Galactic reddening [50]. This value is consistent with the UVM2 OM magnitude of mag333For a comparison with the Swift-UVOT, the UVM2 OM magnitudes have to be adjusted by +0.30 mag [22, 23]., indicating no significant change in the UV flux between the XMM-Newton and Swift observations.
2.2 X-ray Spectral Analysis
The X-ray spectra are fitted by using XSPEC [1, v.12.3.1x]. Errors of derived parameters are quoted at =2.7. The Galactic HI column density in the direction of the source is 4.81020 cm-2 [31] and is always taken into account in all the spectral fits as listed in Table 1.
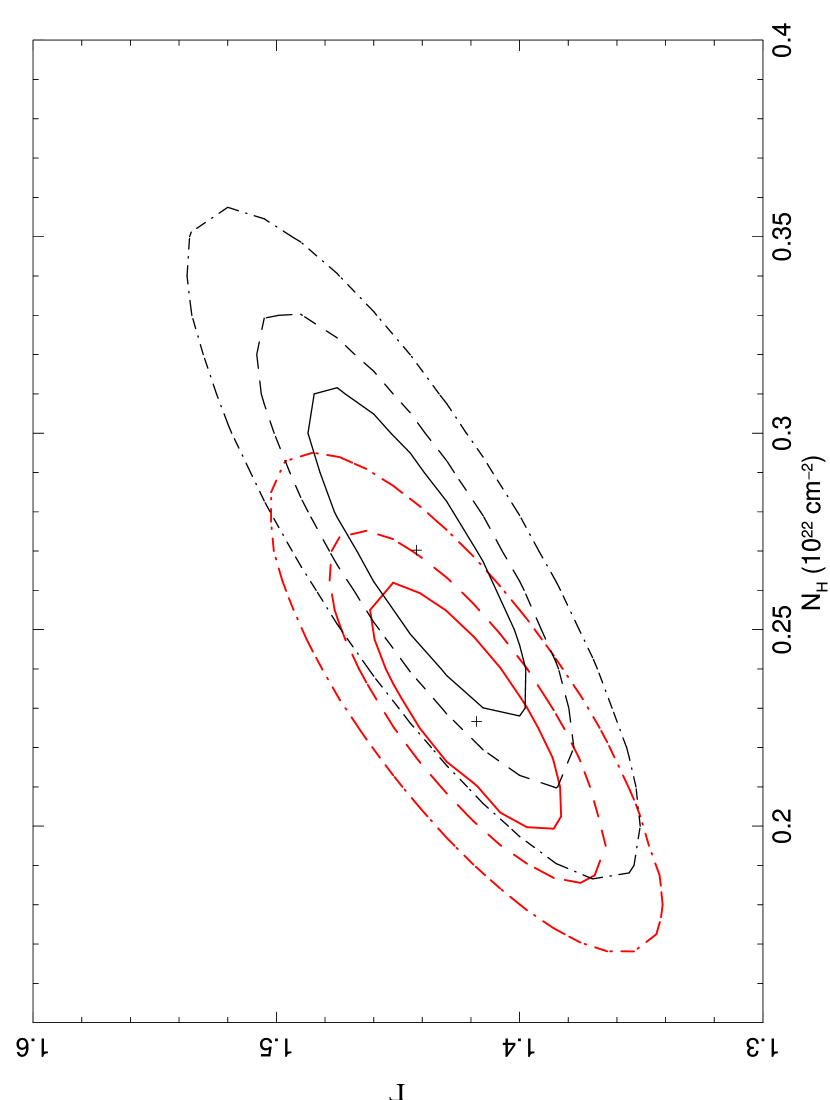
The XMM-Newton spectra in the 1-10 keV energy band can be fit by a power law model with additional intrinsic neutral absorption. The intrinsic absorption column density at the resdshift of the AGN is (2.40.6) 1021 cm-2. The X-ray spectrum in the range 1-10 keV is somewhat flat (), even for typical Seyfert 1 galaxies [e.g. 38, 21]. There is no apparent iron K line at the corresponding energy. The upper limit to a narrow ( keV) iron K line is 30 eV.
A flat spectrum may result either from partial covering absorption444Partial covering may be caused by a collection of absorbing blobs which are individually smaller than the X-ray emitting region, such as broad line emission clouds. or from strong reflection (reprocessing) [e.g. 16, 17, 23]. Here we examine both possibilities. A reflection model (pexrav in XSPEC) does not improve the fit, yielding a best fitted normalization of the reflection component of zero and an upper limit of (fixing the inclination to 45o and the metal abundance to the solar value). This is consistent with the upper limit derived from the equivalent width of the neutral iron line. An excess absorption and a flat photon index are still required, with the same values as the simple power law fit ( and 1021 cm-2). Neither does a partial covering model improve the fit. The covering fraction (0.4–1.0), though consistent with a full coverage, is poorly constrained, and so is the absorption column density ( cm-2). The photon index remains flat (). We thus conclude that the excess absorption and a flat continuum index inferred from the 1–10 keV spectra are caused by neither partial covering nor reflection.
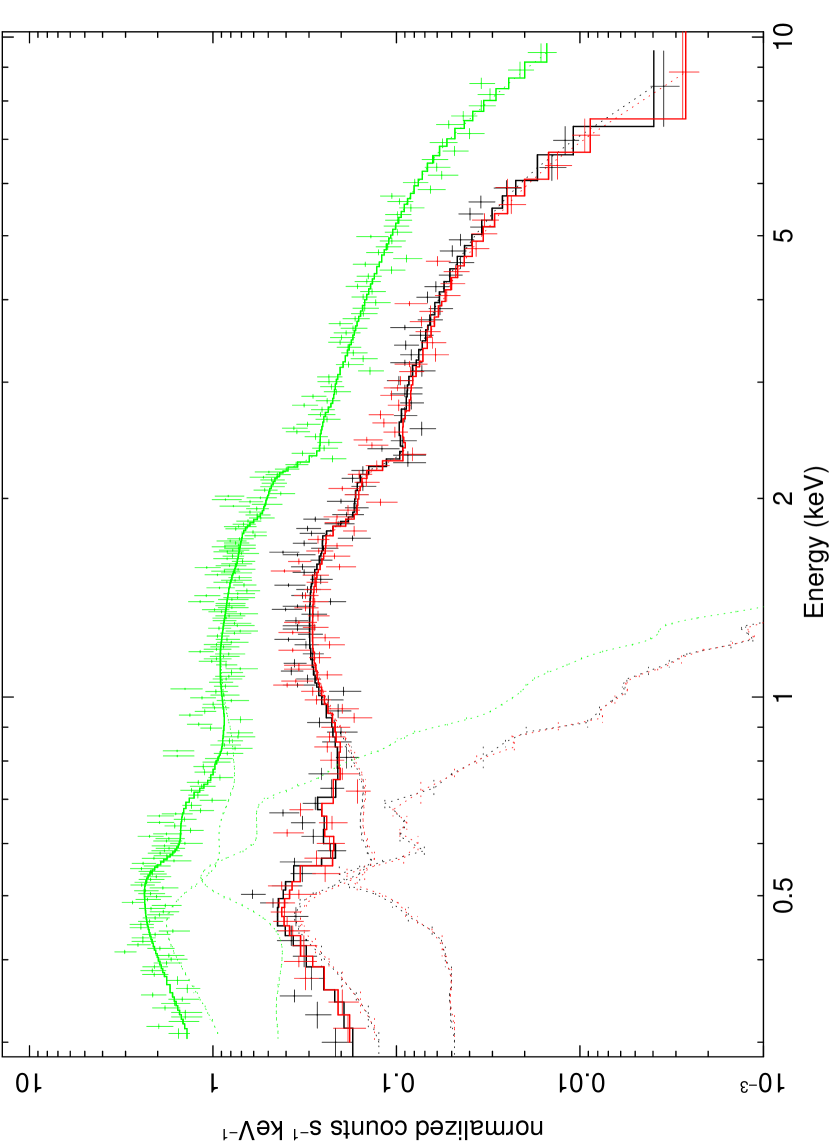
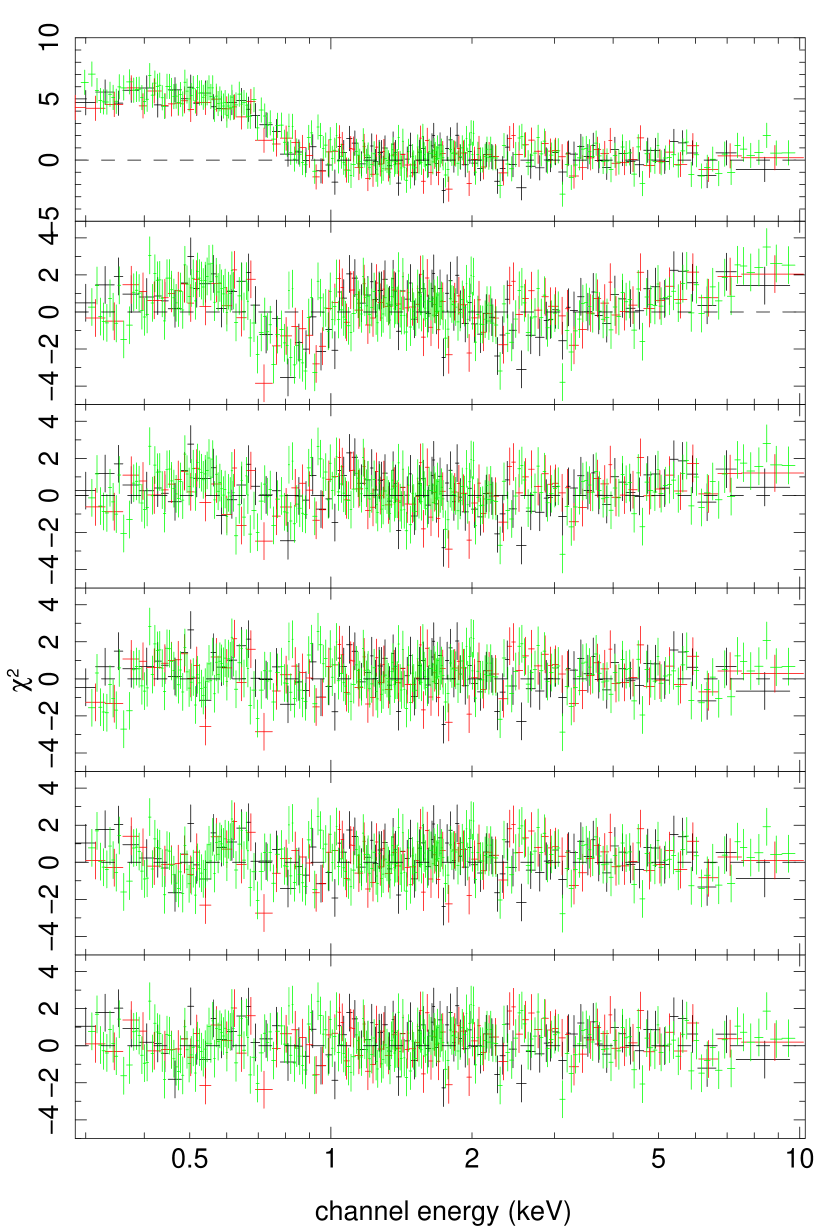
We now consider the whole 0.1–10 keV energy band. Extrapolating the 1–10 keV best-fit power law model down to lower energies under-predicts the soft X-ray flux by a factor of more than three below 0.6 keV, suggesting the presence of a possible strong soft X-ray excess. It is known that in some cases ionized absorption models can mimic soft excess (e.g., Komossa & Meerschweinchen 2000, Done et al. 2007). We first consider an ionized absorption model to examine this possibility. We fit the simple model absori available in XSPEC. This produces a marginally acceptable fit with a =703 for 652 d.o.f. (corresponding to a probability level of ). The absorber has moderate ionization (with an ionization parameter erg cm ) and is considerably thicker ( cm-2) than in the cold absorption model. The fit also yields significantly steep X-ray spectrum (). However, systematic deviations are still seen in the residuals both in 0.5 to 1.5 keV range and above 5 keV (see 1). The systematic deviations may be attributed partly because the absori model does not fully represent the spectrum, and partly to the multi-phase of the ionized absorber. In order to examine the latter possibility, we add a second absori to the model. This results in a for two more free parameters, and all systematical residuals below 2 keV disappear now. The two components have ionization parameters and , and column densities 5.4 1021 cm-2 and 2.6 1022 for ’low’ and ’high’ ionization phases, respectively.
Next, we consider the soft X-ray excess to be a real emission feature rather than induced by ionized absorption, and add a soft X-ray component in the spectral fit. Adding soft excess emission often causes degeneracy between the strength of soft excess and the amount of absorption. Since X-ray absorption is our main concern in this work, we focus the following analysis on detecting and measuring the amount of any possible X-ray absorption, by testing various spectral models of the soft excess, namely, black-body, ionized plasma, and power-law.
One of the common spectral shapes reproducing the soft X-ray excess emission in AGN is a black-body. We first test a power-law plus a black-body model, both absorbed by the same amount of (cold) absorption. However, the fit is hardly acceptable (), with a probability level of only . The fitted absorption column density and photon index are cm-2 and , respectively. We also use a broken power-law to account for the spectral steepening at the low energies, and find it unacceptable either, with .
Soft X-ray lines are commonly seen in Seyfert 2 and intermediate Seyfert galaxies, which is interpreted as arising from extended photoionized gas, such as the narrow line region (NLR). This component is less prominent in Seyfert 1 galaxies because of strong nuclear X-ray emission. In the case of Mrk 1393, however, this component may become prominent given the likely strong attenuation of the nuclear continuum below 1 keV (see above). Here we use a thermal plasma model (meka in XSPEC), which is a reasonable approximation of the spectrum of photoionized gas given the spectral resolution and signal-to-noise ratio of the current X-ray observations. We leave abundances and temperature as free parameters. Acceptable fits can be achieved only when the plasma emission is free from the excess absorption required for the power-law continuum. This is consistent with the plausible nature of as being extended emission. This model yields an acceptable fit with (), and a similar absorption column density cm-2, and a flat continuum , keV, and a low abundance of (see Table 1). The low abundance suggests that this component is dominated by continuum rather than emission lines. Thus, it raises a big concern for interpreting UT as from an photoionized gas 555Note that a similarly low abundance was obtained in a large number of other sources; for instance, one example is the Seyfert 2 galaxy NGC 5252 with thermal emission model [11]. This commonly seen effect is generally traced back to multiple components or non-equilibrium effects in the emitting plasma.. The total luminosity of this component is erg s-1 in 0.5–2.0 keV, higher than those of most Seyferts but comparable to the luminous extended X-ray emission in NGC 6240 (Komossa et al. 2003). This large soft X-ray luminosity we observe is unexpected because the [OIII] to soft X-ray flux ratio in Mrk 1393 is 20 times lower than the typical values found in Seyfert 2 galaxies [11]. So it is likely that this soft X-ray emission component in Mrk 1393 is diffuse, possibly contributed by photoionized gas (e.g. the inner NLR) and/or thermal gas, or scattered light of the continuum.
Though an absorbed power-law plus an unabsorbed meka component gives an acceptable fit, there are systematic residuals in the soft energy band, however. In fact, we find that adding a second soft X-ray component with the same absorption column density significantly improves the fit at low energies. Using a black body model as the (nuclear) soft X-ray component reduces the by for 1 more free parameter (643/649). The parameters of the best-fit are listed in Table 1, where the abundance of the meka model is fixed at the solar value. The solar abundance also ensures that this component can be interpreted as emission from photoionized gas. There are little changes in the column density ( cm-2) and the photon index (). For the plasma emission (meka) the temperature remains unchanged (0.167 keV), while its luminosity is reduced by compared to the previous value (2.6 erg s-1). Using a broken power-law model instead of the power-law plus blackbody model yields a similarly good fit and similar model parameters (see Table 1), with a luminosity of 2.2 erg s-1 in 0.5–2.0 keV band for the meka component.
Based on the above results, extensive fits with various plausible spectral models, we find that the amount of ’cold’ X-ray absorption is surprisingly robust, independent of the choice of spectral models in the soft X-ray band. We conclude that, for Mrk 1393, the excess ’cold’ X-ray absorption is inevitably required, and its measured column density is relatively insensitive to the choice of the spectral shape of the soft X-ray excess components. Both the soft excess and excess absorption can also be accounted by two-phased ionized absorption medium.
The SWIFT XRT spectrum has a lower signal-to-noise ratio compared to the XMM-Newton spectrum. We simply apply those best-fit models from the XMM-Newton data to the Swift spectrum. We find that all these models fit the Swift spectrum quite well, yielding almost the same model parameters as those derived from the XMM-Newton data. Therefore, the two spectra are well consistent with each other. In Table 1, we list results of only one of the best model fits for demonstration.
To summarize, the XMM-Newton spectrum requires intrinsic absorption of ‘cold’ gas with a column density cm-2. The power-law spectrum above 1 keV has a photon index of , marginally flatter than typical Seyfert 1 galaxies. An additional emission component, probably a combination of scattered light and emission lines from collisionally or photoionized gas, is inferred to be present with a luminosity of a few times erg s-1 in 0.5–2.0 keV and an equivalent temperature of 0.16 keV. These parameters do not vary much for the models considered here. Alternatively, a two phased ionized absorber may account for both the excessive absorption and the soft X-ray excess. The amount of ’low’ ionization phase medium is a factor of two larger than that in the cold absorption model.
2.3 X-ray variability
The XMM-Newton observation lasted less than 7 ks, during which no significant X-ray variability is found. To search for variability in the Swift observation covering 19 hr in total, the count rates are corrected according to the exposure maps to compensate losses induced when the source was positioned on bad CCD columns. The light curve (Fig 3) shows some variability on the order of 20% within an hour. The curve is rebined that each bin contains 100 counts. A -test gives for 11 degree of freedoms, which has a null probability of less 2. Furthermore, we also compare the average Swift fluxes in the 0.3-1.0 and 2.0-10.0 keV bands with the XMM-Newton measurements. The mean fluxes do not show any significant variability on month timescales.
Mrk 1393 was detected during the ROSAT All Sky Survey [RASS; 59] with a count rate of 0.0330.012 cts s-1 in the 0.1-2.4 keV band and a hardness ratio of HR1=(H-S)/(H+S)=0.730.43 with the H and S being the counts in the hard (0.5-2.0 keV) and the soft (0.1-0.4 keV) bands, respectively [60]. The observation was made between August 6 and August 8, 1991. For comparison, we estimate the ROSAT count rate for the best-fit XMM-Newton model using the ROSAT PSPCC response. The broken power-law plus meka model predicts an RASS count-rate of 0.189 cts s-1 in the 0.5-2.0 keV band. The power-law plus black body soft excess and meka model gives a very similar count-rate. With the observed hardness ratio and count-rate in the whole band, we estimate the observed RASS count rate in the 0.5-2.0 keV band to be 0.028 cts s-1. Therefore, the soft X-ray flux increased by a factor of 6 since the ROSAT observation if we ignore the inter-mission calibration uncertainty, which is estimated to be within 10% [52]. In passing, we note that the variation of intrinsic X-ray luminosity might be larger than this apparent value. Thermal plasma emission with similar temperatures has been observed in Seyfert 2 galaxies, which is emitted on relatively large scales, and is likely not variable on time scale less than ten years [e.g. 7]. The meka component alone predicts a ROSAT count rate in the band (0.5-2.0) keV of 0.027 cts s-1 with 15% uncertainty due to its normalization, very close to the observed RASS count-rate. If the meka component comes from the emission from the extended photoionized gas, it might be not variable. Thus the actual variability amplitude can be even larger.
3 Optical Observations and Emission Line Measurements
3.1 Spectra Obtained at Xinglong Station
The optical spectroscopic observations were made on September 4-5, 2005, and January 03-08, 2006 at Xinglong station, Beijing Astronomical Observatory (BAO). Low resolution spectra were taken with the OMR spectrograph mounted on the BAO 2.16 m telescope, using a Tektronix CCD as a detector. A 300 line mm-1 grating was used, blazed at 5200 Å for the 2005 September 04-05 and at 6000 Å for the 2006 January 03-08 runs, respectively. Two exposures of 60 minutes each were taken for each of the six nights at 2005 September 04-05, 2006 January03, 05, 07, and 08, and one exposure of 60 minutes each for each of the two nights at 2006 January 04 and 06. The seeing ranged from during the observations, and we used slit widths of for all of the observations when the seeing was less than , except for the three nights at 2006 January 03-05 when the seeing was the largest (). The resolution of the BAO spectra is Å FWHM as measured from the night-sky lines. The CCD reductions, including bias subtraction, flat-field correction, and cosmic-ray removal, were accomplished with standard procedures using IRAF. Wavelength calibration was carried out using Fe-He-Ar lamps taken at the beginning and the end of the observations. The accuracy of wavelength calibration was better than 1 Å. Flux calibration was derived with observation of a KPNO standard star, which was observed at the beginning and end of each run.
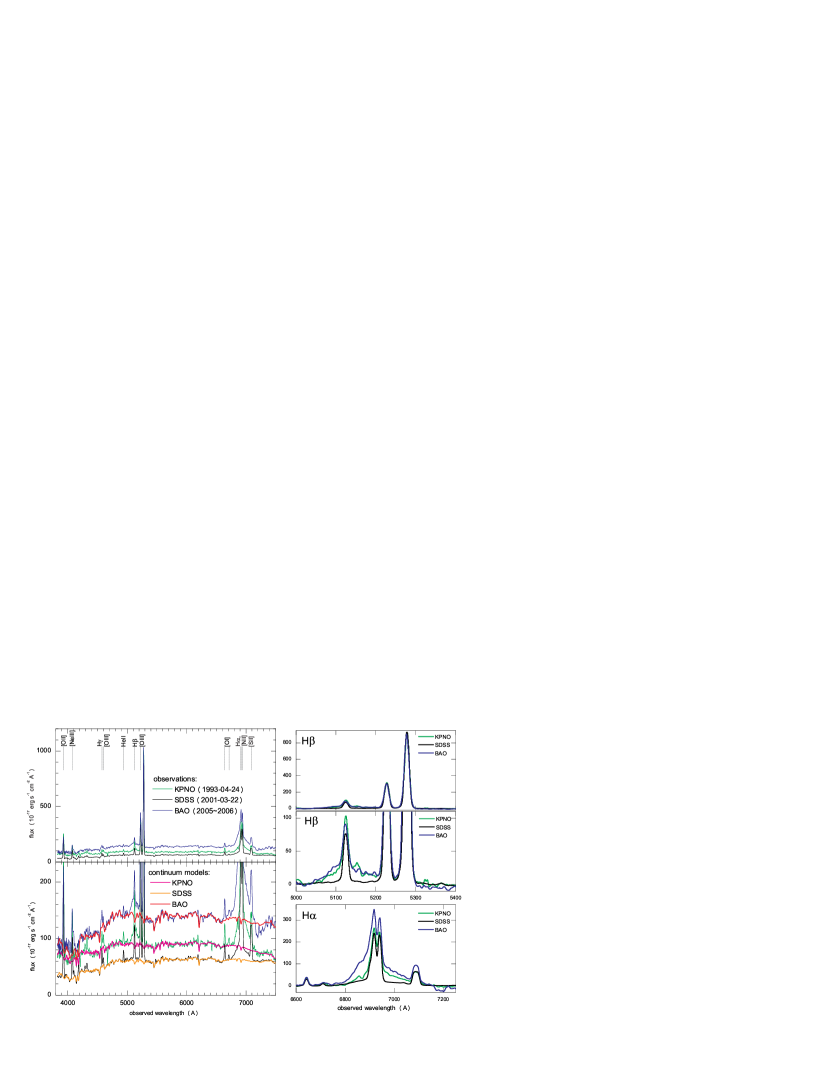
Spectra obtained in the four nights with the best weather condition (seeing ; 2005 September 04-05 and 2006 January 07-08) agree with each other within , indicating that 1) the uncertainty of our flux calibration is better than 10%, and 2) the source is not variable on short (intranight) and medium (a few months) time-scales. All of the spectra were corrected for the Galactic extinction and combined to increase S/N ratio. The result is displayed in Fig 4.
3.2 SDSS and Other Spectra
The SDSS spectrum of MRK 1393 was taken on 2001 March 22 with an exposure time of 3041 s and a spectral resolution of about [2]. The seeing during the exposure was around 22. We started with the 1-d spectrum, processed by the SDSS pipeline, and corrected it for the Galactic reddening. The spectrum is also shown in Fig 4. Broad H appears much weaker than in the BAO spectrum, and the broad H, which can be easily identified in BAO spectrum, can be hardly spotted in the original SDSS spectrum. The spectrum show prominent stellar absorption lines, such as CaII, HCN, MgIb, NaID, suggesting that the continuum is dominated by starlight.
A KPNO spectrum taken on 1993 April 24 was kindly provided by Owen [48]. The spectral resolution is 5.6 Å (FWHM). Owen et al. estimated that the effective aperture size of the 1-d spectrum is around in diameter with an uncertainty of less than 30%. The aperture includes about 95% of the AGN light (assuming a point-like source). The contribution of starlight should be comparable to that in the SDSS spectrum. While both spectral resolution and the signal-to-noise ratio of the KPNO spectrum are lower than the SDSS spectrum, major stellar absorption lines, such as CaII, MgIb, NaI can be easily identified (Fig 4).
Two more optical spectra can be found in the literature [32, 47, hereafter, MW88]. The spectrum taken in 1984 by MW88 shows prominent broad Balmer lines up to H and a moderately blue continuum, which is very different from the SDSS (2001) and the BAO (2005-2006) spectra. There is no observation time in the Kinman’s paper, though it must be taken before August 1981. These authors also listed the emission lines they measured.
3.3 Variations in the Continuum and Emission Lines
In order to compare the strengths of emission lines among different observations, we re-calibrated all the spectra using the [OIII]5007Å line flux, assuming it is not variable and the [OIII] emitting region is not spatially resolved. Constancy of [OIII] line flux over a time scale of ten years probably is a good approximation, however, the point-like source approximation for NLR is a concern. We noticed that the size (containing 98% line flux) of [OIII] emission line region for Mrk 1393 is 1 kpc or 0.”9, according to the scaling relation of Bennert et al. (2002). This size is smaller than the spatial resolution, but is still comparable to the seeing disk and the aperture size used for the spectrum extraction, thus we warn that the absolute flux of the broad emission line and continuum flux may have uncertainties of order of ten percent. The [OIII]5007 emission line flux measured from the stacked BAO spectrum is only of that measured from the SDSS spectrum. The difference can be ascribed most likely to the aperture effect. The average seeing disk during our observations was larger than that of the SDSS observation, while the apertures we adopted to extract 1-d BAO spectra are less than that for the SDSS spectrum (about for BAO vs. in diameter for SDSS). Assuming [OIII] is not variable over timescales of a few years, we multiply the BAO spectrum by a factor of 1.198 to match the [OIII] flux measured in the SDSS to spectrum. We note that the [OI], [SII] and [NII] fluxes are consistent with such a correction factor. The [OIII] flux measured in the KPNO spectrum is a factor of 3.3 higher than that in the SDSS spectrum, while the correction appears somewhat smaller in the blue part as suggested by [OII]3727 flux (3.0). This can be explained by either effects of differential atmospheric refraction or more extended [OII] emission region. We divide the spectrum by 3.3.
After recalibrating the fluxes, we convolved the SDSS and KPNO spectra with Gaussians to match the instrumental resolution of the BAO spectrum. These spectra are displayed in Fig. 4. It is evident that the strength of both the H and H broad lines varied significantly between different epochs, and the broad H line varied by an even larger factor, whereas all of the narrow emission lines remain constant (note that we used only [OIII]5007 as the calibrator). The continuum shapes and intensities of the three spectra also appear to be quite different. The continuum in the KPNO spectrum is only higher than that in the SDSS spectrum, while the overall shape of the former is significantly bluer than the latter; this is very likely due to different nuclear contributions and/or different nuclear continuum slopes.
The continuum modeling and emission line measurements were carried out in the way as described in detail in Zhou et al. [66] for the BAO, SDSS and KPNO spectra. The host galaxy starlight is subtracted using the templates constructed using the ICA method [40]. The nuclear component is described by a reddened power-law. The emission lines are modeled with Gaussians: one Gaussian for each of the narrow lines, and two Gaussians for each of the broad lines. We assumed that the H and H broad lines have the same redshifts and profiles. Bad pixels are masked in modeling the continuum and emission lines. This yields satisfactory fits to all the data. The SDSS spectrum can be fairly well modeled by starlight alone suggesting that the nuclear continuum is weak. In contrast, a reddened power-law component is required in the BAO and KPNO spectra.
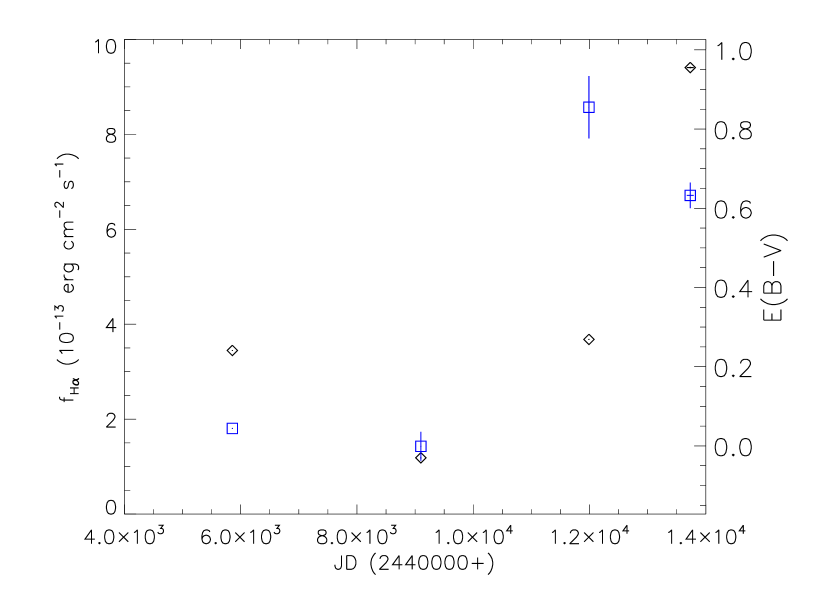
The Balmer decrement of the broad line component displayed large variations on time-scales of several years. We found, for the broad line component, H/H0.23 for the BAO spectrum (taken at the end of 2005 and early 2006), 7.690.73 for the SDSS spectrum (2001), and H/H for the KPNO spectrum (1993). We also estimated the broad line Balmer decrement to be 3.04 in 1984 using the integrated H and H line fluxes given by MW88, assuming a constant narrow H, H, [NII] line flux over ten years. This is rectified because all other narrow line fluxes quoted in MW88 are in good agreement with our measurement in the SDSS spectrum. The flat Balmer decrement is consistent with its blue continuum spectrum. The overall variation of the broad H flux and the intrinsic reddening estimated from the Balmer decrement are plotted in Fig. 5. The reddening is estimated from broad line Balmer decrement, assuming an intrinsic value of H/H=3.0 [13, 66, 14].
4 Discussion
4.1 A Reddening Origin for the Variable Balmer Decrement
Dong et al. (2008) showed that the Balmer decrements for blue quasars are in a very narrow range around 3.0 and do not correlate with either the continuum slope, Eddington ratio, or luminosity. Based on this and high luminosities in both the -band and [OIII] emission line, Dong et al. [13] argued that objects with steep Balmer decrements in their sample are intrinsically luminous objects reddened by dust. On the other hand, steepening of Balmer decrement when continuum dimming has been reported for individual objects [e.g., 61, 55]. Goodrich [19] argued that the variable Balmer decrement in some objects of their sample can be attributed to dusty clouds moving into/out of the line of sight.
The variable Balmer decrement in Mrk 1393 can be most naturally interpreted as variable extinction. First, X-ray absorption with a column density around 2 4 cm-2 by cold material, as expected, has been detected in this source when it showed a steep Balmer decrement of . Second, the observed broad H flux during the BAO observation in 2005-2006 with a steep Balmer decrement is very similar to that in 1984 when the Balmer decrement was normal, indicating that the steep Balmer decrement detected by BAO is not caused by continuum luminosity variations as observed during the lower state of NGC 5548. Also consistent with continuum extinction is the fact that Mrk 1393 displayed a blue continuum in 1984 when the Balmer decrement is normal, while all of the reddened spectra show a stellar dominated continuum. We note that the stellar dominated continuum in 1993 is likely due to the intrinsic weakness of the continuum, since the H broad line flux is about 4 times lower than in 1984.
Now that it has been established that the steep Balmer decrement in Mrk 1393 is caused by dust reddening, we can use the Balmer decrement to correct for the dust extinction. The extinction corrected broad H flux was the lowest in 1993 (at the KPNO observation), and the highest in the end of 2005 and early 2006 (during our BAO observations), giving the largest observed variation of a factor of 7.5. The intrinsic H flux was in between these values at the epoch of the 1984 observation Morris & Ward [47] and the 2001 SDSS observation (a factor of 1.9 and 2.1 higher than the lowest state, respectively). These broad H line flux variations do not correlate with the Balmer decrements. X-ray flux during the ROSAT observation in 1991 is a factor of six lower than in the end 2005 and early 2006, perhaps indicating the object was in a low state in the early 1990s. We suggest that Mrk 1393 is a good candidate for long-term monitoring. Because the Balmer decrement varies, as what was seen from 1993 though 2001 to 2006, the object could be an ideal laboratory for detailed studies of the physical and geometric properties of obscuring matter.
4.2 Dust-to-Gas Ratio of the obscuring gas
Since the BAO spectra were taken only one and half month after the XMM-Newton observation and nearly simultaneous with the Swift observation, it is reasonable to assume little or no variation for the BLR reddening on such short time scales. The quasi-simultaneity of the X-ray and optical observations enables us to derive the dust-to-gas ratio for the obscuring gas in Mrk 1393. Assuming an intrinsic H/H=3.0, the average value for blue quasars [14], Mrk 1393 was reddened by =0.59 during the BAO observations. The column densities derived from the X-ray absorption from the XMM-Newton and Swift data are around 2.0–3.61021cm-2 for different spectral models assuming solar abundances. We find a dust to gas ratio of mag cm2 if the absorber is cold. In the two phase ionized absorber model for X-ray spectrum, the column density of the low ionization material was found to be 5.41021cm-2, which gives a dust to gas ratio of 1.1 mag cm-2. These values are within a factor of two of the average Galactic value 1.7 mag cm-2[8]. Furthermore, the strong variability in reddening in Mrk 1393, as well as in several other intermediate Seyfert galaxies [19], warns against the use of non-simultaneous optical and X-ray data to derive the dust-to-gas ratio, at least for individuals.
As a comparison, the observed dust-to-gas ratios in other AGN show a large diversity. A class of (low- and high-luminosity) AGN has emerged which show relatively high optical-UV extinction, but lack a corresponding amount of (cold) X-ray absorption (e.g., Brandt et al. 1997, Komossa & Fink 1997b, Leighly et al. 1997, Komossa & Bade 1998). Three mechanisms have been proposed to account for these observations: (i) a higher-than-Galactic dust/gas ratio, (ii) a different grain-size distribution with a dominance of small grains, and (iii) dust mixed with absorbing material which is ionized rather than neutral (Komossa & Fink 1997b). In at least some 10 AGN the third solution is favored (see Komossa 1999 for a review). On the other hand, Maiolino et al. (2001) presented a sample of mostly luminous Seyfert galaxies which show indications for dust/gas ratios much lower than the Galactic value (by a factor 3-100). It is possible that the observed diversity of the dust to gas ratios in AGN can be reconciled by a combination of different obscuring components.
4.3 On the Nature of the Obscuring Gas
The obscuring material seen in Mrk 1393 must be very close to the AGN. By a comparison of the Balmer decrements of the broad and narrow components, Dong et al. [13] pointed out that the reddening of the NLR is much smaller than that of the BLR in most of the partially obscured quasars in their sample. The authors then suggested that the obscuring material lies in between the BLR and the NLR. The observed variations of the reddening set constraints to the size to an even smaller region in Mrk 1393. The object was not seriously reddened in 1993 (the KPNO observation) but was heavily reddened in 2001 (the SDSS observation) and 2005-2006 (the BAO observations). We interpret this as the obscuring matter moving into (1993-2001) and out of (2001-2006) the line-of-sight to the nucleus (both of the continuum source and the BLR), as dust condensation likely takes a much longer time in the vicinity of the galactic nucleus. The size of the BLR, estimated from the H line luminosity (reddening corrected) and the empirical versus H luminosity relationship, is 15 light days, following Wang & Zhang [63]. Using the revised relation given by Kaspi et al. (2006) results 19 light days. The obscuring material must cover most of the BLR, and thus the transverse velocity of the obscuring material must be not less than 1000 km s-1. With this transverse velocity, the absorber is unlikely much farther than a few parsecs away from the nucleus. As such, it may be part of the putative torus or even within it. If this is the case, our result suggests that a dust-to-gas ratio similar to the Galactic value can be found for gas located very close to the AGN. Matt [46] proposed that Compton thin Seyfert 2/1.8/1.9 galaxies are absorbed by dust lanes in their host galaxies. However, this is not the case for Mrk 1393.
Certain constraints on the gas properties can be inferred from the data. Assuming that the reddening variability is caused by a single cloud event and the cloud is quasi-spherical, we can set an upper-limit on the particle density of the cloud of the order of 106 cm-3, by using the X-ray absorption column density and a cloud size no less than the BLR size. Alternatively, if the cloud is pancake-like under the radiation pressure, the density of the gas can be higher. The cloud is unlikely self-gravitational bound because the tidal force of the central black hole exceeds the self-gravity of the cloud by 1–2 orders of magnitudes for the above estimated density, if the distance to the black hole is less than 10 pc. The disrupted cloud will have a filament structure and the low column density gas will be blown away due the strong AGN radiation pressure. Thus the material must be either transient or bounded by some external pressure against tidal disruption.
Instead of appealing to the unknown external pressure, the transient scenario is much more natural. One natural possibility is that the absorbing gas is debris disrupted from the dusty torus. The black hole mass of Mrk 1393 is estimated to be 5.5 10 7 M⊙ from the M relation 666 We measured a stellar velocity dispersion of 1595 km s-1 in the SDSS spectrum following the method of Lu et al. [40], which is consistent with 16315 km s-1 as given by Greene & Ho (2006). [e.g. 56], and 2 M⊙ from the above BLR size and the emission line width ( km s-1). The bolometric luminosity estimated from the observed hard X-ray luminosity (91043 ergs s-1) is about 0.100.37 of the Eddington luminosity, assuming a bolometric correction to the 2-10 keV X-ray luminosity of 30 [42]. Fabian et al. (2008) showed that the radiation force exceeds the gravity of a black hole for a dusty gas below the column density cm-2, when is the Eddington ratio. With , the measured X-ray column density in Mrk 1393 is much lower than this critical value, and thus the gas must be accelerated outward by the radiation force if the black hole is the only source of gravitational force. The masses of gas and stars within a few parsecs do not likely exceed that of the black hole by a large factor, so they are insufficient to prevent the outflow. Thus, the obscuring gas we are seeing is either formed in the inner nuclear region, or bound and shielded by thick material before it is exposed to the nuclear radiation. However, in the presence of a strong radiation field, it is unrealistic to form dust in relatively thin material within the inner parsecs. A plausible origin of the gas is thus debris disrupted from the dusty torus.
To summarize, our XMM-Newton and Swift observations detected significant X-ray absorption from cold gas with a column density of about cm-2 in the partially obscured luminous Seyfert galaxy Mrk 1393. Our semi-simultaneous BAO optical spectroscopic observations gave a steep Balmer decrement of . A combination of the X-ray and optical observations suggests that the steep Balmer decrement is caused by dust reddening, and the dust-to-gas ratio of the obscuring material is similar to the Galactic value. Incorporating the archived and literature data, we find variations in Balmer decrement on a time-scale of several years. Such variations require that the obscuring material locates within a few parsecs from the central nucleus. We suggest that the obscuring material may be debris evaporated/disrupted from the dusty torus. The source also displayed large amplitude X-ray variations of a factor 6 over 15 years.
References
- Arnaud [1996] Arnaud, K. A., 1996, ASP Conf. Ser. 101: Astronomical Data Analysis Software and Systems V, 101, 17
- Adelman-McCarthy et al. [2007] J. Adelman-McCarthy et al. 2007, ApJ Supplements, in press
- Anderson et al. [2003] Anderson, S. F., et al. 2003, AJ, 126, 2209
- Barger et al. [2005] Barger, A. J., Cowie, L. L., Mushotzky, R. F., Yang, Y., Wang, W.-H., Steffen, A. T., & Capak, P. 2005, AJ, 129, 578
- Becker, White & Helfand [1995] Becker, R. H., White, R.L., & Helfand, D.J., 1995, ApJ, 450, 559
- Bennert et al. [2002] Bennert
- Bianchi, Guainazzi, & Chiaberge [2006] Bianchi, S., Guainazzi, M., Chiaberge, M. 2006, å, 448, 499
- Bohlin et al. [1978] Bohlin, R. C., Savage, B. D., & Drake, J. F. 1978, ApJ, 224, 132
- Brandt et al. [1997] Brandt, W. N., Mathur, S., Reynolds, C. S., & Elvis, M. 1997, MNRAS, 292, 407
- Burrows et al. [2005] Burrows, D. N., et al., Space Sci. Rev., 120, 165
- Cappi et al. [1996] Cappi M., Mihara T., Matsuoka M., Brinkmann W., Prieto M.A., Palumbo G. 1996, ApJ, 456, 141
- Done et al. [2007] Done, C., Gierliński, M., Sobolewska, M., & Schurch, N. 2007, The Central Engine of Active Galactic Nuclei, 373, 121
- Dong et al. [2005] Dong, X.B., Zhou, H.Y., Wang, T.G., Wang, J.X., Li, C., & Zhou, Y.Y., 2005, ApJ, 620, 629
- Dong et al. [2008] Dong, X., Wang, T., Wang, J., Yuan, W., Zhou, H., Dai, H., & Zhang, K. 2008, MNRAS, 383, 581
- Eckart et al. [2006] Eckart M.E., Stern D., Helfand D.J., Harrison F. A., Mao P.H., Yost S.A. 2006, astro-ph/0603556
- Fabian et al. [1989] Fabian, A. C., Rees, M. J., Stella, L., & White, N. E. 1989, MNRAS, 238, 729
- Gallo et al. [2006] Gallo, L. C., Lehmann, I., Pietsch, W., Boller, T., Brinkmann, W., Friedrich, P., & Grupe, D. 2006, MNRAS, 365, 688
- Gehrels et al. [2004] Gehrels, N., et al., 2004, ApJ, 611, 1005
- Goodrich [1989] Goodrich R. W., 1989, ApJ, 340, 190
- Greene & Ho [2006] Greene, J., & Ho, L., 2006, ApJ, 641, L21
- Grupe et al. [2001] Grupe, D., Thomas, H.-C., & Beuermann, K., 2001, A&A, 367, 470
- Grupe et al. [2007] Grupe, D., Komossa, S., & Gallo, L.C., 2007, ApJ, 668, L111
- Grupe et al. [2008] Grupe, D. et al. 2008, ApJ, 681, 982
- Guainazzi et al. [2005] Guainazzi M., Matt G., Perola, G.C., 2005, å, 444, 119
- Hao et al. [2005] Hao, L,. et al. 2005, AJ, 129, 1795
- Hill et al. [2004] Hill, J.E., et al., 2004, SPIE, 5165, 217
- Hönig [2008] Hönig, S. F. 2008, Ph.D. Thesis
- Ivezic et al. [2002] Iveczic, Z. et al. 2002, AJ, 124, 2364
- Jaffe et al. [2004] Jaffe W. et al. 2004, Nature, 429, 47
- Jansen et al. [2001] Jansen, F., et al., 2001, A&A, 365, L1
- Kalberla et al. [2005] Kalberla, P. M. W., Burton, W. B., Hartmann, D., Arnal, E. M., Bajaja, E., Morras, R., Pöppel, W. G. L. 2005, A&A, 440, 775
- Kinman [1983] Kinman, T.D., 1983, MNRAS, 202, 53
- Komossa et al. [2003] Komossa, S., Burwitz, V., Hasinger, G., Predehl, P., Kaastra, J. S., & Ikebe, Y. 2003, ApJ, 582, L15
- Komossa & Bade [1998] Komossa, S., & Bade, N. 1998, A&A, 331, L49
- Komossa & Fink [1997a] Komossa, S., & Fink, H. 1997a, A&A, 327, 483
- Komossa & Fink [1997b] Komossa, S., & Fink, H. 1997b, A&A, 322, 719
- Komossa [1999] Komossa, S., in ASCA-ROSAT workshop on AGN, T. Takahashi, H. Inoue (eds), ISAS Report, p. 149
- Leighly [1999] Leighly, K.M., 1999, ApJS, 125, 317
- Leighly et al. [1997] Leighly, K. M., Kay, L. E., Wills, B. J., Wills, D., & Grupe, D. 1997, ApJ, 489, L137
- Lu et al. [2006] Lu H.L, Zhou H.Y., Wang J.X., Wang T.G., Dong, X.B., Zhuang Z., Li C., 2006, AJ, 131, 790
- Maiolino et al. [2001] Maiolino R., Marconi A., Salvati M., Risaliti G., Severgnini P., Oliva E., La Franca F., Vanzi, L., 2001, å, 365, 28
- Marconi et al. [2004] Marconi, A., Risaliti, G., Gilli, R., Hunt, L. K., Maiolino, R., & Salvati, M. 2004, MNRAS, 351, 169
- Martinéz-Sansigre et al. [2006] Martinéz-Sansigre, A., Rawlings S., Lacy M., Fadda D., Marleau F.R., Simpson C., Willott C.J., Jarvis M.J., 1006, AN, 317, 266
- Mason et al. [2001] Mason, K.O., et al., 2001, A&A, 365, L36
- Mason et al. [2006] Mason R.E., Geballe T.R., Packham C., Levenson N.A., Elitzur M., Fisher R.S., Perlman E., 2006, ApJ, 640, 612
- Matt [2000] Matt G., 2000, å, 358, 177
- Morris & Ward [1988] Morris S.L., Ward, M., 1988, MNRAS, 230, 639
- Owen, Ledlow, & Keel [1995] Owen, F., Ledlow, M. J., Keel, W.C., 1995,AJ, 109, 14
- Poole et al. [2008] Poole, T. S., et al., 2008, MNRAS, 383, 627
- Schlegel, Finkbeiner, & Davis [1998] Schlegel,D.J., Finkbeiner, D. & Davis, M., 1998,ApJ, 500, 525
- Shapovalova et al. [2004] Shapovalova, A. I., et al. 2004, A&A, 422, 925
- Snowden [2002] Snowden, S.L., 2002, astro-ph/0203311
- Steffen et al. [2003] Steffen A.T., Barger, A.J., Cowie L.J., Mushotzky R.F., Yang Y., 2003, ApJ, 596, L23
- Strüder et al. [2001] Strüder, L., et al., 2001, A&A, 365, L18
- Tran et al. [1992] Tran, H. D., Osterbrock, D. E., & Martel, A. 1992, AJ, 104, 2072
- Tremaine et al. [2002] Tremaine, S., et al., 2002, ApJ, 574, 740
- Turner e al. [2001] Turner, M.J., et al., 2001, A&A, 365, L27
- Veron-Cetty & Veron [2000] Veron-Cetty M.P. & Veron P., 2000, A&A Rev, 10, 81
- Voges et al. [1999] Voges, W., Aschenbach, B., Boller, T., et al., 1999, A&A, 349, 389
- Voges et al. [2000] Voges, W. et al. 2000, IAUC, 7432, 1
- Wamsteker et al. [1990] Wamsteker, W., et al. 1990, ApJ, 354, 446
- Wang et al. [2007] Wang, J. X., et al. 2007, ApJ, 657, 95
- Wang & Zhang [2003] Wang, T.G, & Zhang, X.G., 2003, MNRAS, 340, 793
- Ward et al. [1988] Ward, M. J., Done, C., Fabian, A. C., Tennant, A. F., & Shafer, R. A. 1988, ApJ, 324, 767
- York et al. [2000] York, D. G., et al. 2000, AJ, 120, 1579
- Zhou et al. [2006] Zhou, H., Wang, T., Yuan, W., Lu, H., Dong, X., Wang, J., & Lu, Y. 2006, ApJS, 166, 128

| model | k | /dof | |||||
|---|---|---|---|---|---|---|---|
| (1) | (2) | (3) | (4) | (5) | (6) | (7) | (8) |
| XMM-Newton 1-10 keV | |||||||
| 1 | 2.42 | 1.50 | 8.17 | 431/478 | |||
| XMM-Newton 0.3-10 keV | |||||||
| 2 | 3.02 | 1.53 | 8.12 | 0.166 | 5.69 | 667/650 | |
| 3 | 2.37 | 1.48 | 8.21 | 0.054 | 0.167 | 3.59 | 643/649 |
| 4 | 2.25 | 1.48 | 8.10 | 5.69 | 0.168 | 3.09 | 634/650 |
| Swift 1-10 keV | |||||||
| 1 | 3.3 | 1.58 | 7.5 | 34/51 | |||
| Swift 0.5-10 keV | |||||||
| 4 | 3.6 | 1.60 | 7.5 | 4.5 | 0.156 | 3.18 | 43/62 |
2 – a power-law absorbed by cold gas plus thermal plasma emission (meka in Xspec) 3 – a power-law and a black body absorbed by cold gas plus thermal plasma emission [ in XSPEC].
4 – a broken power-law absorbed by cold gas plus thermal plasma emission []