22institutetext: Dipartimento di Astronomia of the Università degli Studi di Trieste, via Tiepolo 11, I-34143 Trieste, Italy
33institutetext: Instituto de Astrofísica de Canarias, C/Vía Láctea s/n, E-38205 La Laguna (Tenerife), Canary Islands, Spain
44institutetext: INAF - Osservatorio Astronomico di Trieste, via Tiepolo 11, I-34143 Trieste, Italy
Internal dynamics of the galaxy cluster Abell 959
Abstract
Context. The connection of cluster mergers with the presence of extended, diffuse radio sources in galaxy clusters is still being debated.
Aims. We aim to obtain new insights into the internal dynamics of Abell 959, showing evidence of a diffuse radio source, analyzing velocities and positions of member galaxies.
Methods. Our analysis is based on redshift data for 107 galaxies in the cluster field acquired at the Telescopio Nazionale Galileo. We also use photometric data from the Sloan Digital Sky Survey (Data Release 6). We combine galaxy velocities and positions to select 81 galaxies recognized as cluster members and determine global dynamical properties. We analyze the cluster searching for substructures by using the weighted gap analysis, the KMM method and the Dressler–Shectman statistics. We also study the 2D galaxy distribution in the field of the cluster. We compare our results with those from X–ray and gravitational lensing analyses.
Results. We estimate a cluster redshift of . We detect an NE high velocity group at 5from the cluster center with a relative line–of–sight (LOS) velocity of km swith respect to the main system. We also detect a central, dense structure elongated along the SE–NW direction likely connected with the two dominant galaxies and their surrounding cores. This elongated central structure is probably the trace of an old cluster merger. The LOS velocity dispersion of galaxies is very high. By excluding the NE clump we obtain km sand a virial mass . Our results suggest that this cluster is forming along two main directions of mass accretion.
Conclusions. Abell 959 is confirmed to show the typical characteristics of radio clusters; i.e., it is very massive and shows a young dynamical state. However, deeper radio observations are needed to clarify the nature of the diffuse radio emission in Abell 959 and its connection with the cluster internal dynamics.
Key Words.:
Galaxies: clusters: individual: Abell 959 – Galaxies: clusters: general – Galaxies: distances and redshifts1 Introduction
In the hierarchical scenario for large–scale structure formation, clusters of galaxies are known to be unrelaxed structures. Instead, as the cosmic time flows clusters are interested by perturbing merging processes that constitute an essential ingredient of their evolution. Much progress has been made in the past decade in the observations of the signatures of merging processes (see Feretti et al. 2002b for a general review). A recent aspect of these investigations is the possible connection of cluster mergers with the presence of extended, diffuse radio sources: halos and relics. The synchrotron radio emission of these sources demonstrates the existence of large–scale cluster magnetic fields and of widespread relativistic particles. It has been suggested that cluster mergers provide the large amount of energy necessary for electron reacceleration up to relativistic energies and for magnetic field amplification (Feretti fer99 (1999); Feretti 2002a ; Sarazin sar02 (2002)). However, the precise radio halos/relics formation scenario is still being debated since the diffuse radio sources are quite uncommon and only recently can we study these phenomena on the basis of sufficient statistics (few dozen clusters up to , e.g., Giovannini et al. gio99 (1999); see also Giovannini & Feretti gio02 (2002); Feretti fer05 (2005)).
There is growing evidence of the connection between diffuse radio emission and cluster merging based on X–ray data (e.g., Böhringer & Schuecker boh02 (2002); Buote buo02 (2002)). Studies based on a large number of clusters have found a significant relation between the radio and the X–ray surface brightness (Govoni et al. 2001a , 2001b ) and connections between the presence of radio–halos/relics and irregular and bimodal X–ray surface brightness distribution (Schuecker et al. sch01 (2001)).
Optical data are a powerful way to investigate the presence and the dynamics of cluster mergers (e.g., Girardi & Biviano gir02 (2002)), too. The spatial and kinematical analysis of member galaxies allow us to detect and measure the amount of substructures and to identify and analyze possible pre–merging clumps or merger remnants. This optical information is really complementary to X–ray information since galaxies and intracluster medium react on different time scales during a merger (see, e.g., numerical simulations by Roettiger et al. roe97 (1997)). In this context we are conducting an intensive observational and data analysis program to study the internal dynamics of radio clusters by using member galaxies. Our program concerns both massive clusters, where diffuse radio emissions are more frequently found (e.g., Girardi et al. gir08 (2008) and refs. therein), and low–mass galaxy systems (Boschin et al. bos08 (2008)111please visit the web site of the DARC (Dynamical Analysis of Radio Clusters) project: http://adlibitum.oat.ts.astro.it/girardi/darc.).
During our observational program we conducted an intensive study of the cluster Abell 959 (hereafter A959). It is a fairly rich, X–ray luminous, hot and massive Abell cluster: Abell richness class (Abell et al. abe89 (1989)); (0.1–2.4 keV)=13.25 erg s-1 (Popesso et al. pop04 (2004), but correcting for our , see below); keV (ASCA data, Mushotzky & Scharf mus97 (1997)); a projected 2D aperture mass within a radius of 440″ (Dahle et al. dah02 (2002), in their cosmology).
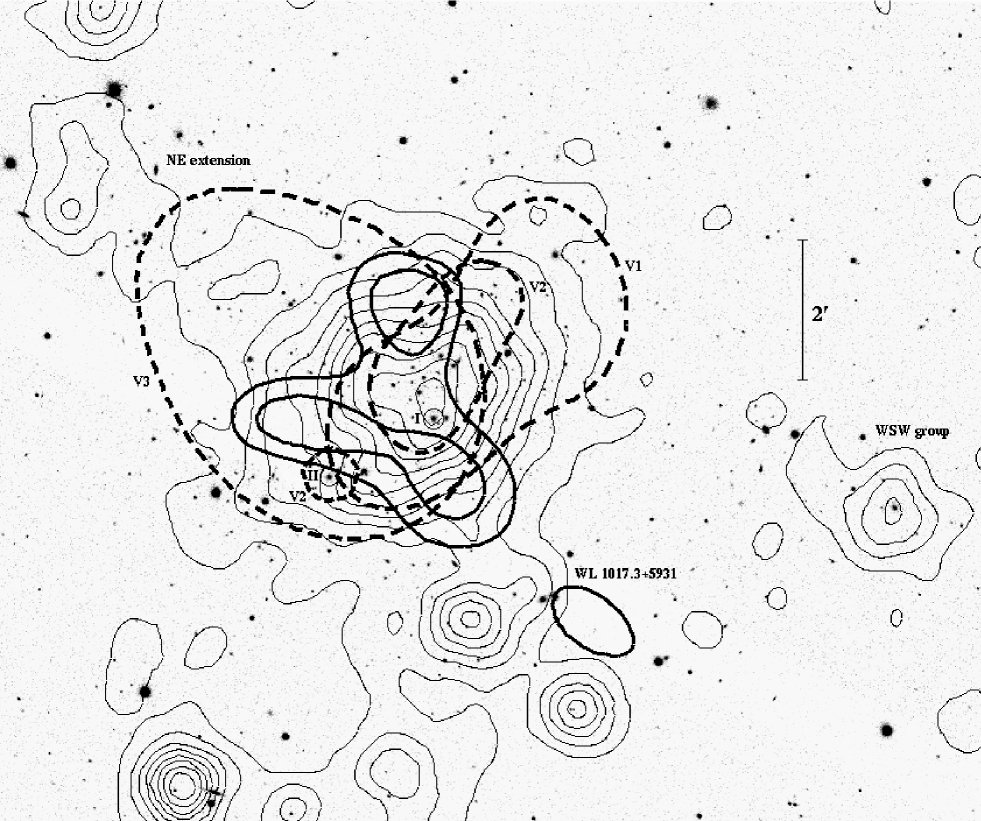
Optically, the cluster center is not dominated by any single galaxy – it is classified as Bautz–Morgan class III (Abell et al. abe89 (1989)) – but it has a core region consisting of many early–type galaxies of similar brightness (Dahle et al. dah02 (2002)). The general SE–NW elongation of the A959 cluster galaxy distribution is matched in X–rays (ROSAT/PSPC data; Dahle et al. dah03 (2003)). Perpendicularly, the NE–SW direction is defined by a clear NE external extension and a likely SW extension in the X–ray emission (Dahle et al. dah03 (2003)) and by a possible very central bimodal structure (Ota & Mitsuda ota04 (2004)).
A highly significant mass peak (with some evidence of substructure) is seen in the weak lensing mass map (Dahle et al. dah02 (2002); dah03 (2003)), and the mass distribution again indicates two directions for the cluster elongation (SE–NW and NE–SW) roughly resembling the galaxy light distribution, although the agreement is not perfect in the central region (see Fig. 1 for a multiwavelength view of this cluster). Moreover, there is a dark matter concentration at 6SW of the cluster center, which does not correspond to any peak in the luminosity distribution and is connected by a mass bridge with A959 (WL 1017.3+5931). To date the nature of this object is unknown and WL 1017.3+5931 remains a good candidate for an optically “dark” subcluster (Dahle et al. dah03 (2003)).
The presence of a radio extended emission in A959 has been reported by Cooray et al. (coo98 (1998)). Owen et al. (owe99 (1999)) lists A959 among clusters showing a detectable diffuse radio source with a flux density of 3 mJy (at 1.4 GHz) and a size of 3′(0.8 Mpc in our cosmology). The measurements of this preliminary study are rough and more observations of this radio source are needed to clarify the possible connection with the cluster. However, we note that this source shows the typical sizes of radio halos and radio relics/gischt (see Kempner et al. kem04 (2004); Ferrari et al. fer08 (2008)). Moreover, its radio power (11024 W/Hz) closely matches the relation log(1.4 GHz) – log found by Cassano, Brunetti & Setti (cas06 (2006); see their Fig. 3b) for radio halos.
Poor spectroscopical data exist for A959. The value usually quoted in the literature for the cluster redshift is , but Irgens et al. (irg02 (2002)) determined using four galaxies. We carried out spectroscopic observations at the Telescopio Nazionale Galileo (TNG) giving new redshift data for 107 galaxies in the field of A959 and finding .
This paper is organized as follows. We present our new spectroscopical data and the cluster catalog in Sect. 2. We present our results about the cluster structure in Sect. 3. We briefly discuss our results and give our conclusions in Sect. 4.
Unless otherwise stated, we give errors at the 68% confidence level (hereafter c.l.). Throughout this paper, we use km s-1 Mpc-1 in a flat cosmology with and . In the adopted cosmology, 1corresponds to kpc at the cluster redshift.
2 New data and galaxy catalog
Multi–object spectroscopic observations of A959 were carried out at the TNG telescope in December 2006. We used DOLORES/MOS with the LR–B Grism 1, yielding a dispersion of 187 Å/mm, and the Loral CCD of pixels (pixel size of 15 m). This combination of grating and detector results in a dispersion of 2.8 Å/pix. We observed four MOS masks for a total of 130 slits. We acquired three exposures of 1800 s for each mask. Wavelength calibration was performed using helium–argon lamps. Reduction of spectroscopic data was carried out with the IRAF 222IRAF is distributed by the National Optical Astronomy Observatories, which are operated by the Association of Universities for Research in Astronomy, Inc., under cooperative agreement with the National Science Foundation. package.
Radial velocities were determined using the cross–correlation technique (Tonry & Davis ton79 (1979)) implemented in the RVSAO package (developed at the Smithsonian Astrophysical Observatory Telescope Data Center). Each spectrum was correlated against six templates for a variety of galaxy spectral types: E, S0, Sa, Sb, Sc, Ir (Kennicutt ken92 (1992)). The template producing the highest value of ; i.e., the parameter given by RVSAO and related to the signal–to–noise of the correlation peak, was chosen. Moreover, all spectra and their best correlation functions were examined visually to verify the redshift determination. The median value of of our successfully measured galaxy redshifts is . In 4 cases (IDs 76, 79, 84, and 90; see Table 1) we took the EMSAO redshift as a reliable estimate of the redshift. Our spectroscopic survey in the field of A959 consists of 119 spectra with a median nominal error on of 56 km s-1. The nominal errors as given by the cross–correlation are known to be smaller than the true errors (e.g., Malumuth et al. mal92 (1992); Bardelli et al. bar94 (1994); Ellingson & Yee ell94 (1994); Quintana et al. qui00 (2000)). Double redshift determinations for the same galaxy allowed us to estimate real intrinsic errors in data of the same quality taken with the same instrument (Barrena et al. 2007a , 2007b ). Here we applied a similar correction to our nominal errors; i.e., hereafter we assume that true errors are larger than nominal cross–correlation errors by a factor 1.4. Thus the median error on is 78 km s-1.
We also used public photometric data from the Sloan Digital Sky Survey (SDSS, Data Release 6). In particular, we used , , magnitudes, already corrected for the Galactic extinction, and considered galaxies within a radius of 30from the cluster center. Our spectroscopic sample is 70% complete down to within 4′ from the cluster center.
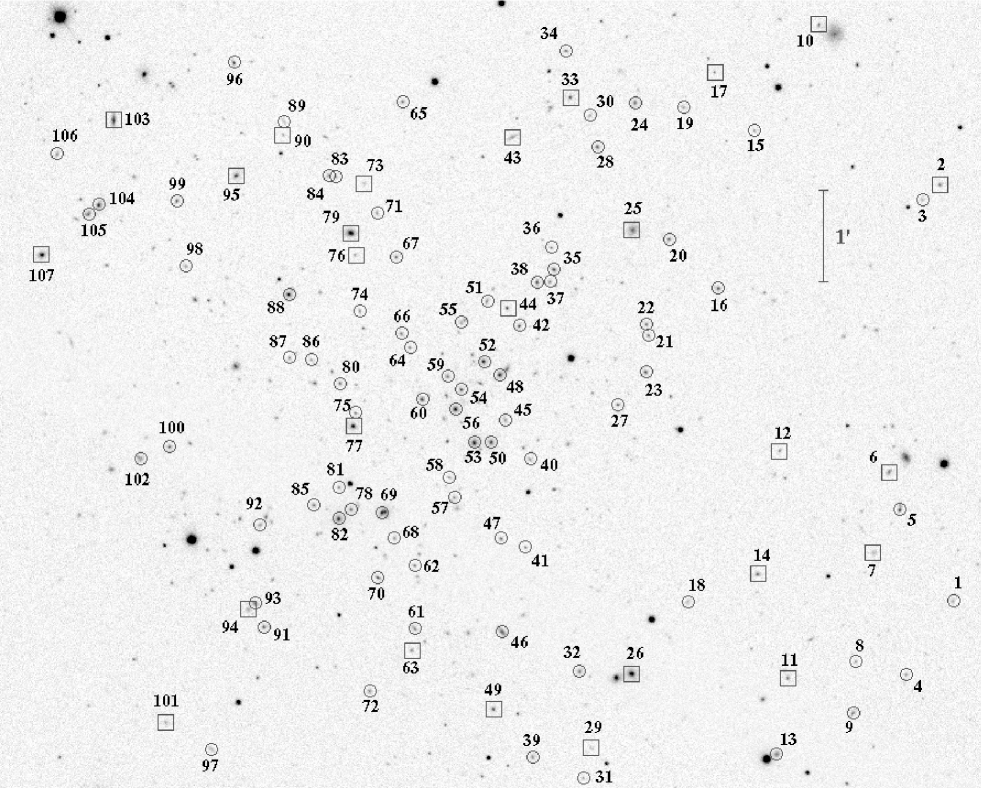
Table 1 lists the velocity catalog (see also Fig. 2): identification number of each galaxy, ID (Col. 1); right ascension and declination, and (J2000, Col. 2); SDSS magnitudes (Col. 3); heliocentric radial velocities, (Col. 4) with errors, (Col. 5).
-
a
IDs in italics indicate non–cluster galaxies. Galaxy IDs. 53 and 82 (in boldface) indicate the first and the second dominant galaxies of the cluster (I and II; see text), respectively.
-
b
A visual inspection of the SDSS image suggests that the magnitude of galaxy ID 69 listed in the SDSS catalog is incorrect, possibly due to the contamination of a very close galaxy. We recompute the of ID 69 and present our estimate here.
3 Analysis and results
3.1 Member selection and global properties
To select cluster members out of 107 galaxies having redshifts, we follow a two–steps procedure. First, we perform the 1D adaptive–kernel method (hereafter DEDICA, Pisani pis93 (1993) and pis96 (1996); see also Fadda et al. fad96 (1996); Girardi et al. gir96 (1996); Girardi & Mezzetti gir01 (2001)). We search for significant peaks in the velocity distribution at 99% c.l.. This procedure detects A959 as a peak at populated by 94 galaxies considered as candidate cluster members (see Fig. 3). Out of 13 non members, nine and four are foreground and background galaxies, respectively.


All the galaxies assigned to the A959 peak are analyzed in the second step, that uses the combination of position and velocity information: the “shifting gapper” method by Fadda et al. (fad96 (1996)). This procedure rejects galaxies that are too far in velocity from the main body of galaxies and within a fixed bin that shifts along the distance from the cluster center. The procedure is iterated until the number of cluster members converges to a stable value. Following Fadda et al. (fad96 (1996)) we use a gap of km s– in the cluster rest frame – and a bin of 0.6 Mpc, or large enough to include 15 galaxies.
The choice of the cluster center is not obvious. No evident dominant galaxy is present, but rather there are two luminous galaxies (IDs. 53 and 82, hereafter I and II dominant galaxies) defining the SE–NW direction already shown by X–rays (Dahle et al. dah03 (2003)). Moreover, the gravitational lensing analysis brings out several mass peaks (Dahle et al. dah03 (2003)). As the cluster center, hereafter we assume the position of the peak of X–ray emission as listed by Popesso et al. (pop04 (2004)) [R.A.=, Dec.= (J2000.0)] which is very close to the I dominant galaxy. After the “shifting gapper” procedure, we obtain a sample of 81 fiducial cluster members (see Fig. 4).
The 2D galaxy distribution analyzed through the 2D DEDICA method only shows one peak [at R.A.=, Dec.= (J2000.0)], which is very close to the I dominant galaxy (ID. 53), too. Using this alternative cluster center, we verify the robustness of our member selection obtaining the same sample of fiducial members as above.
By applying the biweight estimator to the 81 cluster members (Beers et al. bee90 (1990)), we compute a mean cluster redshift of 0.0004, i.e. 130 km s-1. We estimate the LOS velocity dispersion, , by using the biweight estimator and applying the cosmological correction and the standard correction for velocity errors (Danese et al. dan80 (1980)). We obtain km s-1, where errors are estimated through a bootstrap technique.
To evaluate the robustness of the estimate, we analyze the velocity dispersion profile (Fig. 5). The integral profile is roughly flat suggesting that the value of is quite robust. However we notice a slight increasing in the external cluster regions confirmed by the behavior of the differential velocity dispersion profile that increases, rather than decreases, going to larger and larger radii. The enhancement is likely due to the NE structure we detect and discuss in the following section. A more reliable estimate of the global then seems the value within 0.8 Mpc where km s-1.

Making the usual assumptions (cluster sphericity, dynamical equilibrium and galaxy distribution tracing the mass distribution), we can compute global virial quantities using our estimate of . Following the prescriptions of Girardi & Mezzetti (gir01 (2001)), we assume for the radius of the quasi–virialized region Mpc – see their Eq. 1 after introducing the scaling with (see also Eq. 8 of Carlberg et al. car97 (1997) for ). Thus the cluster is sampled out to a large fraction of . We compute the virial mass (Limber & Mathews lim60 (1960); see also, e.g., Girardi et al. gir98 (1998)):
| (1) |
where SPT is the surface pressure term correction (The & White the86 (1986)), and is a projected radius (equal to two times the projected harmonic radius). The value of depends on the size of the sampled region and possibly on the quality of the spatial sampling (e.g., whether the cluster is uniformly sampled or not). On the whole cluster region sampled out to 1.48 Mpc, we compute Mpc. The value of SPT strongly depends on the radial component of the velocity dispersion at the radius of the sampled region and could be obtained by analyzing the velocity–dispersion profile, although this procedure would require several hundred galaxies. By combining data on many clusters sampled out to about a typical value of SPT is obtained (Carlberg et al. car97 (1997); Girardi et al. gir98 (1998)). We assume the same correction for A959. Thus, we obtain .
Since A959 is not sampled out to and the sample is not magnitude complete we decide to use an alternative estimate of based on the knowledge of the galaxy distribution. Following Girardi et al. gir98 (1998) (see also Girardi & Mezzetti gir01 (2001)), we assume a King–like distribution with parameters typical of nearby/medium–redshift clusters: a core radius and a slope–parameter ; i.e., the galaxy volume density at large radii goes as . We obtain Mpc, where a error is expected (Girardi et al. gir98 (1998)). We obtain , which rescaled using the above model gives , in good agreement with the direct mass estimate given in the previous paragraph.
3.2 Velocity distribution
We analyze the velocity distribution to look for possible deviations from Gaussianity that might provide important signatures of complex dynamics. For the following tests the null hypothesis is that the velocity distribution is a single Gaussian.
We estimate three shape estimators, i.e. the kurtosis, the skewness, and the scaled tail index (see, e.g., Beers et al. bee91 (1991)). According to the value of the kurtosis (2.319), the velocity distribution is light–tailed and marginally differs from a Gaussian at the c.l. (see Table 2 of Bird & Beers bir93 (1993)).
Then we investigate the presence of gaps in the velocity distribution. A weighted gap in the space of the ordered velocities is defined as the difference between two contiguous velocities, weighted by the location of these velocities with respect to the middle of the data. We obtain values for these gaps relative to their average size, precisely the midmean of the weighted–gap distribution. We look for normalized gaps larger than 2.25, since in random draws of a Gaussian distribution they arise at most in about of the cases, independent of the sample size (Wainer and Schacht wai78 (1978); see also Beers et al. bee91 (1991)). We detect two significant gaps (at the c.l.) that separate the main cluster in three groups of 20, 37 and 24 galaxies (see Fig. 6), hereafter named V1, V2, and V3, respectively (see Table 2 for their main kinematical properties).

-
a
We use the biweight estimator and the gapper estimator by Beers et al. (1990) for samples with or , respectively (see Girardi et al. gir93 (1993)).
-
b
The estimate of should be considered a lower limit in these samples since the membership assignment might lead to an artificial truncation of the tails of the velocity distributions (e.g., Bird bir94 (1994)).
When compared two by two through the 2D Kolmogorov–Smirnov test (Fasano & Franceschini fas87 (1987)), these groups differ in spatial distribution: the V1 group marginally differs both from the V2 and V3 groups (at the and c.l., respectively); the V2 group differs from the V3 group (at the c.l.). In particular, the V2 group forms a dense elongated group around the cluster center and hosts both dominant galaxies. The V3 galaxies are mostly located in the northeastern part of the sampled region. For each of the these groups, Fig. 7 shows the spatial distribution of galaxies. The contours of the three galaxy distributions as recovered using the 2D DEDICA method (one for each distribution) are shown in Fig. 1. The V1 and V2 groups define the SE–NW direction and, in particular, the V2 group shows a bimodal 2D distribution where the two peaks correspond to the two dominant galaxies. The V3 group defines the NE–SW direction.

Finally, we notice that the luminous galaxies are preferentially located in the V2 group tracing, in particular, the cluster core. When comparing the magnitude distribution of V2 galaxies with that of V1+V3 galaxies, we find a difference at the c.l. according to the 1D Kolmogorov–Smirnov test (see, e.g., Ledermann led82 (1982)).
3.3 “3D” substructure analysis
The existence of correlations between positions and velocities of cluster galaxies is a footprint of real substructures. Here we use different approaches to analyze the structure of A959 combining velocity and position information.
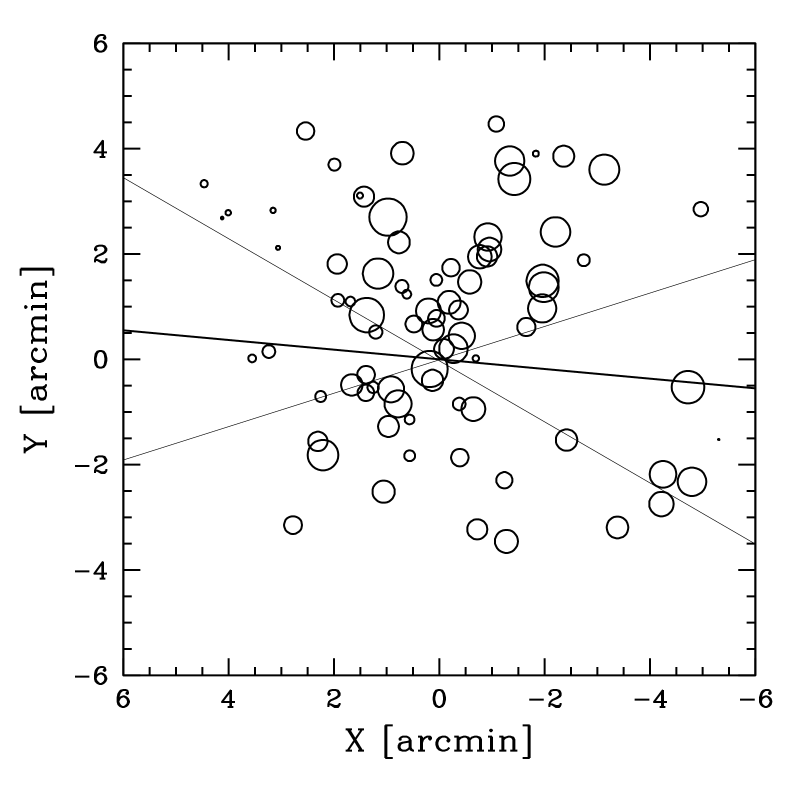
We analyze the presence of a velocity gradient performing a multiple linear regression fit to the observed velocities with respect to the galaxy positions in the plane of the sky (e.g, Boschin et al. bos04 (2004) and refs. therein). We find a position angle on the celestial sphere of degrees (measured counter–clockwise from north), i.e. higher–velocity galaxies lie in the western region of the cluster (see Fig. 8). To assess the significance of this velocity gradient, we perform 1000 Monte Carlo simulations by randomly shuffling the galaxy velocities, and for each simulation we determine the coefficient of multiple determination (, see e.g., NAG Fortran Workstation Handbook nag86 (1986)). We define the significance of the velocity gradient as the fraction of times in which the of the simulated data is smaller than the observed . We find that the velocity gradient is significant at the c.l..
We combine galaxy velocity and position information to compute the –statistics devised by Dressler & Shectman (dre88 (1988)). This test is sensitive to spatially compact subsystems that have either an average velocity that differs from the cluster mean or a velocity dispersion that differs from the global one, or both. We find for the value of the parameter that gives the cumulative deviation. This value is a significant indication of substructure (at the c.l.) as assessed by computing 1000 Monte Carlo simulations, randomly shuffling the galaxy velocities. Figure 9 shows the distribution on the sky of all galaxies, each marked by a circle: the larger the circle, the larger the deviation of the local parameters from the global cluster parameters, i.e. the greater the evidence for substructure.

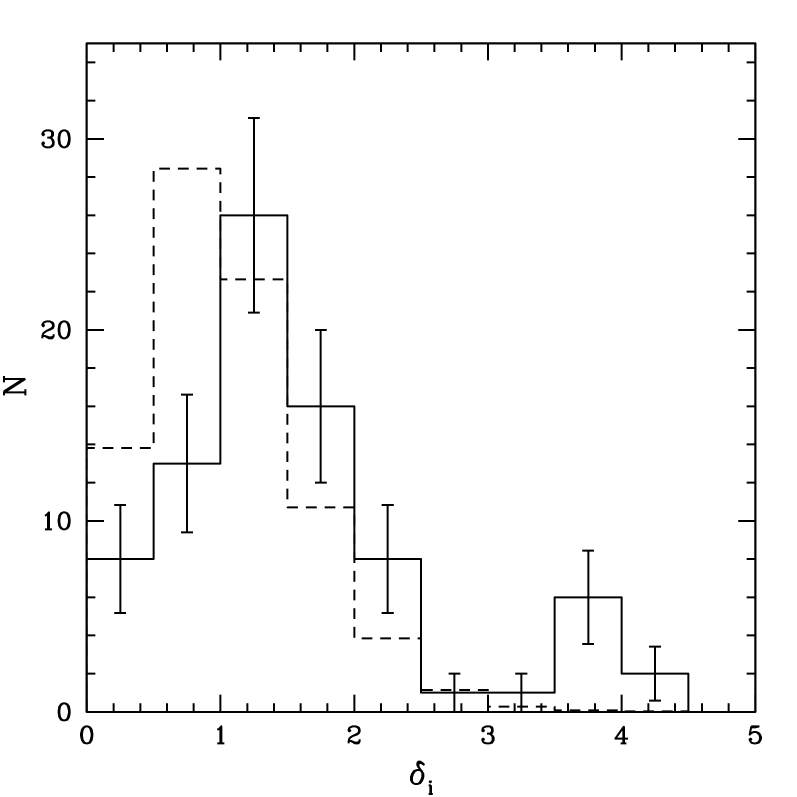
To better point out galaxies belonging to substructures, we resort to the technique developed by Biviano et al. (biv02 (2002), see also Boschin et al. bos06 (2006); Girardi et al. gir06 (2006)), who used the individual –values of the Dressler–Shectman method. The critical point is to determine the value of that optimally indicates galaxies belonging to substructure. To this aim we consider the –values of all 1000 Monte Carlo simulations used above. The resulting distribution of is compared with the observed one finding a difference at the c.l. according to the 1D Kolmogorov–Smirnov test. The “simulated” distribution is normalized to produce the observed number of galaxies and compared with the observed distribution in Fig. 10: the latter shows a tail at high values. The inspection of Fig. 10 suggests that galaxies with likely are in substructures. These galaxies are indicated with heavy circles in Fig. 9. The six galaxies located in the northeastern region of the cluster are likely to form a subclump, hereafter DS–NE (see Table 2 and Fig. 4).
We also use here the Kaye’s mixture model (KMM) test to find a possible group partition of the velocity distribution (as implemented by Ashman et al. ash94 (1994)). The KMM algorithm fits a user–specified number of Gaussian distributions to a dataset and assesses the improvement of that fit over a single Gaussian. In addition, it provides the maximum–likelihood estimate of the unknown n–mode Gaussians and an assignment of objects into groups. This algorithm is usually used to analyze the velocity distribution where theoretical and/or empirical arguments indicate that the Gaussian model is reasonable. Here the 1D KMM test fails in confirming the three groups detected by the weighted gap method. However, since in this case there is a significant correlation between galaxy velocities and positions we have decided to use KMM as a 3D diagnostic. We use the three–group galaxy assignment given by the weighted gap analysis to determine the first guess when fitting three groups. The algorithm fits a three–group partition at the c.l. according to the likelihood ratio test (hereafter KMM1, KMM2, KMM3 groups of 24, 40, and 17 galaxies from low to high mean velocities). The results for the three groups are shown in Table 2 and Fig. 11. Although there are some differences between the group memberships recovered with the two different methods (cf. Fig. 11 with Fig. 7), there are important common features: the NE region is populated by the high–velocity galaxies while the cluster core, elongated in the SE–NW direction, is formed by the medium velocity galaxies. The main difference is that the SE–NW bimodal structure is now somehow split, with KMM1 and KMM2 tracing the SE and NW peaks better, respectively. However, note that the two dominant galaxies are both contained in the medium velocity group KMM2. Moreover, the galaxies in SW region are now assigned primarily to the low velocity group.

3.4 2D galaxy distribution
When applying the DEDICA method to the 2D distribution of the 81 galaxy members, we find only one significant peak. However, our spectroscopic data suffer from magnitude incompleteness, and the sampled region does not cover the whole virial region. To overcome these limits we use the photometric catalog extracted from the SDSS (Data Release 6).
In the SDSS photometric catalog, we select likely members on the base of the (–) – (–) color–color plane (see e.g. Goto et al. got02 (2002); Boschin et al. bos08 (2008)). Out of our photometric catalog, we consider galaxies (here objects with phototype parameter ) lying within 0.08 mag from the median values of –=0.49 and –=0.35 colors of the spectroscopically cluster members (see Fig. 12). The value of 0.08 mag is two times the typical scatter reported by Goto et al. (got02 (2002)) for the corresponding color–magnitude relations – vs. and – vs. . By adopting this alternative selection method in a region within 30(almost 4 ) from the cluster center we select a sample of likely cluster members with . The result of the application of DEDICA to this sample is shown in Fig. 13. The galaxy distribution shows a shape elongated along the SE–NW direction in the central regions. The most significant peaks (at the c.l.) correspond to the I dominant galaxy, the II dominant galaxy, a western peak well outside of (hereafter “W” peak), the NE peak at 5′and a far NE peak at 18from the cluster center (hereafter “far NE” peak).
To probe the robustness of these detections, we also apply the Voronoi tessellation and percolation (VTP) technique (see Ramella et al. ram01 (2001); Barrena et al. bar05 (2005)). This technique is non–parametric and does not smooth the data. As a consequence, it identifies galaxy structures irrespective of their shapes. In particular, we run VTP in a region within 30from the cluster center selecting galaxies with and the same color constraints as above. The result of the application of VTP is shown in Fig. 14. VTP is run 4 times adopting four detection thresholds: galaxies identified as belonging to structures at the 95, 98, 99, and c.ls. VTP reveals the elongation of A959 in the SE–NW direction and confirms the NE peak, the W, and far NE peaks.


4 Discussion and conclusions
Our analysis based on member galaxies shows that A959 is a strongly substructured cluster. In particular, we detect an NE clump, at 5from the cluster center, using the weighted gap analysis (V3 group), the Dressler–Shectman statistics (DS–NE group), the 3D KMM analysis (KMM3 group) and the 2D analysis of the galaxy distribution. This clump has a rest frame velocity of v km sand is the likely cause of the velocity gradient we observe in A959. The NE clump is also detected in ROSAT/PSPC X–ray data and in the lensing gravitational map by Dahle et al. (dah03 (2003)). This clump is also aligned with the SW mass concentration WL 1017.3+5931 whose nature is very intriguing.
The central cluster region is not well relaxed, too. We find evidence of a central, dense structure elongated along the SE–NW direction as shown by the the weighted gap analysis (V2 group), the 3D KMM analysis (KMM2 group) and the 2D analysis of the galaxy distribution. The SE–NW central structure has an intermediate velocity and hosts more luminous cluster galaxies; thus it likely represents the main part of the cluster still showing the trace of a past merger. The apparent elongation of this structure is connected with the presence of the two dominant galaxies and some galaxies surrounding them, as shown by the two peaks detected by DEDICA and VTP in the 2D galaxy distributions. Close couples of dominant galaxies having different velocities are often observed in clusters (Boschin et al. bos06 (2006); Barrena et al. 2007a ) and are the likely tracers of a previous cluster merger. Indeed cluster merger is thought to be the cause of the formation of dumbbell galaxies (e.g., Beers et al. bee92 (1992); Flores et al. flo00 (2000)). With respect to other cases we have studied (e.g., clusters Abell 773 and Abell 2744; see Barrena et al. 2007a and Boschin et al. bos06 (2006), respectively), the two dominant galaxies are closer in the velocity space and more distant in sky positions suggesting that the direction of the old, past merger is almost parallel to the plane of the sky.
The SE–NW elongation is also shown by gravitational lensing and ROSAT X–ray data (Dahle et al. dah03 (2003)). The ellipticity of the X–ray surface brightness appears less pronounced than those of mass and galaxy distributions, in agreement with the collisional component of the cluster having already had some time to relax.
The above discussion suggests that A959 is forming along two main directions of mass accretion (SE–NW and NE–SW). Indeed, the region around this cluster is quite complex and deserves a brief discussion. By running the VTP technique and DEDICA on the 2D galaxy distribution we find two significant galaxy concentrations: a group at 13W of A959 and a far NE one at 18from the core of the cluster. These two groups were first detected by Koester et al. (koe07 (2007)) using the maxBCG red–sequence method in SDSS photometric data. They computed photometric redshifts of 0.281 and 0.284 for the W and NE groups, respectively. Thus, they are at the same redshift of A959, at projected distances from it of 3.4 Mpc (W group) and 4.7 Mpc (NE group), possibly representing the most important knots of the filamentary large–scale structure around the cluster, after A959 itself. Closer to A959 (at 6WSW from the cluster center), ROSAT archival data reveal a diffuse X–ray emission probably associated to a small galaxy group. Unfortunately, we have no redshift in this region, but at the center of the X–ray emission there is a brilliant galaxy (only slightly less luminous than the I and II dominant galaxies) showing the typical colors of the early–type galaxies of A959. This galaxy (known as NVSS J101642+592222) is an evident pointlike radio source in NVSS (Condon et al. con98 (1998)) archival data, too. We suspect that this radio galaxy is at the center of a galaxy group falling in the gravitational well of A959. In Table 3 we summarize the properties of the WSW group, the W group and other structures not listed in Table 2.
As for the global properties of the cluster, the value we find for the velocity dispersion of all A959 cluster members is very high, km s-1. When considering a more central region to avoid the NE subclump we still obtain a high value km s-1. This value is in good agreement with the average X–ray temperature (Mushotzky & Scharf mus97 (1997)) when assuming the energy density equipartition between gas and galaxies (i.e. 333 with the mean molecular weight and the proton mass., see Fig.5) and leads to a virial mass of . We compare our mass estimate with that derived from the gravitational lensing analysis. Dahle et al. (dah02 (2002)) obtained a projected mass (in our cosmology). To rescale and project our mass, we assume two alternative mass distributions: a King–like mass distribution (see above) or an NFW profile where the mass–dependent concentration parameter is taken from Navarro et al. (nav97 (1997)) and rescaled by the factor (Bullock et al. bul01 (2001); Dolag et al. dol04 (2004)). Our projected mass estimate is , where the projection is done assuming that the cluster mass distribution is truncated at one or at two virial radii. The lensing mass is consistent with our projected estimate within their errors, even if the former is likely to be a bit higher, possibly due to the young dynamical state of the cluster.
In conclusion, A959 shows the typical features of most clusters hosting halo/relic radio sources, i.e. a high mass (higher than within 2 Mpc; see Giovannini & Feretti gio02 (2002)) and a young dynamical state (diffuse radio sources appear in clusters possessing substructures, i.e. experiencing large departures from a virialized state; see, e.g., Buote buo01 (2001)). This makes of this cluster a good candidate for deep radio studies. More observations of the diffuse radio source will allow to clarify its connection with the internal dynamics of this cluster. Moreover, deep X–ray observations will be useful for determining the merging phase of the NE clump.
Acknowledgements.
This publication is based on observations made on the island of La Palma with the Italian Telescopio Nazionale Galileo (TNG), operated by the Fundación Galileo Galilei – INAF (Istituto Nazionale di Astrofisica), in the Spanish Observatorio of the Roque de Los Muchachos of the Instituto de Astrofisica de Canarias. This research has made use of the NASA/IPAC Extragalactic Database (NED), which is operated by the Jet Propulsion Laboratory, California Institute of Technology, under contract with the National Aeronautics and Space Administration. This research has made use of the galaxy catalog of the Sloan Digital Sky Survey (SDSS). Funding for the SDSS has been provided by the Alfred P. Sloan Foundation, the Participating Institutions, the National Aeronautics and Space Administration, the National Science Foundation, the U.S. Department of Energy, the Japanese Monbukagakusho, and the Max Planck Society. The SDSS Web site is http://www.sdss.org/. The SDSS is managed by the Astrophysical Research Consortium for the Participating Institutions. The Participating Institutions are the American Museum of Natural History, Astrophysical Institute Potsdam, University of Basel, University of Cambridge, Case Western Reserve University, University of Chicago, Drexel University, Fermilab, the Institute for Advanced Study, the Japan Participation Group, Johns Hopkins University, the Joint Institute for Nuclear Astrophysics, the Kavli Institute for Particle Astrophysics and Cosmology, the Korean Scientist Group, the Chinese Academy of Sciences (LAMOST), Los Alamos National Laboratory, the Max-Planck-Institute for Astronomy (MPIA), the Max-Planck-Institute for Astrophysics (MPA), New Mexico State University, Ohio State University, University of Pittsburgh, University of Portsmouth, Princeton University, the United States Naval Observatory, and the University of Washington. This work was partially supported by a grant from the Istituto Nazionale di Astrofisica (INAF, grant PRIN–INAF2006 CRA ref number 1.06.09.06).References
- (1) Abell, G. O., Corwin, H. G. Jr., & Olowin, R. P. 1989, ApJS, 70, 1
- (2) Ashman, K. M., Bird, C. M., & Zepf, S. E. 1994, AJ, 108,2348
- (3) Bardelli, S., Zucca, E., Vettolani, G., et al. 1994, MNRAS, 267, 665
- (4) Barrena, R., Boschin, W., Girardi, M., & Spolaor, M. 2007a, A&A, 467, 37
- (5) Barrena, R., Boschin, W., Girardi, M., & Spolaor, M. 2007b, A&A, 469, 861
- (6) Barrena, R., Ramella, M., Boschin, W., et al. 2005, A&A, 444, 685
- (7) Beers, T. C., Flynn, K., & Gebhardt, K. 1990, AJ, 100, 32
- (8) Beers, T. C., Forman, W., Huchra, J. P., Jones, C., & Gebhardt, K. 1991, AJ, 102, 1581
- (9) Beers, T. C., Gebhardt, K., Huchra, J. P., et al. 1992, ApJ, 400, 410
- (10) Bird, C. M. 1994, ApJ, 422, 480
- (11) Bird, C. M., & Beers, T. C. 1993, AJ, 105, 1596
- (12) Biviano, A., Katgert, P., Thomas, T., & Adami, C. 2002, A&A, 387, 8
- (13) Böhringer, H., & Schuecker, P. 2002, in “Merging Processes in Galaxy Clusters”, eds. L. Feretti, I. M. Gioia, & G. Giovannini (The Netherlands, Kluwer Ac. Pub.): Observational signatures and statistics of galaxy cluster mergers
- (14) Boschin, W., Barrena, R., Girardi, M., & Spolaor, M. 2008, A&A, 487, 33
- (15) Boschin, W., Girardi, M., Barrena, R., et al. 2004, A&A, 416, 839
- (16) Boschin, W., Girardi, M., Spolaor, M., & Barrena, R. 2006, A&A, 449, 461
- (17) Bullock, J. S., Kolatt, T. S., Sigad, Y., et al. 2001, MNRAS, 321, 559
- (18) Buote, D. A. 2001, ApJ, 553, 15
- (19) Buote, D. A. 2002, in “Merging Processes in Galaxy Clusters”, eds. L. Feretti, I. M. Gioia, & G. Giovannini (The Netherlands, Kluwer Ac. Pub.): Optical Analysis of Cluster Mergers
- (20) Carlberg, R. G., Yee, H. K. C., & Ellingson, E. 1997, ApJ, 478, 462
- (21) Cassano, R.; Brunetti, G.; & Setti, G. 2006, MNRAS, 369, 1577
- (22) Condon, J. J., Cotton, W. D., Greisen, E. W., et al. 1998, AJ, 115, 1693
- (23) Cooray, A. R., Grego, L., Holzapfel, W. L., Joy, M., & Carlstrom, J. E. 1998, AJ, 115, 1388
- (24) Dahle, H., Kaiser, N., Irgens, R. J., Lilje, P. B., & Maddox, S. J. 2002, ApJS, 139, 313
- (25) Dahle, H., Pedersen, K., Lilje, P. B., Maddox, S. J., & Kaiser, N. 2003, ApJ, 591, 662
- (26) Danese, L., De Zotti, C., & di Tullio, G. 1980, A&A, 82, 322
- (27) Dolag, K., Bartelmann, M., Perrotta, F., et al. 2004, A&A, 416, 853
- (28) Dressler, A., & Shectman, S. A. 1988, AJ, 95, 985
- (29) Ellingson, E., & Yee, H. K. C. 1994, ApJS, 92, 33
- (30) Fadda, D., Girardi, M., Giuricin, G., Mardirossian, F., & Mezzetti, M. 1996, ApJ, 473, 670
- (31) Fasano, G., & Franceschini, A. 1987, MNRAS, 225, 155
- (32) Feretti, L. 1999, MPE Report No. 271
- (33) Feretti, L. 2002, The Universe at Low Radio Frequencies, Proceedings of IAU Symposium 199, held 30 Nov – 4 Dec 1999, Pune, India. Edited by A. Pramesh Rao, G. Swarup, and Gopal–Krishna, 2002., p.133
- (34) Feretti, L. 2005, X–Ray and Radio Connections (eds. L. O. Sjouwerman and K. K. Dyer). Published electronically by NRAO, http://www.aoc.nrao.edu/events/xraydio. Held 3–6 February 2004 in Santa Fe, New Mexico, USA
- (35) Feretti, L., Gioia I. M., and Giovannini G. eds., 2002, Astrophysics and Space Science Library, vol. 272 “Merging Processes in Galaxy Clusters”, Kluwer Academic Publisher, The Netherlands
- (36) Ferrari, C.; Govoni, F.; Schindler, S.; Bykov, A. M.; & Rephaeli, Y. 2008, Space Sci. Rev., 134, 93
- (37) Flores, R. A., Quintana, H., & Way, M. J. 2000, ApJ, 532, 206
- (38) Giovannini, G., & Feretti, L. 2002, in “Merging Processes in Galaxy Clusters”, eds. L. Feretti, I. M. Gioia, & G. Giovannini (The Netherlands, Kluwer Ac. Pub.): Diffuse Radio Sources and Cluster Mergers
- (39) Giovannini, G., Tordi, M., & Feretti, L. 1999, New A, 4, 141
- (40) Girardi, M., Barrena, R., Boschin, W., & Ellingson, E. 2008, A&A, 491, 379
- (41) Girardi, M., & Biviano, A. 2002, in “Merging Processes in Galaxy Clusters”, eds. L. Feretti, I. M. Gioia, & G. Giovannini (The Netherlands, Kluwer Ac. Pub.): Optical Analysis of Cluster Mergers
- (42) Girardi, M., Biviano, A., Giuricin, G., Mardirossian, F., & Mezzetti, M. 1993, ApJ, 404, 38
- (43) Girardi, M., Boschin, W., & Barrena, R. 2006, A&A, 455, 45
- (44) Girardi, M., Fadda, D., Giuricin, G. et al. 1996, ApJ, 457, 61
- (45) Girardi, M., Giuricin, G., Mardirossian, F., Mezzetti, M., & Boschin, W. 1998, ApJ, 505, 74
- (46) Girardi, M., & Mezzetti, M. 2001, ApJ, 548, 79
- (47) Goto, T., Sekiguchi, M., Nichol, R. C., et al. 2002, AJ, 123, 1807
- (48) Govoni, F., Ensslin, T. A., Feretti, L., & Giovannini, G. 2001a, A&A, 369, 441
- (49) Govoni, F., Feretti, L., Giovannini, G., et al. 2001b, A&A, 376, 803
- (50) Irgens, R. J., Lilje, P. B., Dahle, H., & Maddox, S. J. 2002, 579, 227
- (51) Kempner, J. C.; Blanton, E. L.; Clarke, T. E.; et al. 2004, in “The Riddle of Cooling Flows in Galaxies and Clusters of Galaxies”, eds. T. Reiprich, J. Kempner, & N. Soker (Charlottesville: Univ. Virginia), 335
- (52) Kennicutt, R. C. 1992, ApJS, 79, 225
- (53) Koester, B. P., McKay, T. A., Annis, J., et al. 2007, ApJ, 660, 239
- (54) Ledermann, W. 1982, Handbook of Applicable Mathematics (New York: Wiley), Vol.6
- (55) Limber, D. N., & Mathews, W. G. 1960, ApJ, 132, 286
- (56) Malumuth, E. M., Kriss, G. A., Dixon, W. Van Dyke, Ferguson, H. C., & Ritchie, C. 1992, AJ, 104, 495
- (57) Mushotzky, R. F., & Scharf, C. A. 1997, ApJ, 482, L13
- (58) NAG Fortran Workstation Handbook, 1986 (Downers Grove, IL: Numerical Algorithms Group)
- (59) Navarro, J. F., Frenk, C. S., & White, S. D. M. 1997, ApJ, 490, 493
- (60) Ota, N., & Mitsuda, K. 2004, A&A, 428, 757
- (61) Owen, F., Morrison, G., & Voges, W. 1999, proceedings of the workshop “Diffuse Thermal and Relativistic Plasma in Galaxy Clusters”, eds. H. Böhringer, L. Feretti, & P. Schuecker, MPE Report 271, pp. 9-11
- (62) Pisani, A. 1993, MNRAS, 265, 706
- (63) Pisani, A. 1996, MNRAS, 278, 697
- (64) Popesso, P., Böhringer, H., Brinkmann, J., Voges, W., & York, D. 2004, A&A, 423, 449
- (65) Quintana, H., Carrasco, E. R., & Reisenegger, A. 2000, AJ, 120, 511
- (66) Ramella, M., Boschin, W., Fadda, D., & Nonino, M. 2001, A&A, 368, 776
- (67) Roettiger, K., Loken, C., & Burns, J. O. 1997, ApJS, 109, 307
- (68) Sarazin, C. L. 2002, in “Merging Processes in Galaxy Clusters”, eds. L. Feretti, I. M. Gioia, & G. Giovannini (The Netherlands, Kluwer Ac. Pub.): The Physics of Cluster Mergers
- (69) Schuecker, P., Böhringer, H., Reiprich, T. H., & Feretti, L. 2001, A&A, 378, 408
- (70) The, L. S., & White, S. D. M. 1986, AJ, 92, 1248
- (71) Tonry, J., & Davis, M. 1979, ApJ, 84, 1511
- (72) Wainer, H., & Schacht, S. 1978, Psychometrika, 43, 203