Low Mass Vector Meson Measurements via Di-electrons at RHIC by the PHENIX Experiment
Abstract
The PHENIX experiment at RHIC has measured and mesons in , and collisions at = 200 GeV via both hadronic and di-electron decay channels. The transverse momentum spectra as measured in different decay modes and at different centralities are shown and discussed here.
Low Mass Vector mesons are considered to be one of the most interesting probes to study the properties of strongly interacting matter created in heavy-ion collisions. A precise knowledge of their production rates and spectral properties are important in understanding the medium properties. Due to their short lifetimes, e.g., 23 for and 46 for , a considerable fraction of them decays inside the fireball, thus providing information about in-medium modifications of their spectral shape that could be linked to the restoration of chiral symmetry. These changes can be observed directly without any distortion through their dilepton decay modes as dileptons interact only electromagnetically and have a relatively large mean free path compared to the size of the system. These modifications could manifest themselves as changes in the spectral shapes or in the branching ratios. In particular, since , even small changes in the spectral properties of or can induce significant changes in the yield.
The PHENIX detector [1] at RHIC is a versatile detector that has the potential to measure the LVM properties. The analyses presented here were performed using the two central arms of the PHENIX spectrometer, each of them covering a pseudorapidity range 0.35 and 90∘ in azimuthal angle. The momentum of the charged tracks is measured with high resolution Drift Chambers (DC) and the first layer of Pad Chambers (PC1). Valid DC-PC1 tracks are confirmed by the matching between the projected and associated hit information to the Ring Imaging erenkov (RICH) detector and Electromagnetic Calorimeter (EMCal) in the case of electrons and to the Time of Flight (TOF) detector or EMCal for the hadrons. Beam Beam Counters (BBC) and Zero Degree Calorimeters provide the minimum bias trigger, the vertex position and the centrality of the collision.
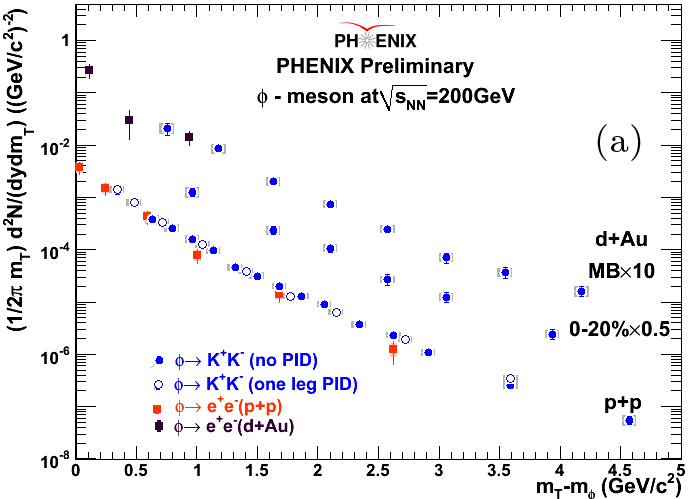
The and decays were reconstructed by combining the oppositely charged identified particles into pairs to form invariant mass spectra that contain both the signal and a combinatorial background of uncorrelated pairs. The shape and amount of the combinatorial background in () and () analyses, were estimated using an event mixing procedure. The spectra, after subtracting the combinatorial background, were then fit in the vicinity of the meson masses to a Breit-Wigner (BW) function convoluted with a Gaussian to take into account the detector resolution, to extract the raw yield. For other analyses, the yield extraction was done by fitting the raw peaks to a BW function convoluted with a Gaussian for the signal and a polynomial of order two for the underlying background. The analysis in and was done using three different techniques. One required both charged tracks to be identified as kaons using the TOF or EMCal detectors, the second one required only one to be identified as kaon in the TOF and the last one assumes that all the charged tracks are kaons. Results of all the three techniques show good agreement to each other as can be seen in Fig. 1(a). The and decays were reconstructed by combining (reconstructed via ) candidates with all other photons from the same event or with a pair of oppositely charged unidentified tracks, respectively. The raw yields were extracted by fitting the invariant mass distributions around the peak with a Gaussian for the signal and a parabolic function for the background. The extracted raw yields are corrected for reconstruction efficiency that includes geometrical acceptance, track reconstruction, detector performance and analysis cuts. The correction function is determined using an event generator and a GEANT based simulation of the PHENIX detector.
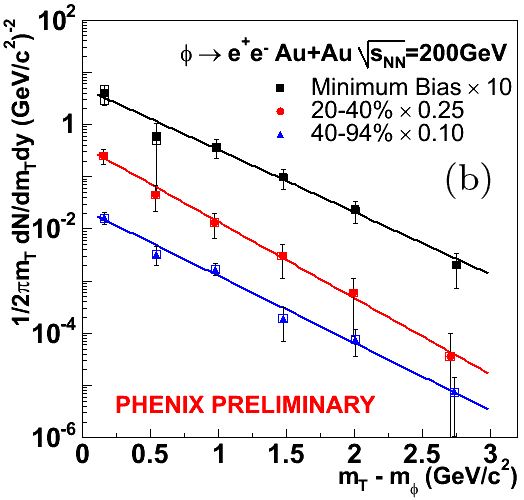
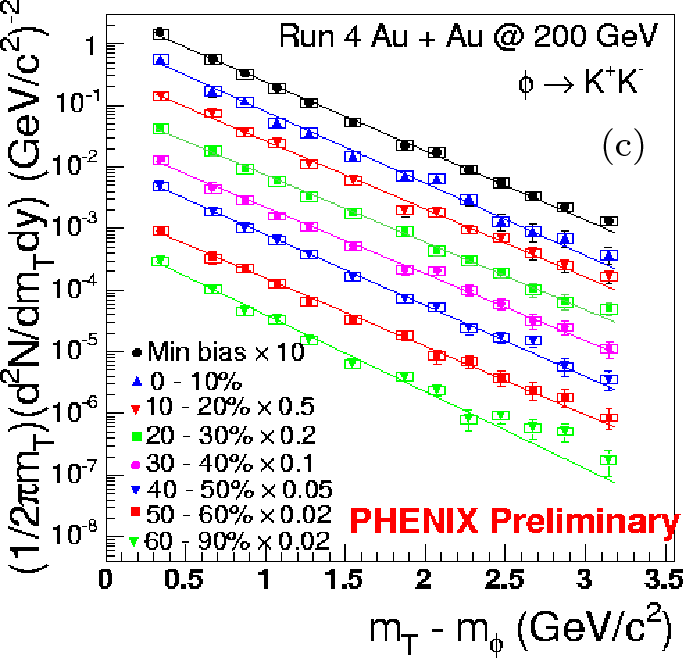
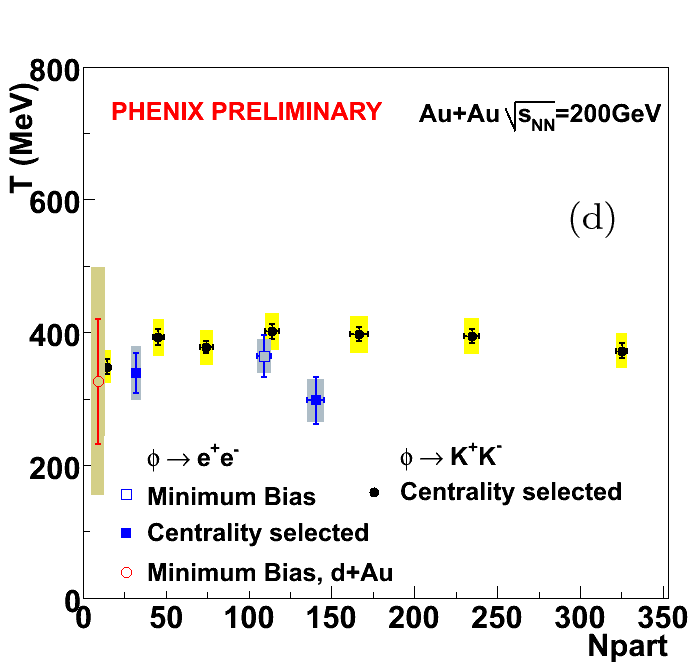
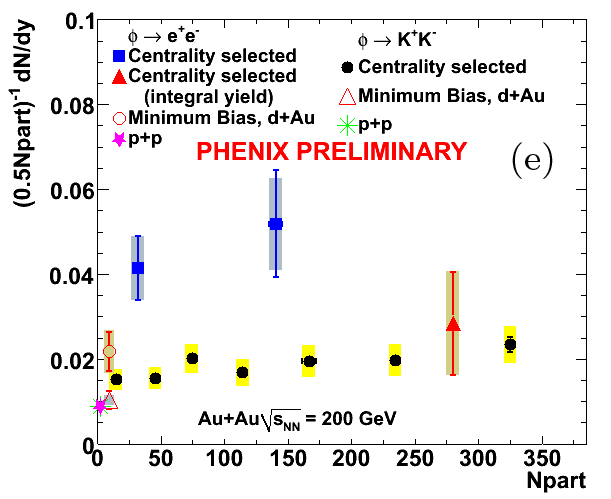
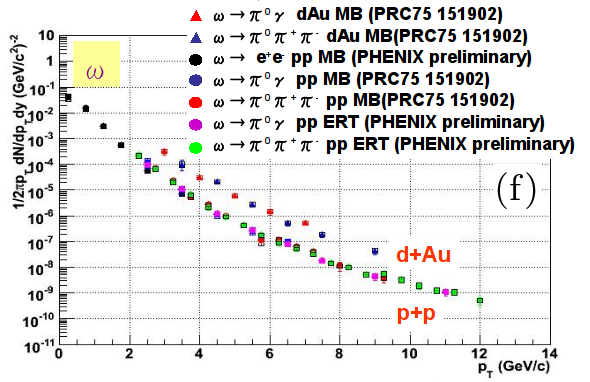
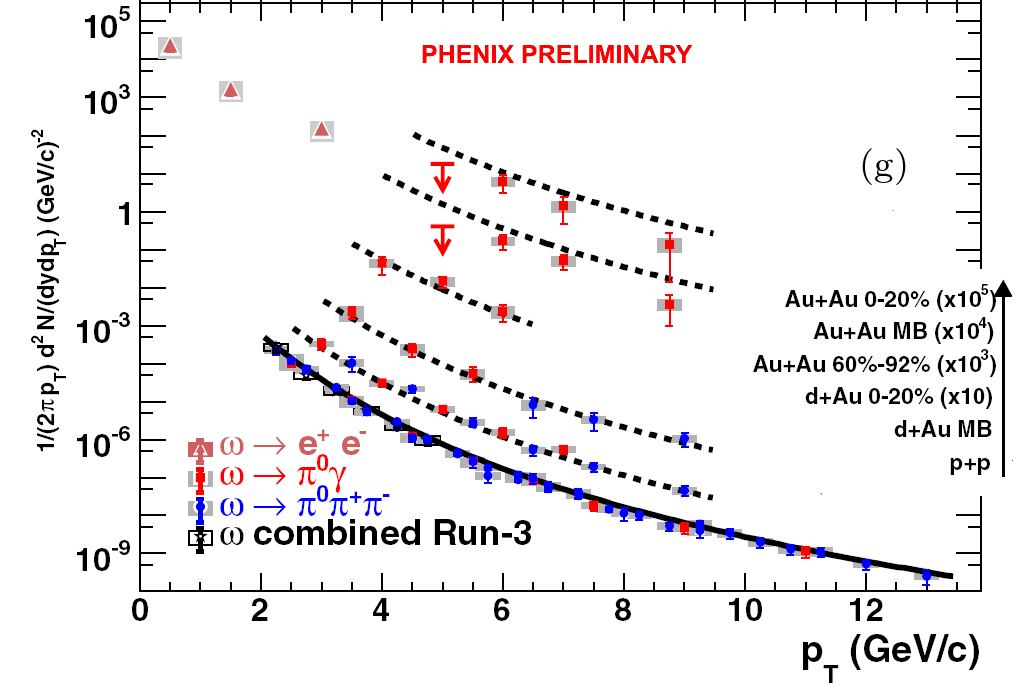
Fig. 1(a) shows the invariant spectra measured via and decay modes in and collisions. The two decay modes are in reasonable agreement to each other in both systems. The limited statistics in in do not allow us to go to high values. The spectra measured in are shown in Fig. 1(b) and 1(c) for and , respectively with a fit to an exponential function to extract the rapidity density and the temperature T. The temperatures extracted in the two decay channels are in good agreement with each other as seen in Fig. 1(d), whereas an increase of the normalized yield from collisions to peripheral collisions can be seen for both and in Fig. 1(e) [2]. The dielectron yield in the channel seems to be higher compared to the dikaon channel, but the large systematic and statistical uncertainties in the measurement prevent us from making a definitive statement. The measurements are expected to improve in future with the newly installed Hadron Blind Detector [3]. The spectra of meson measured using and are shown in Fig. 1(f) and 1(g). The spectra show good agreement among the different decay channels in all the three systems , and . The solid curve in Fig. 1(g) is the parameterization of the yield measured in collisions and the dashed curves are the fits scaled by the corresponding number of binary collisions. The curves describe pretty well the measured spectra in and peripheral collisions, whereas for central collisions, the measured points lie below the curve, indicating some suppression.
References
- [1] PHENIX detector overview K.Adcox et al., NIM A499 469-477(2003).
- [2] A. Kozlov, Nucl. Phys. A774 (2006) 739-742
- [3] I. Ravinovich, Nucl.Phys.A774:903-906,2006