A candidate tidal disruption event in the Galaxy cluster Abell 3571
Abstract
Context. Tidal disruption events are possible sources of temporary nuclear activity in galactic nuclei and can be considered as good indicators of the existence of supermassive black holes in the centers of galaxies.
Aims. A new X-ray source has been detected serendipitously with ROSAT in a PSPC pointed observation of the galaxy cluster A3571. Given the strong flux decay of the object in subsequent detections, the tidal disruption scenario is investigated as a possible explanation of the event.
Methods. We followed the evolution of the X-ray transient with ROSAT, XMM-Newton and Chandra for a total period of 13 years. We also obtained 7-band optical/NIR photometry with GROND at the ESO/MPI 2.2m telescope.
Results. We report a very large decay of the X-ray flux of the ROSAT source identified with the galaxy LEDA 095953, a member of the cluster Abell 3571. We measured a maximum 0.3–2.4 keV luminosity Log(LX)=42.8 erg s-1. The high state of the source lasted at least 150 ks; afterwards LX declined as t-2. The spectrum of the brightest epoch is consistent with a black body with temperature 0.12 keV.
Conclusions. The total energy released by this event in 10 yr was estimated to be 21050 erg. We interpret this event as a tidal disruption of a solar type star by the central supermassive black hole (i.e. 107 M⊙) of the galaxy.
Key Words.:
X-rays – Galaxies, X-rays: bursts, Galaxies: clusters: individual: A3571, Galaxies: Active, Galaxies: Nuclei –1 Introduction
There is growing evidence that most galaxies with a bulge host a supermassive black hole (BH) in their center (Kormendy & Richstone 1995; Magorrian et al. 1998). The most recent theoretical and observational developments in the field of galaxy evolution suggest that during their life, galaxies experience one or more phases where the BH is active and powered by accretion. One of the effects of this phenomenon are the so called active galactic nuclei or quasars where accretion occurs on time scales longer than 106-7yr. It is widely accepted that during this period the BH is fed by an accretion disk. On the other hand, during the non-active phase of the galaxy life the BHs can be briefly powered by stars tidally disrupted during close encounters with the BHs (e.g. Frank & Rees 1976). Recent studies (see e.g. Wang & Merritt 2004; Esquej et al. 2008; Donley et al. 2002) pointed out that these events happen with a rate of 10-4-10-5 galaxy-1 year-1. These phenomena can generate strong flares in the UV-X-ray band as the result of the onset of an accretion disk. The X-ray/UV luminosity of the galaxy is therefore expected to grow to values close to those of AGNs (i.e. 1042 erg s-1). If the star is Sun-like, tidal disruption can only occur if the mass of the BHs does not exceed 108 M⊙ since, in this case the tidal radius would typically fall within the Schwarzschild radius and the star is swallowed as a whole. In the case of rotating BHs, the tidal disruption also can occur for higher BH masses if the star approaches from a favorable direction (Beloborodov et al. 1992). However atmosphere stripping of giant stars is possible also for larger BH masses. When assuming a black body radiating at the Eddington luminosity, the temperature of the emitting region calculated at the last stable orbit (3 RS, where RS is the Schwarzschild radius) is 30-300 eV for a 106-7 M⊙ black hole. After the disruption, the mass accretion rate, and therefore the bolometric luminosity, may decay approximately as t-5/3 (Rees 1990; Evans & Kochanek 1989), even though deviations from this law are expected (see e.g. Lodato et al. 2008). 7 candidate tidal disruption events have been detected in the X-ray by the ROSAT all-sky survey and in the XMM-Newton slew survey (see e.g Komossa & Bade 1999; Greiner et al. 2000; Grupe et al. 1999; Komossa et al. 2004; Esquej et al. 2007). Candidate tidal disruption have been observed also in the Optical/UV (e.g. Renzini et al. 1995; Gezari et al. 2008). The X-ray events show strong X-ray variability (i.e. more than a factor of 100), 0.3–2.4 keV luminosities typical of AGN and quasars (i.e. 1042 erg s-1) declining as t-5/3, ultrasoft (i.e. 0.1 keV) X-ray spectra and the absence of Seyfert activity in ground-based optical spectra (see Komossa 2002 for a review). In this letter we report the serendipitous detection of a very large decay in the X-ray flux of the galaxy LEDA 095953 at z=0.0366 (Quintana & de Souza 1993) in the field of view of the galaxy cluster Abell 3571 using ROSAT, XMM-Newton and Chandra archival X-ray data and GROND optical/NIR follow-up.
2 Observations and data processing
| Instrument | Date | Band | Exposure |
|---|---|---|---|
| dd-mm-yyyy | s | ||
| ROSAT-PSPC | 12-08-1992 | 0.3–2.4 keV | 5800 |
| ROSAT-HRI | 05-08-1994 | 0.3–2.4 keV | 19200 |
| XMM-Newton-EPIC-PN | 29-07-2002 | 0.3–2.4 keV | 24200 |
| Chandra-ACIS-S | 31-07-2003 | 0.3–2.4 keV | 33900 |
| ESO/MPI-GROND | 12-08-2008 | g, r’,i’, z’ | 458 |
| ESO/MPI-GROND | 12-08-2008 | J,H,K | 480 |
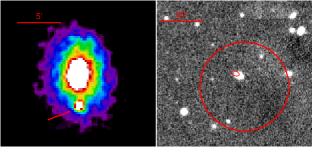
During the soft X-ray follow-up of the Swift-BAT, hard X-ray selected sample of galaxy clusters (Ajello et al. 2008), we serendipitously discovered a bright source in a ROSAT-PSPC image of Abell 3571 (see Fig. 1) that apparently disappeared in subsequent observations with XMM-Newton and Chandra. The field of Abell 3571 has been observed in X-rays in pointed mode with the ROSAT-PSPC/HRI detectors, XMM-Newton EPIC, Chandra ACIS-S and during the ROSAT all-sky survey. The ROSAT data were processed using the standard MIDAS-EXSAS software version 03SEPpl1, while XMM-Newton and Chandra data were processed using XMM-SAS version 7.0 and CIAO 4.0. We also performed an optical/NIR follow-up of the field in the g’, r, i’, z’ bands and J, H, KS bands, by using GROND (Greiner et al. 2008), mounted at the 2.2 m ESO/MPI telescope at La Silla observatory (Chile). In Table 1 we list the log of the observations of the field of Abell 3571 relevant for this work.
2.1 Data analysis
ROSAT-PSPC: Using the ROSAT-PSCP 0.3-2.4 keV energy band
image and exposure map available in the archive, we created a background map,
by first running a sliding cell source detection
with a signal-to-noise ratio threshold
of 4, excising the detected sources from the image and
fittingthe residual data with a spline model.
With the background map described above and using
the exposure map we run a
maximun likelihood, PSF-fitting, source detection.
The bright, eye-detected, source mentioned in the previous section
has been detected with a significance 10
with coordinates of the centroid 13h47m29.8s -32∘55′00″
(J2000) with an error box of 25.
Considering that the source is embedded in the X-ray emission
of the galaxy cluster Abell 3571, the photometric properties
have been evaluated using aperture photometry instead of using the estimate of the
detection software.
We extracted the source counts in a circular region with a radius corresponding to
the 90% Encircled Energy Radius (EER) around the centroid estimated by the maximum likelyhood fit.
Background counts have been estimated in a ring around the source
with an inner radius 1.5 times the 90% EER and outer radius 2 times the 90% ERR.
As a result we obtained 305 net source counts corresponding to a count-rate of (5.2)10-2 s-1.
PSF fitting estimated a flux 30% lower as a result of a likely overestimate of the background.
In the same regions we also extracted source and background lightcurves and spectra.
All the epochs but one have flux consistent with a mean count-rate of 5.210-2 s-1.
Note that the observation was split in two parts separated by 150 ks. This indicates
that no strong variability is present on such a time scale.
However in one time bin the count-rate reached
(8.3)10-2 s-1. This flux is 3 above the mean
and could indicate a small flare during the event.
The unfolded spectrum of the source is shown in Fig. 2 .
We performed a fit to
the spectrum using a black-body model plus cold absorption.
We kept as free parameters the temperature kT, the columns density
NH and the normalization .

As a result we obtained a temperature kT=120 eV and
NH=3.931020 cm-2 and =1.05/4.00.
This corresponds to a 0.3-2.4 keV flux of 7.6510-13 erg cm-2 s-1.
Assuming no spectral changes during the observation, the maximum
0.3-2.4 keV flux emitted by the source is 1.1610-12 erg cm-2 s-1.
Note that the column density is consistent within
with the Galactic value predicted by Dickey
& Lockman (1990)
(i.e. NH=3.71020 cm-2) suggesting an extragalactic origin of the source.
We also tested other spectral models, like a power-law plus absorption, without improving the
quality of the fit by having 6.5, and
N31021 cm-2 as best fit parameters and =5.30/4.00.
We also performed aperture photometry on ROSAT all sky survey images
at the source location and we determined a 1 upper-limit (see next Section)
on the count-rate of 0.44 s-1 corresponding to
a flux of 2.210-12 erg cm-2 s-1 in the 0.3–2.4 keV band
assuming as a spectral model a black body with kT=0.12 keV.
ROSAT-HRI: The source is visually observable also in the HRI observation
though much fainter than in the PSPC image. Considering the highest spatial resolution of the HRI detector we performed
a source detection to constrain the source position better than in the PSPC pointing.
Unfortunately because of the faintness of the source and the difficulty in modeling
the high background due to the extended X-ray emission of
the cluster, the source has been detected with a significance of 3-4, but
as an extended source. We therefore performed aperture photometry around the ROSAT-PSPC centroid.
By adopting the same procedure used for the PSPC data,
we measured 38 source counts corresponding to a count rate of
(1.97) s-1.
By assuming no spectral change between the ROSAT-PSPC and
HRI observation (i.e. 2 years) we estimated a 0.3–2.4 keV flux of
1.5310-13 erg cm-2 s-1.
XMM-Newton: A visual inspection of the EPIC-PN
image does not show any relevant signature of a X-ray
source in the ROSAT error box. We run a maximum likelihood
source detection in that region but no sources were detected
with significance 3.
We therefore estimated the 3 upper-limit of the source count at the source location by
using the prescriptions of Narsky (2000).
Given M counts actually observed in a region of 30 (Cappelluti et al. 2009),
and B background counts, the 1
upper limit is defined as the number of counts that gives the probability
to observe M (or fewer) counts equal to the formal 68.3% Gaussian probability:
(68.3%).Assuming Poissonian statistics this equation becomes:
By iteratively solving the previous equation in the case of =0.997,
we obtained the 3 upper limit X=167 counts.
This corresponds to a count-rate of 8.810-3 s-1 and to a flux of 1.4510-14erg cm-2 s-1111
The flux was derived from the count-rate with the PIMMS software by assuming as the spectrum the
ROSAT-PSPC best fit. http://heasarc.nasa.gov/Tools/w3pimms.html .
Chandra: Using the task wavdetect,
included in the CIAO software, we performed a
source detection on the ACIS-S4 Chip where the source is observable.
The analysis was performed in the 0.3–2.4 keV energy band.
We ran wavdetect using an exposure map estimated at 1 keV with a threshold of 10-6, corresponding to a maximum
of 1 spurious detection expected per ACIS-chip.
As a result, in the ROSAT PSPC error box we detected one source with 9.5 counts
corresponding to a count-rate of 2.8910-4 s-1. The new source coordinates
are =13h47m30.33s, =-32∘5450.63.
At the source position the estimated positional error is 2.5.
We also ran a source detection in the 2–7 keV band without detecting a source.
We also estimated the flux of the source by folding into XSPEC the Chandra response matrices
and assuming as the spectral model the ROSAT-PSPC best fit and obtained a 0.3–2.4 keV flux of
3.4310-15 erg cm-2 s-1.
Note that the source centroid lies about 5 from the chip edge, therefore
the estimate of the background could be affected by features near this edge.
According to its coordinate, the X-ray source has been named TDXFJ134730.3-325451.
GROND:
In Fig. 1 we show the GROND K-band image
of the area covered by the ROSAT-PSPC error box.
As one can notice, the Chandra ellipsoid
is placed right on the disk of a bright galaxy
with an offset of 3 ″ from the optical
centroid of the galaxy. Note that the GROND images have an
astrometric uncertainty of 0.5″.
We searched the NED catalog and the galaxy
was previously known as LEDA 095953, a member of the cluster Abell 3571
at z=0.0366 (Quintana & de Souza 1993).
We determined the photometric properties of the source
and obtained the following AB magnitudes: 17.05, 16.26,
15.80, 15.54, 15.04, 14.75 and 14.87 in
the g’ ,r’, i’, z’, J, H, KS bands, respectively. These magnitudes are calculated by using
SA105-815 and 2MASS stars as a reference and corrected for the expected foreground
extinction of =0.054 (Schlegel et al. 1998).
We examined the global spectral energy distribution (SED) in Fig. 3
of this object using a tool based on a chi-squared minimization method
that allows us to fit the observed fluxes with a combination of AGN and galaxy emission,
also allowing for the possibility of extinction of the AGN flux.
From this analysis we found that the model fit that better describes the
SED of this object is a normal S0 galaxy with no significant
contribution due to the presence of an AGN.

3 Long term light curve
The X-ray flux of TDXFJ134730.3-325451 has been followed for 13 years and its lightcurve is presented in Fig. 4. Remarkably, it shows an amplitude of the variability of a factor 650. We estimated the maximum 0.3-2.4 keV luminosity222The luminosity has been computed assuming a -dominated universe with =0.7, =0.3 and H0=72 km s-1 Mpc-1 as Log(LX)=42.83 erg s-1. By excluding the upper limits, we fitted the long term lightcurve with a power-law model in the form: , where k is the normalization, marks the time of the star’s disruption and is the slope of the decay. As a result we obtained k71042 erg s-1, 1991.6 and =2.2. Because of the low number of data points, the uncertainties on the fit parameters are large. The value of the slope is therefore marginally consistent with the predictions of variants of tidal disruption models (i.e. 5/3, see e.g. Evans & Kochanek 1989; Rees 1990). Note that according to the lightcurve, the source at the maximum could have been at 1-2 orders of magnitude brighter with respect to the time of the ROSAT-PSPC observation. If the source continues its decay, it would be detectable with Chandra for all the year 2009 and 2010, with moderately deep exposures.

4 Discussion
We serendipitously detected a factor 650 decay in the flux of an X-ray source in the rich galaxy cluster A3571. The flare most likely originated in the galaxy LEDA 095953 at z=0.0366. The most luminous epoch in the lightcurve reached Log=42.83 (0.3–2.4) and lasted for more than 150 ks, although higher luminosities at the time of the burst cannot be excluded. The spectrum of the flare is consistent with a black-body of temperature kT0.12 keV with no significant hard components. The optical/NIR SED of the host galaxy does not show any signature of AGN activity. In addition to this, the decay of the long term light curve is marginally consistent with t-5/3, and thanks to the stringent RASS upper limit, we likely detected the source close to the burst. The X-ray luminosity and the variability of the source are therefore much higher than those of ULX, which have L1039-40 erg s-1 and flux variations typically of up to a factor of 2-3 (see e.g. Colbert & Ptak 2002). Supernovae explosions can also produce X-ray flares, but these are either of very short duration (hours), or else if longer lasting they have much harder X-ray spectra and typically have LX1041 erg s-1(see e.g. Immler & Lewin 2003, for a review). Additionally novae and supersoft sources can produce bursts but with much shorter duration (Tanaka & Shibazaki 1996). According to the event properties, we can safely exclude these kinds of stellar phenomena. However, such a strong variability could be observed in GRB afterglows or Hypernovae but with a much shorter duration of the outburst. The characteristics of the flare are therefore consistent with previous cases of candidate tidal disruption events (see e.g. Komossa et al. 2004; Esquej et al. 2008) and with theoretical predictions (Rees 1990; Lodato et al. 2008). The mass of the BH should be not much higher than 108 M⊙ to disrupt a Sun-like star outside the Schwarzschild radius and to allow the onset of accretion. We then estimated the black hole mass from the LK-MBH relation determined by Marconi & Hunt (2003) in the local Universe. If LK is the K-band luminosity of the bulge of the galaxy in solar units then 8.08+1.21( L/L⊙-10.9). Using an aperture radius of 4 (i.e. 2.5 kpc, at the galaxy distance) we estimated a log(L10 which corresponds to 7. The total energy released during the event can be estimated with =, where (t) is the best fit to the light curve. By integrating over a period of 10 yr after our first data point we obtained a total energy release of the order of 21050 erg. If 0.1 is the typical efficiency of mass to energy conversion for accretion onto a BH, then the total mass accreted during a 10 year period is . This yields a total mass deposition of 110-3 M⊙. This value is actually a lower limit, since we started the integration only at the start of the observations (note that the fitting function diverges at the time of the disruption). Moreover it is possible that the total emission is dominated by an unobserved EUV component (extrapolation of the single black body fit itself predicts a 7% higher luminosity), and the true accretion rate is much higher. According to the results of Li et al. (2002), for a black hole of 107 M⊙, the flare occurs 0.07 yr after the disruption. A 10 yr integration of the lightcurve model from this epoch yields an estimate of the accreted mass of 0.03 M⊙. A numerical simulation by Ayal et al. (2000) showed that for a 1 M⊙ star disrupted by a 106 M⊙ BH, only a fraction of the order of 10% of the initial mass is actually accreted. Our limits on the accreated mass are therefore consistent with the scenario of a disruption of a 1 M⊙ star by the BH. However a partial stellar disruption or an explosive disruption (Brassart & Luminet 2008) cannot be ruled out, although disruption and accretion of a brown dwarf or of a planets is very unlikely. We note that since the tidal disruption rates are likely of the order of 10-4-10-5 galaxy-1 yr-1, galaxy clusters are ideal laboratories to explore this phenomenon: by conservatively assuming 100 member galaxies per cluster (Reiprich & Böhringer 2002), one should expect 1 tidal disruption event per cluster every 10-100 yrs. The eROSITA all-sky survey (Predehl et al. 2006) will detect several thousands of galaxy clusters and therefore a large number of these events.
Acknowledgements.
The XMM-Newton, Chandra and ROSAT archival systems and the full GROND team are acknowledged. PR is supported by the Pappalardo fellowship at MIT. HQ thanks partial support from the FONDAP Centro de Astrofisica.References
- Ajello et al. (2008) Ajello, M., et al. 2008, arXiv:0809.0006
- Ayal et al. (2000) Ayal, S., Livio, M., & Piran, T. 2000, ApJ, 545, 772
- Beloborodov et al. (1992) Beloborodov, A. M., et al. 1992, MNRAS, 259, 209
- Brassart & Luminet (2008) Brassart, M., & Luminet, J.-P. 2008, A&A, 481, 259
- Cappelluti et al. (2009) Cappelluti, N., et al. 2009, arXiv:0901.2347
- Colbert & Ptak (2002) Colbert, E. J. M., & Ptak, A. F. 2002, ApJS, 143, 25
- Dickey & Lockman (1990) Dickey, J. M., & Lockman, F. J. 1990, ARA&A, 28, 215
- Donley et al. (2002) Donley, J. L., Brandt, W. N., Eracleous, M., & Boller, T. 2002, AJ, 124, 1308
- Esquej et al. (2007) Esquej, P., et al. 2007, A&A, 462, L49
- Esquej et al. (2008) Esquej, P., et al. 2008, A&A, 489, 543
- Evans & Kochanek (1989) Evans, C. R., & Kochanek, C. S. 1989, ApJ, 346, L13
- Frank & Rees (1976) Frank, J., & Rees, M. J. 1976, MNRAS, 176, 633
- Gezari et al. (2008) Gezari, S., et al. 2008, ApJ, 676, 944
- Greiner et al. (2000) Greiner, J., Schwarz, R., Zharikov, S., & Orio, M. 2000, A&A, 362, L25
- Greiner et al. (2008) Greiner, J., et al. 2008, PASP, 120, 405
- Grupe et al. (1999) Grupe, D., Thomas, H.-C., & Leighly, K. M. 1999, A&A, 350, L31
- Immler & Lewin (2003) Immler, S., & Lewin, W. H. G. 2003, SNe and GRBs, 598, 91
- Kormendy & Richstone (1995) Kormendy, J., & Richstone, D. 1995, ARA&A, 33, 581
- Komossa & Bade (1999) Komossa, S., & Bade, N. 1999, A&A, 343, 775
- Komossa (2002) Komossa, S. 2002, Reviews in Modern Astronomy, 15, 27
- Komossa et al. (2004) Komossa, S., et al. 2004, ApJ, 603, L17
- Li et al. (2002) Li, L.-X., Narayan, R., & Menou, K. 2002, ApJ, 576, 753
- Lodato et al. (2008) Lodato, G., King, A. R., & Pringle, J. E. 2008, arXiv:0810.1288
- Magorrian et al. (1998) Magorrian, J., et al. 1998, AJ, 115, 2285
- Marconi & Hunt (2003) Marconi, A., & Hunt, L. K. 2003, ApJ, 589, L21
- Narsky (2000) Narsky, I. 2000, Nucl. Inst. and Methods in Physics Research A, 450, 444
- Predehl et al. (2006) Predehl, P., et al. 2006, Proc. SPIE, 6266,
- Quintana & de Souza (1993) Quintana, H., & de Souza, R. 1993, A&AS, 101, 475
- Rees (1990) Rees, M. J. 1990, Science, 247, 817
- Reiprich & Böhringer (2002) Reiprich, T. H., Böhringer, H. 2002, ApJ, 567, 716
- Renzini et al. (1995) Renzini, A., et al. 1995, Nature, 378, 39
- Tanaka & Shibazaki (1996) Tanaka, Y., & Shibazaki, N. 1996, ARA&A, 34, 607
- Schlegel et al. (1998) Schlegel, D. J., Finkbeiner, D. P., & Davis, M. 1998, ApJ, 500, 525
- Wang & Merritt (2004) Wang, J., & Merritt, D. 2004, ApJ, 600, 149