GEMINI 3D spectroscopy of BAL+IR+Fe II QSOs:
II. IRAS 045052958 an explosive QSO with hypershells
and a new scenario for galaxy formation and galaxy end
Abstract
From a study of BAL + IR + Fe ii QSOs (using deep Gemini GMOS-IFU spectroscopy) new results are presented, for IRAS 045052958. Specifically, we have studied in detail the outflow (OF) process, at two large galactic scales: (i) two blobs/shells at radius r 1.1 and 2.2 kpc; and (ii) an external hypergiant shell at r 11 kpc. In addition, the presence of two very extended hypergiant shells at r 60–80 kpc is discussed.
From this GMOS study the following main results were obtained: (i) For the external hypergiant shell the kinematics GMOS maps of the ionized gas ([O ii], [Ne iii], [O iii], H) show a small scale bipolar OF, with similar properties to those observed in the prototype of exploding external super shell: NGC 5514. (ii) Three main knots –of this hyper shell S3– show the presence of a young starburst. (iii) The two internal shells show OF components with typical properties of nuclear shells. (iv) The two blobs and the hyper shell are aligned at PA 131∘ showing bipolar OF shape, at 10–15 kpc scale. In addition, the more external shells (at 60–80 kpc scale) are aligned at PA 40∘ with also bipolar OF shape (perpendicular to the more internal OF). (v) A strong blue continuum and multiple emission line components were detected in all the GMOS field.
The new GMOS data show a good agreement with an extreme + explosive OF scenario for IRAS 04505-2958; in which part of the ISM of the host galaxy was ejected (in multiple shells). This extreme OF process could be also associated with two main processes in the evolution of QSOs: (i) the formation of companion/satellite galaxies by giant explosions; and (ii) to define the final mass of the host galaxy, and even if the explosive nuclear outflow is extremely energetic, this process could disrupt an important fraction of the host galaxy. Finally, the generation of UHE cosmic rays and neutrino/dark–matter –associated with HyNe in explosive BAL + IR + Fe ii QSOs– is discussed.
keywords:
quasars: absorption lines – galaxies: individual (IRAS 04505-2958) – ISM: bubble – galaxies: starburst1 INTRODUCTION
There is increase observational evidence confirming that galactic outflow (OF), broad absorption line (BAL) processes, super/hypernova (SN/HyN) explosions and the associated shells play important roles in galaxy and QSO evolution and formation (specially at high redshift, in the young universe; see Frye, Broadhurst, Benitez 2002; Steidel et al. 2000; Taniguchi & Shioya 2000; Dawson et al. 2002; Ajiki et al. 2002; Iwamuro et al. 2002; Maiolino et al. 2003, 2004a,b; Lípari et al 2005a; Lípari & Terlevich 2006; Smith et al. 2007, 2008).
At low z, HST images and 3D spectroscopic data of the
interesting class of composite BAL + IR + Fe ii QSOs
shows in practically all of these objects “giant and
shells with circular–symmetric shape in the external borders
(with their centre at the
position of the nucleus)”; which are associated with
strong OF processes and giant explosive events (see for details
Lípari et al. 2003, 2005a, 2007a,b, 2008, 2009).
1.1 Evolutionary IR Colour-Colour Diagram
The IR colour-colour diagram is an important tool to detect and discriminate different types of activity in the nuclear regions of galaxies. Thus this diagram is also important for the study of possible links between different phases of galaxy and QSO evolution. Using this IR colour-colour diagram [ vs. ], Lípari (1994) found that the IR colours of 10 extreme IR + Fe ii QSOs are distributed between the power law (PL) and the black-body (BB) regions: i.e., the transition area. From a total of 10 IR transition IR + Fe ii QSOs four systems show low ionization BALs. Therefore, we already suggested that low ionization BALs + IR + Fe ii QSOs could be associated with the young phase of the QSO evolution.
Using the data base of more than 50 IR mergers and IR QSOs with OF and galactic winds (GW), Lípari et al. (2005a; their Fig. 15) showed the IR energy distribution for IR mergers and IR QSO with OF. This diagram shows:
-
1.
All the IR mergers with low velocity OF and starburst are located very close to the BB area.
-
2.
The standard QSOs and radio QSOs are located around the PL region.
-
3.
All the BAL + IR + Fe ii QSOs are located in the transition region, in a clear sequence: from Mrk 231 (close to the BB area) IRAS 07598+6508 IRAS04505–2958 IRAS 21219-1757 IRAS/PG 17072+5153 and IRAS 14026+4341 (close to the PL area) standard QSOs.
The IR Diagram and the BAL system in IRAS 04505-2958:
Using this IR colour-colour diagram, Lípari et al. (2005a; their Fig. 15), found the BAL system in IRAS 045052958. For the BAL detection we used the fact that IRAS 04505-2958 is located exactly in the sequence of BAL + IR + Fe ii QSOs: between the BAL QSOs IRAS 07598+6508 and IRAS 21219-1757/IRAS 17072+5153.
The spectra of IRAS 04505-2958 show: (i) clearly BAL system, and (ii) strong Fe ii emission. Moreover, several authors already showed that the dominant IR source (IRAS 04505-2958) is likely associated with the QSO (see Section 11, for a detailed discussion about this point).
The BAL system in IRAS 04505-2958 is relatively narrow and very similar to those detected in Mrk 231. The standard definition of BAL QSOs (Weymann et al. 1991) is based in the measurement of the equivalent width of the C iv1550 resonance absorption line system (called balcity index: BI). Hall et al. (2002) proposed a less restrictive index to include a wider range of line widths.
More recently, Hamann & Sabra (2003) strongly advocated the use of simple quantitative indices (for BAL systems), and they proposed the following definition: BAL QSOs have continuous absorptions 2000 km s-1. The UV HST-FOS spectra of the QSO-core of IRAS 04505-2958 (see Fig. 8c) clearly shows that the C IV1550 absorption fits this criteria. Since the absorption start at 1986 Å, and the continuous absorptions reach at least 1973 Å: thus the range of continuous absorptions is 2515 km s-1.
1.2 BAL + IR + Fe ii QSOs and Hypernova
Some of the observational results obtained for nearby BAL QSOs, such as extreme IR and Fe ii emission, strong blue asymmetry/OF in H, radio quietness, and very weak [O iii]5007 emission (Low et al. 1989; Boroson & Meyers 1992; Lípari et al. 1993, 1994, 2003, 2005a; Turnshek et al. 1997), can be explained in the framework of the starburst + AGN + OF scenario. In our study of Mrk 231 and IRAS 0759+6559 (the nearest extreme BAL + IR + GW + Fe ii QSOs), we detected typical characteristics of young QSOs with extreme nuclear starburst. In particular, for Mrk 231 we found evidence that the BALs systems are associated with the composite nature of the nuclear regions: i.e., OF generated by explosive SN events and the radio-jet (Lípari et al. 2005a, 2009; Punsly & Lipari 2005).
For BAL + IR + Fe ii QSOs we suggested that these QSOs could be young, and composite QSOs at the end phase of an extreme starburst. At the final stage of an “extreme starburst”, i.e. type ii SN/HyN phase ([8–60] yr from the initial burst; Terlevich et al. 1992, 1993) powerful galactic winds, super/hypergiant galactic shells, BAL systems, extreme Fe ii emission, large amount of dust, and strong IR emission can appear (Lípari & Terlevich 2006; Lípari et al. 2003).
The first starburst phase (0–3 106 yr: which is dominated by hot main sequence stars with Hii regions) is associated with the presence of large amount of dust and extreme IR emission (Terlevich et al. 1993; Franco 2009, private communication).
Hypernovae in IR QSOs:
Theoretical works suggested that type ii SN/HyN generate the blowout phase of the supergiant shells and bubbles (Norman & Ikeuchi 1989). However, in dusty nuclear regions of IR QSOs and mergers + shells (with 10-1000 mag; see Genzel et al. 1998), the presence of type ii SNe/HyNe could be detected only for the nearest IR merger and QSO: Arp 220 and NGC 7469. Which were detected using the largest –very long baseline– radio interferometry (VLBI) array (see Lonsdale et al. 2006; Parra et al. 2007; Colina et al. 2001).
A very interesting point about the radio-SN/HyN found in Arp 220 and NGC 7469 is that almost all these HyNe are of the type iin (i.e., their progenitors are massive stars, which explode in a dense circumstellar medium generated by their stellar wind). These unusual highly luminous core-collapse radio-SNe/HyNe are implying a different stellar initial mass function (with a large number of massive stars) in the nuclei of IR QSOs and mergers.
1.3 Shells in BAL + IR + Fe ii QSOs
Using Gemini, La Palma-WHT and HST observations we are studying shells associated to outflowing “shocked” material. Which have properties very different to ring and arcs associated with tidal tails and loops in galactic collisions.
3D high resolution spectroscopic data give clear evidences of strong OF processes; mainly from the study of multiple emission line components, kinematics maps and emission line ratios plus colour maps with structures associated with shocks (Lípari et al. 2004a,b,d, 2005a, 2006, 2007a,b, 2008, 2009)
The presence of multiple concentric expanding supergiant shells in young and composite BAL + IR + Fe ii QSOs (specially shells with their centre at the position of the nucleus and with highly symmetric circular external–borders) could be associated with giant symmetric explosive events (Lípari et al 2003, 2005a, 2007a,b). Moreover, only an explosive scenario could explain the exponential shape of the variability curve observed in the BAL system-iii of Mrk 231 (Lípari et al. 2005a, 2009).
Furthermore, we found –for IR QSO and Mergers– in the shells of Mrk 231 and NGC 5514 plus in the nuclei of PG 1535+547, IRAS 01003-2238 and IRAS 22419+6049: spectral features of massive WR stars and OF. These WR stars are progenitors of core–collapse super and hypernova. Theoretical works suggested that SNe/HyNe from massive progenitors are probably the only objects that could generate the rupture phase of the bubbles, in the QSOs nuclei and in the main knots of the shells (Norman & Ikeuchi 1999; Tomisaka & Ikeuchi 1988).
Thus, “circumnuclear and external shells and arcs” could be associated with: (i) the final phase of the galactic–wind, i.e., the blowout of the galactic bubbles (Tomisaka & Ikeuchi 1988; Norman & Ikeuchi 1989; Suchkov et al. 1994); and (ii) galaxy collisions: i.e., tidal tails, rings, loops, etc. For distant QSOs (and even for some nearby QSOs/galaxies) it is difficult to discriminate between these two types of structures. However, it is well known that the velocity fields of mergers and galaxies in interaction show emission line components with difference of velocities V 500-600 km s-1; and in extreme OF the multiple components show diferences of velocities V 700 km s-1. Theoretical results obtained for galactic wind –associated with strong starbursts– show multiple OF components with even V 2000 km s-1 (Suchkov et al. 1994). This is one of the more clear difference between these two types of shells and arcs.
1.4 IRAS 04505-2958
The mid and far IR emission of IRAS 04505-2958 was associated with a luminous quasar, at z 0.286, with L 3.55 1012 L⊙ and M –25.8 (de Grijp et al. 1987, 1992; Low et al. 1988, 1989; Hutching & Neff 1988; Lípari et al. 2003, 2005a, 2007a,b, 2009; Lípari & Terlevich 2006; Kim et al. 2007; Zhou et al. 2007; Letawe, Magain & Courbin 2008).
The first optical images and spectroscopy of this IR source (obtained by Hutching & Neff 1988 and Low et al. 1989) showed a bright QSO, a close foreground G star (at 2′′ to the NW, from the QSO) plus a possible tidal tail to the SE (also at 2′′, from the QSO). HST WFPC2 images by Boyce et al. (1996) show that the possible SE “tail” is a complex structure. They suggested that this structure could be associated with a galaxy with ring shape, which is interacting with the QSO host galaxy. Some authors suggested that the possible ring galaxy could be the main source of ultraluminous IRAS emission, instead of the QSO (Canalizo & Stockton 2001; Magain et al. 2005; Merrit et al. 2006; and others).
From a detailed study of IR QSOs and mergers with strong OF, BALs and Fe ii emission (using HST morphological and 3D spectroscopic data) Lípari et al. (2003, 2005a, 2007a,b, 2009) suggested that the SE tail/ring structure –in IRAS 04505-2958– could be a very large scale shell, with an extension of 20–30 kpc. Which could be associated to an extreme nuclear OF process. In the present paper, a strong starburst was detected in this shell. Thus, probably the observed IRAS emission could be associated with the QSO plus the shell. IRAS 04505-2958 was already included in our published data base of BAL + IR + Fe ii QSOs (Lípari et al. 2005a; see also Lípari et al. 2003, 2007b, 2009; Lípari & Terlevich 2006).
From a study of host galaxies in a sample of 17 QSOs, Magain et al. (2005) found –from this sample of QSOs– that only in the case of the QSO HE 0450-2958 the host galaxy was not detected. They suggested that the host galaxy of this QSO could be dark or absent (i.e., a naked QSO). Several authors analysed the theoretical scenarios for a naked QSO in IRAS 04505-2958 (Haehnlet, Davies & Rees 2005; Merrit et al. 2006; Hoffman & Loeb 2006). In addition, Merrit et al. (2006) derived the mass of the super massive black hole (SMBH) of the QSO, considering that this QSO is a high luminosity version of narrow line Seyfert 1 AGNs. They obtained a low value for the mass of the SMBH, thus they suggested that the host galaxy of this QSO could be less massive and less luminous than the previously assumed values.
Thus, from different points of view IRAS 04505-2958 is one of the more interesting QSO. Throughout the paper, a Hubble constant of H0 = 75 km s-1 Mpc-1 will be assumed. For IRAS 04505-2958 we adopted the distance of 1144 Mpc. This distance was obtained from the redshift of the narrow emission lines (see Section 5): with a mean value of redshift z = 0.2860 and cz = 85800 10 km s-1 (the angular scale is 0.1550 pc).
2 THE PROGRAMME AND EXPLOSIVE MODEL OF BAL + IR + FE II QSO
In order to study and discuss the GMOS results obtained for IRAS 04505-2958 it is important to summarize –previously– some observational and theoretical results obtained in the programme of BAL + IR + Fe ii QSOs, and in the study of explosive models for QSOs.
In our observational study of BAL + IR + Fe ii QSOs and IR
mergers/QSOs with OF we have combined high resolution HST images
and 3D spectroscopic data (using Gemini+GMOS, La Palma William
Herschel Telescope+Integral and Calar Alto+PMIS) for:
(I) Nearby IR QSOs and mergers with OF + shells. For NGC 5514, Arp 220,
NGC 2623, NGC 3256, and others.
(II) Nearby BAL + IR + Fe ii QSOs. For Mrk 231, IRAS 045052958,
IRAS 17072+5153, IRAS 07598+6508, IRAS 14026+4341, IRAS 21219-1757, etc.
(III) BAL + IR + Fe ii QSOs at medium and high redshift . For SDSS 030000.58+004828.0, SDSS 143821.40+094623.2 (both at z 0.5), and Sub-mm low ionization BAL SDSS-QSOs (at z 2.0).
The general goal of these observational programmes is to study the kinematics,
physical conditions and morphology of the gas and the stars in
BAL + IR + Fe ii QSOs. In Paper I, we have explained the
particular goals of these programme, which can be summarized as
follows:
(i) To study the physic of composite OF and BAL processes: Those associated with (a) supergiant explosive events, likely generated by Hyper Novae and multiple SNe; and (b) bipolar OF probably generated by sub-relativistic jets.
(ii) To investigate the role of hypergiant explosive events in the formation and end of galaxies: Specially, to study the effect of super/hyper explosive events in the formation of companion and satellite galaxies and also in the host galaxies of BAL QSOs.
(iii) To analyze the role of HyN in the generation of ultra high energy CR and Neutrinos: We have a special interest to study the Astrophysical consequeces of one the main component of the explosive model for QSOs: the HyN explosions and their role in the posible generation of CR and Neutrino. In addition, the observational data of explosive BAL + IR + Fe ii QSOs could help to test the different theoretical models for the generation of CR and Neutrinos.
2.1 Explosive Model for QSOs: the interaction Black Hole & Starburst
An evolutionary, explosive and composite model was proposed for QSOs and the formation and evolution of galaxies. This scenario involves: a SMBH, a nuclear starburst (SB), an extreme OF and an accretion region (Lípari & Terlevich 2006; Lípari 1994; Lípari et al. 1994, 2003, 2005a, 2007a,b, 2008, 2009). This model is based –in part– in the main evolutionary sequences of IR mergers, IR QSOs, elliptical galaxies, etc derived from the study of the IR colour-colour diagram.
In this scenario a bi-parametric evolutionary model for AGNs was proposed. Intrinsic parameters like the BAL, Fe ii/BLR intensity, NLR size and luminosity, IR emission and radio luminosity, all evolve with a time scale of less than yr. Young AGNs are obscured BAL and strong Fe ii + IR emitters with relatively narrow line BLR and a compact and faint NLR.
In this model, IR mergers fuel and generate extreme star formation processes and AGNs, resulting in strong dust/IR emission and large number of SN and HyN events (likely located in starburst rings or toroids). The more energetic of these explosives events, will generate super/hypergiant expanding shells, bubbles and extreme OF processes.
Giant Explosions Associated with the Interaction of
SMBH + Starburst:
In general, we have suggested that in composite QSOs and AGNs the interaction –in the nuclear regions– of four main processes: the star formation process, the SMBH/AGN, OF and the accretion process (of the ISM gas) could generate special condition –in the accretion regions– for the formation of very massive stars and the associated giant explosive events, i.e. hypernovae.
More specifically, a theoretical study of this composite scenario was performed by Collin & Zahn (1999). They developed a model for the outer –gravitationally unstable regions– of accretion disks around SMBHs of 106–1010 M⊙ and primeval abundance. They studied the evolution of the star formation in a gaseous marginally disk showing that unstable fragments collapse rapidly to compact objects (mainly protostars). Which then accrete at high rates. In less than 106 yrs they acquire a mass of a few tens of M⊙ (according to the process suggested by Artymowicz et al. 1993). These massive stars explode as SNe/HyNe. The shells of SNe/HyNe break out of the disk producing very strong OF. The disk is able to support a large number of massive stars and SN/HyN. In addition, the giant SN generate neutron stars, which can undergo other high rate accretion process: leading to other very powerful HyN explosions.
Then, in a second step, they assume that the region of the periphery of
the disk provide a quasi stationary mass inflow during the lifetime of
quasars (i.e. 108 yrs). The whole mass transport is ensured
by the SN/HyN, inducing a transfer of angular momentum to the exterior.
Low and Extreme Velocity OF:
Lípari et al. 2005a, 2004a,b, 2003) present a data base with the main
properties of more than 50 IR mergers and IR QSOs with OFs/galactic winds.
Ussing this data base two interesting results were found:
(i) “Low velocity OF” (LVOF,
700 km s-1, Lípari et al. 2003, 2004a,b, 2005a) were found only
in IR mergers with Starburst and LINER properties.
This result is consistent with those obtained by Lutz, Veilleux & Genzel
(1999) and Veilleux, Kim, & Sanders (1999): they detected that the main
source of ionization in Luminous IR Galaxies and Ultra Luminous IR Glaxies
–derived from ISO, optical and near IR polarimetry observations–
is LINERs associated with starbursts and shocks (originated in
galactic winds).
(ii) “Extreme velocity OF” (EVOF, 700
km s-1) were found only in IR QSOs/AGNs with composite nuclear source:
AGN/QSO + Starburst.
Thus, we suggested that the interaction between QSOs/AGNs and Starburst
could generate extreme velocity OF (associated with giang explosive/HyN
events).
Strong Fe ii emission:
In the explosive and composite model for QSOs/AGNs, the observed properties of QSOs with Fe ii emission can be understood as an evolutionary sequence, in which the observed differences between strong and weak Fe ii emitters and the observed correlations with Fe ii are related –at least in part– to evolutionary changes in the SN, compact SNR activity and the development of the OF + NLR.
In the composite model, the BLR could be produced –in part– in compact SNR (cSNR) and the observed emission lines are the product of reprocessing of shock radiation by two high density thin shells and the ejecta (Terlevich et al. 1992). In this model the abundances of the ionized gas emitting the BLR lines are the abundances of the envelope of the star and the SN ejecta and not the abundances of the ISM.
In addition, Lípari (1994) and
Lawrence et al. (1997) already proposed that the nuclear OF is a main
process, that could explain some of the Fe ii correlations and
properties, observed in AGNs and QSOs.
More recently,
using our database of IR QSOs with galactic winds and OF we
found a correlation between the Fe ii/H vs.
velocity of OF (see Fig. 30 of Lípari et al.
2004d). We suggested that a probable explanation for the link between
the extreme Fe ii emission and the extreme velocity OF is that
both are associated to the interaction of the star formation processes
and the AGN, that generate extreme explosive and HyN events.
Thus, from our programme of observational and theoretical studies of the evolution of IR QSOs and galaxies, we suggested the following sequences and evolutionary–links:
IR merger + starburst + GW IR + BAL + Fe ii + shells QSOs (at the end phase of a starburst: with SN/HyN) standard QSOs and ellipticals galaxy remnants.
2.2 Explosive Model for QSOs: Narrow Line AGNs.
Narrow line Seyfert 1 are AGNs characterized by optical spectra with: narrow H-Balmer lines (500 FWHM 1500 km s-1), strong or extreme optical Fe ii emission (Fe ii4570/H 1), and weak [O iii]5007 ([O iii]5007/H 3). See for more details Osterbrock & Pogge (1985); Halpern & Oke (1987); Goodrich (1989).
Lípari (1994) found that the prototypes of narrow line Seyfert 1 AGNs (I Zw 1, Mrk 507 and Mrk 957/5C 03.100) show –in the IR colour colour diagram– composite and transition properties. Moreover, he found that all the NLS1 of the sample are located in a second sequence of transition AGNs/NLS1s. This sequence is similar (parallel) to that detected for transition luminous BAL + IR + Fe ii QSOs, but with lower values of (60,25) and starting in the starburst region (the sequence of transition QSOs start in the area of ultra luminous IR galaxies). Mrk 507 and Mrk 957/5C 03.100 are located in the sequence of transition-NLS1 and inside the starburst area (of this IR diagram).
Thus, several authors suggested: (i) a link between NLS1 and IR emission + BAL + starburst systems; and (ii) that composite and transition NLS1 could be young systems with a very high rate of accretion in their super massive BH (Lípari 1994; Lawrence et al. 1997; Brandt & Gallagher 2000; Mathur 2000a,b; Boller et al. 1996, 1993; Boroson 2002; Lípari & Terlevich 2006; Komossa 2008; and others).
From the theoretical point of view, Lípari & Terlevich (2006) already studied the main steps for the formation and evolution of the NLR in a strong galactic wind OF-process, which is associated with a luminous nuclear starburst + AGN. In this evolutionary explosive model the observed line ratios, FWHM and size of the NLR evolve on time scales comparable to the time scale for the wind development. This time scale will depend on the rate of energy input, size of the SN region and on the details of the gas distribution.
Thus, from our observational and theoretical results (of IR QSOs and mergers with OF) we suggested that young QSOs/AGNs –with relatively narrow lines– will evolve:
from Narrow Line young BAL + IR + Fe ii QSOs/AGNs Broad Line standard QSOs/AGNs.
2.3 Theory of Galactic Winds and Shells (generated by SNe/HyNe)
Galactic winds and outflows have been detected in starburst and Seyfert/AGN galaxies (see Heckman et al. 1987, 1990, 2000; Veilleux et al. 2002). IR QSOs and mergers often show strong and extreme nuclear starbursts, with very powerful galactic winds/OF (Heckman et al. 1987, 1990, 2000; Lípari et al. 1994, 1997, 2000, 2003, 2004a,b,c,d, 2005a, 2008, 2009).
The understanding of galactic winds associated with starbursts and explosive events was improved by the use of theoretical and numerical models (see Strickland & Stevens 2000; Suchkov et al. 1994, 1996; Mac Low, McCray & Norman 1989; Tomisaka & Ikeuchi 1988). Theory suggests four main phases for GWs associated with starbursts (Heckman et al. 1990; Lehnert & Heckman 1995, 1996):
-
•
Phase I: A GW results when the kinetic energy of the ejecta supplied by multiple supernovae and winds from massive stars is high enough to excavate a cavity in the centre of a starburst. At this point the kinetic energy is converted into thermal energy.
-
•
Phase II: As the bubble expand and sweeps up the ambient gas, it will enter the ‘radiative phase’ (Castor, McCray & Weaver 1975). The bubble will then collapse –due to radiative cooling– into a ‘thin shell’.
-
•
Phase III: After the shell was formed, its evolution is strongly dependent on the input physics. If the cooling rate in the interior is high, then the expanding bubble could stop the expanding process (Tomisaka & Ikeuchi 1988).
-
•
Phase IV: If other probable dynamical and thermal conditions are considered (e.g. Suchkov et al. 1994; MacLow et al. 1989), the shell can ‘break up’. After this break up the host interior become a freely expanding wind, and the bubble then ‘blows out’. In the blow out phase the optical emission comes from obstacles, such as clouds and shell fragments, which are immersed and shock–heated by the OF.
Tenorio-Tagle et al. (1999, 2003a,b, 2005, 2006); Silich et al. (2004, 2005, 2008); Tenorio-Tagle & Bodenheimer (1988); Heiles (1987, 1992) give further details and references of theoretical and observational studies of giant shells, bubbles and rings, associated with multiple explosion of type ii SN/HyN.
Role of SN/HyN in the generation of Super Shells:
Theoretical studies suggested that mainly type ii SN/HyN generate the blowout phase of the supergiant bubbles (Norman & Ikeuchi 1989; Suchkov et al. 1994; Strickland & Stevens 2000). The presence of Wolf Rayet features in IR QSOs (in their nuclei and shells) is indicative of a large number of massive stars, which are one of the main progenitor o type ii SN. Several groups detected these WR features in the nuclei and shells of IR QSOs and IR mergers (Armus et al. 1988; Conti 1991; Lípari et al. 1992, 2003, 2004d, 2005a, 2009). We note that the highest value of WR emission known in a WR galaxy or QSOs was detected in a ultraluminous IR QSO with extreme OF: IRAS 01003-2238 (see Armus et al. 1988; Lípari et al. 2003).
In the last decade, interesting observational and theoretical results were found in the field of giant SN/HyN. Specifically, HyN were detected associated with gamma ray bursts (GRB), radio-HyN in nearby IR mergers and QSOs + shells (in Arp 220, NGC 7469), HyN associated with extreme massive stars like Eta Carinae (SN/HyN 2006gy, SN/HyN 2006tf), etc. From the theoretical point of view, several groups developed interesting models that even explain –for HyN– their observed luminous light curves, broad emission line spectra and the strong radio plus gamma ray emissions (see for references Nomoto et al. 2008, 2007a,b,c, 2006). We already explained that HyN is one of the main components in the explosive and composite model for BAL + IR + Fe ii + shells QSOs. This theme –the role of HyN, specially in explosive BAL QSOs– will be analysed and discussed in details in Section 14.
2.4 Previous Explosive Models:
The presence of extreme explosions, OF and galactic-winds –associated mostly to extreme star formation processes– must be considered in the develope of theoretical models for galaxy and QSO formation and evolution. More specifically, 3 main theoretical explosive models were already proposed:
-
1.
Ikeuchi (1981) suggested that QSOs were formed and they exploded mainly at the cosmological redshift Z 4. The shock waves propagate through the gaseous medium generated cooled shells (at the shock fronts). Which are split into galaxies of mass of 1010-11 M⊙.
-
2.
Ostriker & Cowie (1981) have proposed a galaxy formation picture in which (after redshift 100) small seed perturbation are supposed to collapse, giving rise to a explosive release of energy from the deaths of the first generation of stars (Population iii). This energy drives a blast wave into the surrounding gas. Thereby sweeping up a shell of shocked material, which eventually cools. These cool shells are split into galaxies
-
3.
Berman & Suchkov (1991) proposed a hot/explosive model for galaxy formation. They suggested that the period of major star formation of protogalaxies (or even giant galaxies) is preceded by an evolutionary phase of a strong galactic wind. Which is driven by the initial burst of star formation that enriches the protogalaxy with metals. Thus this event revert from a process of contraction to expansion. Specifically, the result of this process is the ejection of enriched material from the outer part of the protogalaxy, while the inner part, after a delay of few Gyr, finally contract and cools down to form the galactic major stellar component.
More recently, Kawakatu et al. (2003) studied the proto-QSO evolution and super massive black hole growth, using hydrodynamic models with OF. They found that a ultra luminous IR galaxy phase (in which the host galaxy is the dominant source of luminosity, i.e. IR galaxies and mergers with starbursts) precedes a galactic wind epoch: i.e., young and composite IR + OF/GW mergers and QSOs. This would be a transition state to the AGN–dominated phase (i.e. to the standard QSO phase).
Thus, this last theoretical evolutionary path is almost identical to the observational sequence found –in our programme– for BAL + IR + Fe ii QSOs (using the IR colour-colour diagram): see sub-Sections 1.1 and 2.1.
2.5 Young Low Ionization BAL + IR + Fe ii QSOs
Low et al. (1989) and Boroson & Meyers (1992) found that IR QSOs contain a 27% low-ionization BAL QSO fraction compared with 1.4% for optically selected high-redshift QSOs sample (Weymann et al. 1991). The high fraction of IR QSOs and mergers showing properties of low ionization BAL systems could be explained by the large fraction of extreme OF with multiple giant shells, detected in these IR systems. Probably these shells were originated in the starburst phase of type ii SN/HyN.
In the last decades, two main interpretation for the occurrence of BALs have been proposed: the orientation and evolution hypothesis. Observational evidence supporting the orientation hypothesis come from spectral comparison of BAL and non-BAL QSOs (Weyman et al. 1991) and polarization studies (Hines & Will 1995; Goodrich & Miller 1995). Evidence in favour of the evolution hypothesis comes largely from the high number of low ionization BALs detection in IR + Fe ii QSOs and mergers. Further support for the evolution hypothesis has been provided for radio observations of BAL QSOs, which are inconsistent with only orientation schemes (Becker et al. 2000, 1997).
Recently, from a study of a very large sample of 37644 Sloan Digital Sky Survey (SDSS) QSOs, from the third Data Release (DR3) and for all redshift (in the range: 0 z 5): White et al. (2006) found that the radio properties of the rare class of low ionization BALs QSOs are different to the group of non-BAL QSOs + high ionization BAL QSOs, at all redshift. They suggested that this result could be explained in the frame work of an evolutionary scenario for BAL QSOs, in close agreement with the model proposed by Lípari & Terlevich (2006).
Low Ionization BAL QSOs at Very High Redshift:
Maiolino et al. (2004a,b, 2003) presented near-IR spectra of eight of the more distant QSO (at 4.9 z 6.4). Half of these QSOs are characterised by strong UV BAL systems (at C iv, Mg ii, Si iv, Al iii lines): i.e. mainly low ionization BAL QSOs. Although the sample is small, the large fraction of BAL QSOs suggests that the accretion of gas, the amount of dust and the presence of OF processes are larger (in these objects) than in standard QSO at z 4.0. They also suggested that the very high amount of dust was generated by early explosions of giant SNe (Maiolino et al. 2004b).
Dietrich et al. (2002) and Barth et al. (2003) discussed that in order to obtain a good fit of the UV emission lines Mg ii + Fe ii in very high redshift QSOs, they need to include a strong blushifted component (they explain that this component was used without a physical explanation). In particular, Barth et al. (2003, their Fig. 2) show this strong blue OF component in the Mg ii line, for the Fe ii-QSO SDSS J114816.64+525150.3. This object is one of the younger known QSO, with a redshift z = 6.4. A similar OF component was found (by us), in the line Mg ii, in the extreme Fe ii + IR QSO: PHL 1092.
Lípari et al. (2005a) already suggested that this type of blue component observed in the Mg ii emission line –in very high redshift QSOs and with very high OF velocities– is associated with extreme OF processes. Thus, the results obtained from QSOs at very high redshift are very similar to our results for BAL + IR + Fe ii QSOs at low redshift. Moreover, we have already point out the inportance of the detection of a high fraction of QSOs with BAL system in young IR + GW/OF + Fe ii + BAL QSOs at low redshift and in QSOs at very high redshift (at z 6.0; Maiolino et al. 2003, 2004a,b).
3 OBSERVATIONS
3.1 Gemini GMOS-IFU observations
The three-dimensional (3D) deep optical spectroscopy of the QSO and the 3 more internal shells of IRAS 04505-2958 were obtained during four photometric nights in October 2005, December 2005, and February 2007, at the 8.1 m telescope in Gemini South Observatory. The telescope was used with the Gemini Multi Object Spectrograph (GMOS) in the integral field unit mode (IFU; Allington-Smith et al. 2002). The spectra cover all the optical wavelength range: from 3400 Åto 9500 Å. The observations were made in photometric conditions with seeing in the ranges 0.4–0.5′′ (in the observing runs of 2005 December 25 and 26; and 2007 February 14) and 0.9′′ (in 2005 October 7, and part of 2007 February 14). For detail of each observation runs, see Table 1.
The data were obtained with the IFU in one slit mode (blue), which provide a field of 3.5 5.0′′ ( 20 30 kpc) for the science data. With this observing configuration, the GMOS IFU is comprised of 750 fibres; each spans a 02 hexagonal region of the sky. Five hundred fibres make up the 3.5 5.0′′ science field of view; and 250 fibres make up a smaller, dedicated sky field, which is fixed at 1′ of distance of the science position (Allington-Smith et al. 2002).
We used the following gratings in GMOS: R831, B600 and R400, which have 40, 120 and 200 km s-1 of spectral resolutions, respectively. The GMOS Y-axis was aligned at the position angle PA 131∘; which is the direction of the hypergiant shell (from the QSO-core).
Very deep 3D spectra were obtained for the observations of the R400 and B600 gratings, for this bright QSO. The typical exposure time –for R400 and B600– were of 1 hour (see Table 1). These very deep observations were performed in order to study: (i) multiple components in the OF process, and (ii) the stellar population in the knots of the expanding shells.
3.2 Reduction and Analysis of the Gemini GMOS–IFU data
The following software package were used to reduce and to analyse the GMOS data: R3D + EURO3D111R3D is the imaging analysis software facility developed at Calar Alto Observatory (Sanchez & Cardiel 2005; Sanchez 2006; Sanchez et al. 2006a,b). EURO3D visualization tool is a software package for integral field spectroscopy, developed by EURO3D Research Training Network (Sanchez 2004); IRAF222IRAF is the imaging analysis software developed by NOAO; GEMINI333GEMINI is the reduction and analysis software facility developed by Gemini Observatory; and STSDAS444STSDAS is the reduction and analysis software facility developed by STScI.
The 3D GMOS spectroscopic observations were reduced using a modified version of R3D software package (Sanchez & Cardiel 2005; Sanchez 2006). This reduction process was performed following the standard procedure: (1) the data were bias subtracted; (2) the location of the spectra were traced using continuum lamp exposures obtained before each target exposure; (3) the fiber-to-fiber response at each wavelength was determined from a continuum lamp exposure; (4) wavelength calibration was performed using arc lamp spectra and the telluric emission line in the science data; (5) the sky background spectrum was estimated before subtraction by averaging spectra of object free areas; (6) the calibration flux was done using the observation of standard stars; and a total of 11000 spectrum –of IRAS 045052958 and sky– were reduced and calibrated, using this technique (see for more details Lípari et al. 2009, hereafter Paper i).
To generate two-dimensional maps of any spectral feature (intensity, velocity, width, etc.) the IDA software tool were used (García-Lorenzo, Acosta-Pulido, & Megias-Fernandez 2002). The IDA interpolation is performed using the IDL standard routine TRIGRID, which uses a method of bivariate interpolation and smooth surface fitting for irregularly distributed data points (Akima 1978). Maps generated in this way are presented in the next Sections.
The emission line components were measured and decomposed using Gaussian profiles by means of a non-linear least-squares algorithm described in Bevington (1969). In particular, we used the software SPECFIT555SPECFIT was developed and is kindly provided by Gerard A. Kriss., and SPLOT from the STSDAS and IRAF packages, respectively. An example of SPECFIT deblending, using three components for each emission lines (H, [O iii]4959 and [O iii]5007) in IRAS 010032238, was shown in figure 2 of Lípari et al. (2003). We note that in each GMOS spectrum the presence of OF components and multiple emission line systems were confirmed by detecting these systems in at least two or three different emission lines (at H, H, H, H, [N ii]6583, [N ii] 6548, [S ii]6717/6731, [O iii] 5007, [O ii] 3727, etc).
For the study of the kinematics, the ADHOC666ADHOC is a 2D/3D kinematics analysis software developed by Dr. J. Boulesteix at Marseille Observatory. software package was also used. For the analysis of the errors/ in the kinematics, the prescriptions suggested by Keel (1996) were used.
The main parameters of the spectra (i.e., the fluxes, equivalent widths, S/N, errors/, etc) were measured and their errors analysed using different software tasks described previously: i.e. R3D, Euro-3D, Gemini-GMOS, IRAF, IDA, INTEGRAL, STSDAS, SPECFIT, GALFIT-3D, etc. In general, we follow for the analysis of the errors/, S/N, etc the mathematical algorithms described in detail by Bevington (1969) and Roederer (1963).
3.3 GMOS-IFU PSF
In Paper i, a detailed analysis of the PSF (in the GMOS-IFU data) was already performed, for the GMOS observations of Mrk 231. For the GMOS-IFU data of IRAS 04505-2958, we have performed a similar study of the PSF; specially for the spectra obtained with high spatial and spectral resolution.
In particular, the PSF was carefully obtained for the core of the QSO IRAS 04505-2958, using the H and H broad line emission. This PSF was derived using the GMOS-IFU B600 and R831 data, and for the observation obtained with the best seeing of our Gemini GMOS data (of 0.4′′ FWHM).
Using the obtained PSF the contributions of the nuclear core-PSF at spatial offset of 0.2′′, 0.4′′, 0.6′′ and 0.8′′ (from the core) were measured. We found that these contributions –at 0.2′′, 0.4′′, 0.6′′ and 0.8′′– are: 52, 11.5, 3.7 and 1.0 per cent (respectively), of the peak/core.
Therefore, from these results it is important to remark two main points:
-
•
An empirical limit for the extension of the wing of the PSF is r 1.0′′. This limit is almost the same that we found –in Paper i– from the study of the PSF for the GMOS data of the BAL + IR + Fe ii QSO Mrk 231 (with similar seeing of 0.4′′ and B600 spectra).
-
•
The results for the extension of the PSF suggest that the contribution of the PSF at offset of 0.2′′ is important: 52 per cent. Thus at this offset (0.2′′) we need to consider the contribution of the PSF-core (if it is required). For offset of 0.4′′ the contribution of the PSF-core is low: only 11.5 per cent.
3.4 HST–WFPC2 and ACS broad band images and HST/FOS spectroscopy (archive data)
Optical HST Wide Field Planetary Camera 2 (WFPC2) archival images of IRAS 045052958 were analysed, which include broad-band images positioned on the Planetary Camera (PC) chip with scale of 0046 pixel-1, using the filter F702W (6895 Å, 1389 Å, R Cousin filter).
Optical HST Advanced Camera for Surveys (ACS) archival observations were analysed, obtained with the High Resolution Channel (HRC). They include images with the filter F606W (5907 Å, 2342 Å, V Cousin filter). The scale is 0027 pixel-1.
HST FOS aperture spectroscopy of this QSO was obtained, from the HST archive (at ESO Garching). The spectra were taken with the G190H (1575–2320 Å) gratings and the blue detector. The G190H observation was made with the effective aperture of 43 14; and the spectra have a resolution of 4 Å, FWHM. A summary of the HST observations is presented Table 1.
4 Morphology of the hyper+super shells and the QSO
In this paper, we will study –using GMOS-IFU data– the multiple shells system detected in the QSO IRAS 04505-2958 (Lípari et al. 2003, 2005a, 2007a,b, 2009). Specially, we will analyze the properties and the nature of the extended object found close to the QSO. This extended and complex structure (which is located to the south-east, at a radius –from the QSO– of r 1.5′′ and r2.5′′) could be associated to a hypergiant shell (referred as S3), centered at the position of the QSO. We proposed that S3 was probably generated by nuclear explosive/HyN events, similar to those detected in Mrk 231, IRAS 17002+5153, and IRAS 07598+6508 (Lípari et al. 1994, 2005a, 2008, 2009; Lípari 1994).
Using GMOS data, the properties and the nature of two inner/nuclear shells (at r 0.2′′ and 0.4′′, 1.1 and 2.2 kpc from the QSO) will be also studied. In addition, the presence of a very extended hypergiant shells at r 15′′ (80 kpc) and a possible shell at r 10-12′′ (55–66 kpc) will be discussed. These two external shell were already reported by Hutching & Neff (1988), from CFHT data.
4.1 The four main super+hypergiant shells: HST, GMOS, and CFHT images
Figs. 1a, b, c and d present high resolution HST WFPC2 and ACS broad-band images and contours obtained in the optical wavelengths through the filters WFPC2-F702W (R) and ACS-F606W (V). These HST images show: (i) the QSO, (ii) the main supergiant galactic shell S3, which is located at a radius r of 11 kpc, from the QSO (and showing several bright knots), and (iii) a field star.
In addition, the panels of Figs. 1 show –in orange colour– the observed GMOS field (covering an area of 3550, 20 kpc 30 kpc). The GMOS frame was centered close to the middle position between the QSO and the extended shell S3 (at r 11 kpc), and at the position angle PA 131∘. These HST images (without any smoothing or filtering process) show that the QSO contours have a structure different to the HST-PSF (of the field G star). The presence of two nuclear shells could explain the structure of the QSO contours.
The deep HST WFPC2-F702W image of this QSO (Fig. 2) shows the very extended shell S3. Fig. 2 depicts that the external–border of S3 is symmetric, with circular shape, and with the centre at the position of the QSO. This plot was performed using a scale of fluxes starting from very low values of flux (thus, this figure shows almost the complete emission associated with this shell). We remark that S3 shows very extended emission, at scale of 15-20 kpc around the QSO. This is an interesting point, specially in order to explain the GMOS emission line maps (Fig. 5). These maps show H, [O iii]5007, [O ii]3727, [Ne iii]3869 emissions in almost all the observed GMOS field.
Two interesting results were already found –in the literature– in relation with the proposed hypergiant shell scenario for IRAS 04505-2958. In particular:
-
•
Hutching and Neff (1988, their Fig. 1) and Fig. 3 show the presence of an arc at r 15′′ (80 kpc, from the north to the north-east), in their CFHT R image. In addition, they show a faint possible arc at r 10-12′′ (55-66 kpc, to the south-west) with also several knots. This possible arc is located in the south-west direction: i.e., in the opposite direction (from the QSO), to the more extended arc.
Fig. 3 shows that the positions of these two faint external arcs are consistent with a bipolar OF. This external bipolar OF (at PA = 40∘) is almost perpendicular to the direction of the internal bipolar OF (at PA = 131∘, for the shell S3).
-
•
From a study of host galaxies in QSOs (by decoupling and subtracting the QSO/PSF images from HST ACS data), Magain et al. (2005) detected close to IRAS 04505-2958 a partial blob at r 0.3′′, to the north-west, without other clear evidence of the host galaxy. The spectra of this blob show the surprising result of the absence of continuum emission.
Using the HST and GMOS data (see Fig. 4, Section 5 and Table 5) we found that this partial blob is –from the morphological point of view– very similar to the multiple nuclear shells detected in Mrk 231. In addition, several areas in this blob were analysed using GMOS spectra, these data show double peaks in the main components of the emission lines (plus multiple weak blue/OF peaks), which are probably associated with two shells at r 0.2′′ and 0.4′′ (1.1 and 2.2 kpc; see Fig. 4 and Section 5). We call these nuclear shells S1 and S2, respectively.
Thus, these works suggest at least the presence of four (or five) super/hypergiant shells. Namely:
-
1.
Blobs or shells S1 and S2:
These two partial shells are located at radius r 0.2 and 0.4′′ (1.1 and 2.2 kpc), from the QSO-core. Which are more intense and clear in the north-west region. A knot and a filament were also detected at the radius of the shell S1, in the north-east and north directions, respectively. Probably, we are observing only partially these two shells by the effect of a bipolar OF process.
-
2.
Shell S3:
An extended and bright hypergiant shell –with symmetric and circular external–border– at r 2.0′′ (11 kpc, from the QSO) was already detected by Lípari et al. (2003, 2005a, 2007a,b, 2009) and Lípari & Terlevich (2006). The total extension of S3 is at least 30 kpc. This shell is observed in the south-east region, from the QSO.
We have already proposed that this hypergiant shell was generated by explosive and composite hyperwinds (Lípari et al. 2003, 2005a, 2007a,b, 2009; Lípari & Terlevich 2006). This explosive process with giant shells is similar to those observed in similar BAL + IR + Fe ii QSOs, like: Mrk 231 (Lípari et al. 2005a, 2003, 1994); IRAS 17002+5153 (Lípari et al. 2003, 2008; Lípari 1994); IRAS 07598+6508 (Lípari 1994; Lípari et al. 2003, 2008); etc.
The deep HST-WFPC2 R broad band image of IRAS 04505-2958 (Fig. 2) shows –for S3– a clear external–border with circular shape and with the centre at the position of the QSO.
-
3.
Shell S4:
The presence of an external supergiant shells at r 15′′ (80 kpc, with the centre at the position of the QSO) was already proposed by Hutching and Neff (1988). They suggested that this arc has red colour.
A wide field CFH R broad band image of IRAS 04505-2958 (Fig. 3, adapted from Hutching & Neff 1988) shows that the shell S4 has also a knotty structure. This arc is extended from the north to the NE, ending at a brighter knot. Hutching & Neff (1988) explained that this very extended arc S4 is faint but clear in the R CFHT-image. In their B CFHT-images the knots were observed, but the arc was not detected. They proposed that the arc and their knots are associated with region of strong reddening.
-
4.
Shell S5 candidates:
Fig. 3 also shows the presence of an extended weak structure with also arc shape at r 10-12′′ (55-66 kpc, from the QSO), to the south-west. We call this extended structure as a shell candidate (S5). An interesting point is that S5 is located in the opposite direction of the shell S4 (from the QSO).
Table 2 and Figs. 1b, and 4 present the location of the strong knots observed with GMOS inside of the 3 more internal super and hypergiant shells (S1, S2, and S3). In the next sub-Sections, the physical and kinematical properties of these knots –and several selected external regions– will be analysed.
Using the borders of these shells, we show in Figs. 4 and 3 the probable limits for the internal and external bipolar OFs. In particular, for the internal OF (at 10–15 kpc scale) we used the borders of the shells S1+S2 and S3 (Fig. 4), and for the external OF (at 60–80 kpc scale) the borders of S4 and S5 (Fig. 3). For these internal and external bipolar OFs (at PA = 131∘ and 040∘, respectively; which are perpendicular) the following total opening angles of 55∘ and 95∘ were measured, respectively.
For the BAL + IR + Fe ii QSO Mrk 231, we already found an interesting result at radio wavelengths in relation with the extreme OF or hyperwind + multiple symmetric shells scenario: a very extended radio emission (of 50 kpc) was detected, which is aligned with the position angle of the bipolar OF. For IRAS 04505-2958, Feain et al. (2007) found in their 6208 MHz ATCA radio data an extended radio emission with bipolar structure. This radio emission shows three peaks or lobes of radio emission, with a main peak at the position of the QSO, and two symmetric peaks (with the centre at the position of the QSO). One of these symmetric peaks is located close to S3 and the other in the opposite direction. This extended radio structure –of 20 kpc– is aligned at almost the same position angle of the internal bipolar OF or hyperwind (at PA = 131∘). Furthermore, Feain et al. (2007) found that the radio emission obeys the far-IR to radio continuum correlation, implying that the radio emission is energetically dominated by star formation activity. In particular, they detected that at least 70 per cent of the radio emission is associated with the star formation process; and the contribution from the QSO –to the radio emission– is less that 30 per cent. Therefore, the radio data of Feain et al. (2007) suggest the presence of some star formation around the QSO and/or the host galaxy. However, more recently these authors (Papadopoulos et al. 2008) suggested that the star formation process is probably located in S3, since they found that the CO J 1-0 emission is located mainly in this shell S3.
In addition, using ESO-VLT+VIMOS data, Letawe et al. (2008) found similar extended [O ii]3727, [O iii]5007 and H+[N ii] emission aligned at almost the same position angle of the internal bipolar OF (at PA = 131∘). Thus, these HST + CFHT + Radio + ESO–VLT morphological results show a good agreement with the hyperwind scenario (with multiple hyper shells).
4.2 Interesting external regions
Four interesting external regions in the GMOS field of IRAS 04505-2958 were also analysed. Two external regions (R1 and R4) are associated with two emission knots detected close to the QSO and S3, respectively. The other two external regions (R2 and R3) are located at the external border of S2 and S3, respectively. In the region R2 we found that the emission lines are very weak, thus we measured two areas -very close- in this region (R2a, and R2b). The detailed positions of all the regions are given in Table 2, and in Figs. 1b and 4.
These external regions (specially R2 and R3) were selected in order to study the extended OF process (i.e. multiple OF systems and the emission lines ratios).
4.3 High resolution GMOS maps and images
Figures 5a, b, c, and d show the [O iii]5007, [O ii]3727 [Ne iii]3869 and H emission line images, obtained from the GMOS data. These figures show strong emission lines from the QSO, the circumnuclear regions and also weak emissions from S3.
From these GMOS images or maps, we remark the following interesting features,
-
1.
The [O iii]5007 and [O ii]3727 emission line maps show strong emission from the QSO and in two filament aligned in the direction of the external regions R1 and R4. In addition, several weak emissions were observed in the area of the hypergiant shell S3.
-
2.
The [Ne iii]3869 emission line map depicts emission with similar structure of the [O iii]5007 and [O ii]3727 maps.
-
3.
The H emission map shows clear emission from the QSO and several weak knots in the circumnuclear regions.
These areas with clear emission in the maps will be analysed together with the emission lines ratios and kinematics maps.
5 Deep GMOS-IFU spectra of the hyper+super shells and the QSO
5.1 Multiple Outflow components in the QSO and the shells S1 and S2
Using the 3D GMOS spectra –of IRAS 045052958– obtained with moderate (B600, R400) and high (R831) spectral resolutions, a detailed study of multiple emission line components was performed; in order to analyse to OF process in the QSO-core and in the shells. In particular, we have studied the stronger emission lines H, H, H, H, [O iii]5007, [O ii]3727, [N ii]6583, etc; and the strong absorption lines H, H, H, etc.
In the QSO-core and the circumnuclear shells S1 and S2 (of IRAS 045052958), we found multiple and strong emission lines systems. In particular, the panels of Fig. 6 show the presence of these multiple OF systems (in the emission lines).
From this study –of multiple components for the QSO-core and circumnuclear shells S1 and S2– the following main and OF components were found:
-
1.
Main Component (MC-EMI):
In the QSO-core and the circumnuclear shells S1 and S2 –of IRAS 045052958– a strong emission line component (MC-EMI) was detected; plus several OF. The main ELC was measured and deblended using the software SPLOT (see Section 3).
In the QSO-core, for the MC-EMI a redhift Z 0.28600 (85800 15 km s-1) was measured (using the narrow [O iii]5007, [O ii]3727 emission lines).
For the study of the H-Balmer lines –in the QSO-core– the main component was decomposed in a intermediate and broad sub-components. A detailed analysis and discussion of these sub-components will be presented in Section 10.
-
2.
Blue Outflow Components (OF-EB):
We found several blue OF components, in the ionized gas. Specifically, in the strong emission lines (like H, H, H, H, H, [O iii]5007, [O ii]3727, [Ne iii]3869, etc), we found a number of 3-5 blue OF components. The range of velocities measured for these OF systems [V = V(OF) - V(MC)] is: from 300 to 3000 km s-1 (in the blue OF systems).
From these OF systems, three strong blue OF components were detected and analysed. These OF components are described in Table 3.
-
3.
Red Outflow Component (OF-ER1):
In the QSO-core and the circumnuclear shells and regions we have found a weak but clear red OF component and we have measured OF-ER1 a redhifts Z 0.291500 (87450 20 km s-1), V V(OF-ER1) - V(MC-EMI) +1650 35 km s-1.
The very high values of velocities found in the multiple emission line components (V 500 km s-1) –in the QSO IRAS 04505-2958, S1 and S2– could be associated mainly/only with an extreme and probably explosive OF process (see for details Sections 1 and 2).
5.2 Multiple OF components in the hyper shell S3
Emission Lines:
In the shell S3 –of IRAS 045052958– also strong and multiple emission lines systems were detected. In particular, the panels of Fig. 7 show the presence of these multiple OF systems (in several emission lines) in the knots of the shell S3.
From the study of multiple components –for the shell S3– the following main and OF components were detected:
-
1.
Main Component (MC-S3-EMI):
In the shell S3, for the MC-S3-EMI a redhift at Z 0.2865 (85950 20 km s-1) was obtained.
-
2.
Blue Outflow Components (OF-S3-EB):
Again we found several blue OF components in the hypergiant shell S3. In the strong emission lines, like H, H, H, H, [O iii]5007, a number of 3-4 blue OF components were found. The range of velocities measured for these OF systems is: from 300 to 1500 km s-1 (in the blue OF systems).
Three of these blue and red OF emission lines systems were observed more clearly and strong. These blue OF systems are described in Table 3.
-
3.
Red Outflow Component (OF-S3-ER1):
In the main knots of S3 we have found a strong blue OF component and we have measured OF-S3-ER1 a redhifts Z 0.295500 (87150 30 km s-1), V V(OF-S3-ER1) - V(MC-S3-EMI) +1200 45 km s-1.
Absorption Lines:
The Main Component (MC-S3-ABS):
In the region of the shell S3 –of IRAS 045052958– the presence of an interesting stellar absorption line system was already noted by Canalizo & Stockton (2001), Merrit et al. (2006) and others.
From the strong H, H, H, H, H8, and H9, absorption lines, we have measured for MC-S3-ABS a redshift similar –within the errors– to the MC-S3-EMI: i.e. Z 0.2865 (85950 20 km s-1).
In conclusion, with the spectral resolution of this study we can identify, in S3 at least 6 different emission line systems. Again –for the shell S3– high values of velocities were found in the multiple emission line components (V 500 km s-1), which could be associated with OF processes. In addition, we found that the main component of the emission and absorption lines are at the same redshift.
5.3 GMOS spectra in the QSO-core and the shells S1 and S2
QSO-core:
Fig. 8 shows the spectra of the QSO-core. Tables 4 and 9 include the values of the fluxes, FWHM and the emission line ratios for the QSO-core (for a pixel of 0.2′′).
Table 4 shows that the H-Balmer lines were fitted using different components (intermediate, broad, narrow, and OF components). This detailed fit was performed in order to study the interesting optical spectrum of the QSO-core (of IRAS 04505-2958), which shows Narrow Line Seyfert 1 AGN features. The mean value of the FWHM of the H-Balmer Emission lines (H, H, H, etc) in the QSO-core is 1050 25 km s-1; for a fit of one main component plus several OF. In Section 10 the other fits of the H-Balmer lines –using more components– will be analysed (specially their physical nature).
The value of the FWHM
of the narrow emission lines ([O iii]5007) is
630 20 km s-1 (with the peak blueshifted by -100
25 km s-1, from the peak of the Balmer H lines).
In addition,
the FWHM of the narrow line [O ii]3727) is
480 25 km s-1.
Shells S1 and S2:
Since, the supergiant shells S1 and S2 are located very close to the QSO-core (at 0.2 and at 0.4′′) we have measured very carefully the emission line systems of these two shells (using one of the best code to deblend emission lines: SPECFIT; see for details Section 3). The results of the study of the emission lines in S1 and S2 are included in Tables 5 and 9. The emission line ratios of Table 9 show –for S1 and S2– values clearly consistent with ionization associated with the QSO plus shocks (see for details Fig. 13a, b in the next Section 6).
5.4 GMOS spectra in the hyper shell S3
It is important to study in detail the main knots detected in the multiple hypergiant shell S3 with high resolution 3D spectroscopic data: since they are the best and brightest tracers of the expanding super bubbles (see Paper i, for details and references of our previous studies –using 3D-Spectroscopy– of the main knots in the expanding shells of the BAL + IR + Fe ii QSO Mrk 231 and in the IR merger NGC 5514).
Figures 9 and 10 show the individual 3D GMOS spectra of the main knots of the shell S3 for different wavelength ranges. Tables 6, 7 and 9 depict the values of the fluxes and FWHM of the emission lines, the Equivalent Width (EqW) of the absorption stellar system, and the emission line ratios, respectively (for the main knots of the shell S3).
In order to study the GMOS spectra of the main knots of the hypergiant shell we used the following technique (described in more details in Paper i): (i) first the main knots of the shell were selected, from the high spatial resolution HST WFPC2 and ACS images; (ii) using the HST offset positions –from the QSO-core– and (and the corresponding offset position in the GMOS rotate-field: and ), of all the main knots, then we selected the closest GMOS individual spectrum. Thus, the offset –in Table 2– were derived from the nearest GMOS spectra of the corresponding knot peaks. In addition, we have verified also that the nearest spectrum –corresponding to each knot– shows the strongest value of continuum and line emission (for all the area of each knot).
In addition, it is important to note that only in the very deep GMOS 3D data (with 1800 2 seconds of total exposure time, see Table 1) the spectra depict high quality, even with S/N 3 in the weak OF components of the shells. Which is required in order to study some weak knots and region of the hyper+supergiant shell S3: K1, K3 and R3.
From this detailed study of the main knots of the hypergiant shell S3 of
IRAS 045052958 (see Tables 6, 7 and 9), we remark the following
main results:
-
1.
Absorption Lines:
We detected two type of absorption spectra in the main knots of the shell S3 (see Table 7 and Fig. 9).
-
•
The spectra of the Knots S3-K1, K2, and K3 (and also the close region R4) show in the blue wavelength range weak –or even absent– absorption H-Balmer lines. Specifically, the H and H absorption are absent in these 3 knots (see Table 7).
-
•
The spectra of the Knots S3-K4 and K5 show strong absorption H-Balmer lines: from H, H, to H11 (see Table 7).
These GMOS-IFU results will be analysed in detail in Section 9 (using theoretical and observational templates of stellar populations).
-
•
-
2.
Emission Lines:
-
•
The emission spectra of the Knots S3-K1, K2, and K3 (and also the close region R4) contain very strong OF emission line components (see Table 6). These components (the OF and MC systems) show LINER properties associated with shocks plus H ii regions.
These are typical OF features associated with shocks of low and high velocities in a dense medium (similar to those observed in the OF of SNR and Herbing–Haro objects; Heckman et al. 1990; Binette, Dopita, Tuohy 1985; Canto 1984; Shull & McKee 1979).
-
•
The spectra of the Knots S3-K4 and K5 show OF and MC systems with only LINER properties associated with shocks.
-
•
In the main knots of S3 we found OF components with high values of velocities, of V –[400-1500] km s-1.
-
•
A detailed study of the emission line ratios and kinematics of these knots of S3 will be present in the next Sections.
5.5 GMOS spectra in some interesting Regions
Figs. 11 and 12 show the spectra of the selected external regions (see Table 2 and Section 4, for details about the location of each region). Tables 8 and 9 include the values of the fluxes, FWHM and emission lines ratios of these regions.
From these Figures and Tables of the selected external regions of IRAS 045052958, we remark the following results:
-
•
The spectra of the regions R1 and R4 show clearly a blue component in the continuum emission, at the wavelength ranges: [O ii]3727–H, and H + [O iii]5007.
-
•
The spectra of the regions R2a and R2b –at the external border of the shell S2– show that this blue component is weak (in the continuum emission, at the [O ii]3727–H, and H + [O iii]5007 wavelength ranges).
-
•
The spectra of the region R3 depict even a clear drop in the blue continuum emission (specially, at the [O ii]3727–H wavelength range).
Letawe et al. (2008) studied -using ESO-VLT+FORS2 Multi Slit MXU 2D-spectroscopy- three external regions, with a slit width of 1′′. They call these regions R1, R2, and R3 (in order to avoid problem of notation we will used the following notation for these areas: L-R1, L-R2, and L-R3). Their regions L-R1 and L-R2 are located relatively close to our external areas R3 and R2, respectively They found that these two regions show only emission lines, which is a similar result to that found in this paper for these areas. In addition, for the region L-R2, Letawe et al. (2008) found that the ionization is probably associated with the AGN, and we found that the ionization is mainly generated by shocks. The difference could be explained by the fact that their slit width is 1′′, and thus they are probably including a contribution from –or close– to the blobs (in these blobs our GMOS spectra –with 0.2′′ of spatial resolution– show ionization by the AGN).
6 The ionization structure of the hyper+super shells
Using the emission lines ratios (ELR) obtained from the 3D GMOS data (which cover the QSO and 3 super/hypergiant shells) we have studied in detail the ionization and the physical conditions in IRAS 04505-2958; specially in order to compare these results with those obtained previously for similar BAL + IR + Fe ii QSOs and mergers, with strong OF process.
This study was performed in two steps: first the individual GMOS spectra of the main knot of the shells and the external regions were analysed in detail using the log [S ii]/H vs. log [O i]/H and log [S ii]/H vs. log [O iii]5007/H ELR-diagrams (of physical conditions). Then the GMOS-IFU ELR maps were studied.
6.1 The emission line ratios diagram for the hyper+super shells
For the study of the physical conditions and the OF process in the shells and in several selected external regions (inside of the GMOS field, of IRAS 04505-2958), the log [S ii]6717+31/H vs. log [O i]6300/H, and log [S ii]6717+31/H vs. log [O iii]5007/H ELR-diagram were used. The first diagram is an important tools for the analysis of OF processes and associated shocks (see Heckman et al. 1987, 1990; Dopita 1995).
The panels of Figure 13a, b show these two diagrams for the 3 observed hyper+supergiant shells and the selected external regions. In Fig. 13a,b the values of emission lines ratios (for the main knots of these shells and selected external regions) were obtained from Table 9. It is interesting to remark the following main points,
-
1.
Almost all the knots and areas of the 3 observed hyper/supergiant shells (S1, S2, S3) are located in the log [S ii]6717+31/H vs. log [O i]6300/H diagram in the area of SNR + HH (i.e., the shocks area), or in the transition/composite region between SNR+HH and H ii regions. Thus in these areas the OF process play a main role.
-
2.
Some knots of the shells S1, S2, and S3, the ELRs show a position inside the SNR+HH (pure shock) area of this diagram. In particular, the following knots and areas are located in the shock region: S1-A1, S2-A1, S3-K4, S3-K5; and the external regions R1, R2a, R2b and R3. This fact is consistent with the presence of strong [S ii] and [O i] emission; and thus it is also consistent with shocks process of low velocities (Heckman et al. 1990; Dopita & Southerland 1995).
-
3.
In addition, for the shells S1, and S2 the log [S ii]6717+31/H vs. log [O iii]5007/H ELRs diagram show that the QSO/AGN is also a source of ionization (in these circumnuclear shells), together with shocks.
-
4.
The knots of the shell S3: S3-K1, S3-K2 and S3-K3 are the only knots located in the composite or transition areas between shocks and H ii regions. This result is in good agreement with the detection of starburst population in these knots (see Section 9).
-
5.
The regions R3 and R2a,b are located close to the external border of the hypergiant shell S3 and the super shell S2, respectively. Thus, their ELR are consistent with shock associated with the OF process in these shells. Furthermore, the ELR maps (see the next sub-section) also show structures associated with very large scale shocks and outflows.
6.2 Mapping with GMOS the ionization structure
Figs. 14a, b and c show the 3D maps (of 3550, 20 kpc 28 kpc, with a spatial sampling of 01) of the emission line ratios [S ii]/H, [N ii]6583/H and [O iii]5007/H. These maps were constructed using the techniques described in Section 3 and for the main component of the emission lines.
Figs. 14a, b, c show interesting features. We note the following:
-
1.
Coincident with almost the border of the more extended super and hyper shells S2 and S3, both maps show arcs and knots with high values ( 0.8) in the [S ii]/H and [N ii]/H emission line ratios (ELR).
These arcs could be associated with shock processes at the border of the super and hypergiant shells S2 and S3. Lípari et al. (2004a,d, 2005a) already discussed that the [S ii]/H map is one of the best tracer of shocks processes.
-
2.
The GMOS [N ii]/H map shows several knots in the arcs (which show high values of emission line ratio).
-
3.
The [O iii] /H map depicts several areas of high values of the ELR, associated with the circumnuclear regions and the more internal shells (S1 and S2).
Thus, in almost all the border of the shells of IRAS 04505-2958 the GMOS-IFU [S ii]/H and [N ii]/H maps show high values, which are consistent with an ionization process produced mainly by shock-heating in the outflowing gas of the expanding supergiant shells (Lípari et al. 2004a,d, 2005a; Dopita & Sutherland 1995; Dopita 1995, 1994; Heckman 1980, 1996; Heckman et al. 1987, 1990).
Similar results –ELR associated with large scale shocks– were obtained in the 3D spectroscopic studies of the OF nebula and supergiant shells/bubbles of NGC 2623, NGC 5514, Mrk 231 (Lípari et al. 2004a,d, 2005a, 2006) and NGC 3079 (Veilleux et al. 1994).
7 GMOS Map of the Blue continuum
In Paper i an interesting GMOS-IFU result was found for the BAL + IR + Fe ii QSO Mrk 231 using an optical colour map: only in the galactic wind area the colour map shows a strong blue continuum component. We have performed a similar study for IRAS 04505-2958.
For the study of the colour map of this BAL QSO, it is important to note that the spectra of the QSO-core –of IRAS 045052958– show a strong blue component in the continuum (see Fig. 8). Thus, an important point is to analyse the possible contribution of the PSF QSO-core blue continuum, to the circumnuclear regions. About this point, we have already explained in Section 3 and specially in Paper i, that the contribution of the QSO-core PSF is important only in the nearest spectra at 0.2′′ (with a contribution of 50 per cent of the PSF peak). But at 0.4′′ from the QSO-core this contribution is only of 11 per cent.
An important point regarding the quality of the GMOS colour maps is the following: for Mrk 231 this plot (Paper i) shows blue colour in the south nuclear region (from the QSO), which is exactly the area that we previously detected an extreme galactic wind, with shells. This fact could not be associated with any coincidence and/or a contribution from the QSO-core, since the optical spectra of the core of Mrk 231 show a strong red colour in the continuum (even with a very strong fall –of continuum flux– at the blue wavelength range).
In addition, the GMOS colour map and the individual GMOS spectra of Mrk 231 clearly show/confirm that the contribution from the QSO-core continuum (PSF) is very weak at 0.4′′ offset. Since this colour map and the individual GMOS spectra depicts very different colours (i.e., continuum shape) at offsets of: 0.2–0.4′′-south and 0.2–0.4′′-north, from the QSO-core. Even, the shape of the continuum at the QSO-core is very different to those observed at 0.2-04′′-south and at 0.2–0.4′′-north. More specifically, the continuum is very blue at 04′′-south, almost flat at 0.2′′-south, red at the QSO core and very red at 0.2-04′′-north (see in Paper i: Fig. 6).
Following the technique described in Paper i: first, a basic qualitative study of GMOS spectra was performed. Which was based in a direct and simple inspection of the continuum shape, at each spectrum. The panels of Figure 15 show the sequence of individual spectra (for the H + [O iii] + Fe ii wavelength range) along the position angle PA 131∘, and with step of 0.2′′. From this qualitative study of the GMOS spectra, interesting results were found (which are evident in Fig. 15): in almost all the regions of the GMOS field, of the QSO IRAS 04505-2958, the spectra show a strong blue component, in the continuum. This result (strong blue continuum, in the H + [O iii] + Fe ii wavelength range) was verified also at H and [O ii]–H wavelength ranges.
A detailed quantitative study of the continuum was performed, using for this purpose a colour index defined –by us– as the difference of fluxes at the border of the wavelength range of each GMOS CCD (using the B600 grating; see Table 1 for details of the GMOS observation, and Allington-Smith et al. 2002 for details of the GMOS instrument). In particular, we used the following colour index (for the H region):
-
•
For the Visual-Red wavelength range:
[Flux(6600) – Flux(5750)] 1016.
Fig. 16a shows the map of this continuum colour index, for the GMOS field. This colour map shows: (i) in almost all the field (specially around the QSO and in the shells) a strong blue continuum component; (ii) only in the external regions of the shell S3 the blue continuum component is relatively weak. These two interesting results are more clear and evident in Fig 16b, which shows the superposition of the GMOS colour map and the HST-WFPC2 R contours. Moreover, this Fig. 16b depicts that the strong blue continuum is likely elongated at the same direction of the OF process (at PA 131∘). At this direction we previously suggested that an extreme bipolar hyperwind generated the hyper shells S3. Moreover, at scale of 30 kpc the extended radio emission and the narrow emission lines are also aligned at this position angle.
Thus, an interesting theme is to study the possible nature of the strong blue continuum detected in this paper for IRAS 04505-2958, and previously in Mrk 231. In both cases the extended blue continuum components are aligned –and probably associated– with the explosive hyperwind/OF processes. This theme deserve a specific and detailed study.
8 GMOS-IFU kinematics of the QSO and the hyper/super shells
The study of the kinematics of IRAS 04505-2958, in particular the hyper shell S3, is an important test for the hyperwind scenario. Specifically, Merrit et al. (2006) proposed –if the extended object is a ring or interacting galaxy (as they suggested)– that the velocity field of this object will presents clear evidences of circular motion, since they found an evolved stellar population of 108 years, in this extended object.
In order to study the kinematics of the ionized gas, in the GMOS field of IRAS 045052958, we have measured the velocities from the centroids of the strongest narrow emission lines: [O iii]5007, [O ii]3727, [Ne iii]3869; plus the emission line H (measuring the peak of the main component; for detail of the H components see the sections 4 and 9). The fitting of Gaussians and Lorenzians was performed using the software SPLOT and SPECFIT (see for details Section 3).
First, the kinematics of the main components of the emission lines were analysed; and then the presence of multiple OF components required a more detailed study. Figs. 17a, b, c and d show –for the main component, of the ionized gas– the [O iii]5007, [O ii]3727, [Ne iii]3869, and H, velocity field maps. The GMOS-IFU field includes the QSO and the shells, in 3550 (20 kpc 30 kpc), with high spatial resolution (sampling of 01). These maps were constructed using the techniques described in Section 3. In each map the velocity of the QSO-core was used as the reference velocity.
The isovelocity colour maps (Figs. 17a, b, c, d and e) show the following characteristics:
-
1.
In the region of the hypergiant shell S3, all the velocity maps show very complex structures, which are not consistent with pure circular motion or an interacting or ring galaxy. Even these GMOS kinematics maps of the shell S3 are different to those observed for IR mergers with OF: like NGC 3256, NGC 2623, etc.
Only the velocity field (VF) map of the ionized gas in the external super–giant bubble of NGC 5514 (Lípari et al. 2004d) shows some similarities –in the structures– to those observed in the hypergiant shell S3. More specifically, S3 shows in the [O iii]5007 GMOS VF two lobes of redshifted velocities, with bi-cone shape. These features are very similar to those observed in the VF of the external shell, of NGC 5514.
-
2.
H, [O ii]3727 and [Ne iii]3869 VFs maps show also similar structures to the previous maps. However, the [O iii]5007 VF map depicts more clear substructures.
-
3.
Fig. 17e was constructed specially to detect the centre of the kinematics “bi-cone structure”, which is clearly located in the region of the very bright knots –of the shell S3– S3-K4 and S3-K5.
However, very recently using HST-NICMOS and ESO-VLT/ISSAC near and mid-IR data Letawe et al. (2009) found a point source in the central region of the extended object (S3), which is located very close (at 0.2–0.3′′) of the knot S3-K5 They associated with an AGN, or –less probably– with a compact and unusual extremelly brigth starburst.
Thus, the centre of the kinematics “bi-cone structure”, could be also a compact and unusual extremelly brigth starburst plus/or a AGN.
In addition, Fig. 18 shows the kinematics profile of H and [O iii]5007 through the QSO-core and at the position angle PA 131∘. This plot shows a smooth variation of velocities, from the QSO-core to the shell S3. Thus, an interesting possibility is that a similar physical process is connecting the QSO-core and S3: i.e., an extreme galactic wind. Previously, Merrit el al. (2006) suggested that this continuity –found also in the 1D spectroscopic ESO-VLT data– could be explained by the fact that the extended ring object was not observed at the position of the main kinematics axis.
Therefore, from this GMOS kinematics study there are some main points which are important to remark in order to discuss the nature of S3:
-
1.
In this paper, all the velocity field maps clearly show that the motion in the extended object is very complex and probably associated with an extrem OF process. In addition, the GMOS spectra show in the main knots of S3 multiple emission line components which could be mainly associated with OF.
-
2.
The VFs clearly show that the kinematics in S3 might not be associated with circular motion, or even to the motion of the observed VFs of interacting galaxies.
Thus, in this and previous Sections, the GMOS-IFU kinematics, ELR, colour maps and the morphology results show a good agreement with the hyperwind/OF scenario.
9 Stellar Population in the Shell S3: detection of a young starburst
Using long slit spectra Canalizo & Stockton (2001) and Merrit et al. (2006) already analysed, in the integrated spectra the shell S3, the presence of an stellar absorption system in the Balmer H-lines (H, H, H, H, H8, H9, H10 and H11). They detected a A-Type stellar spectra associated with a post-starburst of intermediate age of 108 yr. In addition, Merrit et al. (2006) proposed that there is –together with the post-starburst population– a residual (in the spectra of S3), which could be associated with a possible ongoing star formation process.
In this paper, using high resolution deep GMOS-IFU spectra, this post-starburst and a possible new starburst system will be analysed, for each main knots of the hyper shell S3.
9.1 Fitting the Stellar Population using Theoretical Models
The GMOS spectra of the shell S3 were analysed using synthetic spectra of H Balmer and He i absorption lines, for starbursts and post-starburst galaxies. These synthetic and theoretical spectra were developed by Gonzalez Delgado, Leitherer & Heckman (1999).
The values of equivalent width of the Balmer H-Lines H, H and H were measured using the wavelength windows suggested by Gonzalez Delgado et al. (1999). Which allowed to compare the measured values with those derived from their synthetic spectra of H-Balmer and He i absorption lines. The errors () in the EqW of H are less than 1.0 Å.
Table 7 shows the following results, from the study of the absorption GMOS-spectra of the main knots of the shell S3:
-
1.
Knots S3-K1, S3-K2 and S3-K3:
For H a range of equivalent width (EqW) of 3.5 – 6.5 Å, and FWHM of 460 – 470 km s-1 were measured.
-
2.
Knots S3-K4 and S3-K5:
For H a range of equivalent width (EqW) of 10.0 – 11.5 Å, and FWHM of 570 – 590 km s-1 were observed.
Thus, this study shows a new interesting result: two different ranges of EqW were detected for the main knots of the hyper shell S3. These ranges are different if we consider the errors in the EqW (which are less than 1.0Å). Furthermore, the knots of each of these two ranges are located also in two different areas of the shell.
We also compared the observed EqW of H (of the main knots of the hyper shell S3) with the grid of EqW of the models (developed by Gonzalez Delgado et al. 1999). The used synthetic model corresponds to a cluster with: instantaneous burst, solar metallicity and Salpeter IMF, between M 1 M⊙ and M 80 M⊙. From this study, the following ranges of age were found:
-
•
Knots S3-K1, S3-K2 and S3-K3: ages of 3.5 – 10.1 Myr;
-
•
Knots S3-K4, and S3-K5: ages of 80 – 140 Myr.
Thus, in the knots S3-K1, S3-K2, and S3-K3 the analysis of the GMOS spectra, using theoretical stellar population models, we found that the range of ages corresponds to young stars (in a young starburst).
9.2 Fitting the Stellar Population using Stellar Cluster Templates
The blue H-Balmer absorption spectra (H, H, H, etc) were also analysed using a second method: observational templates spectra of stellar populations (provided by Piatti et al. 2002; Bica 1988). These digital templates integrated spectra were obtained for different ages, from a library of 47 open stellar clusters . Covering the optical ranges of 3500–7000 Å, and 5800–9200 Å; with spectral resolutions of 14 and 17 Å, respectively.
From this fit of the GMOS spectra of the shell S3 –using the open-cluster templates– the following main results were found:
-
1.
Knot S3-K4, S3-K5:
For these knots, with strong H-Balmer lines in absorption, we found the best fit of the GMOS spectra using a template of 100-150 Myr age: i.e., the template call Yf (Piatti et al. 2002). Fig. 19a shows the result of this fit.
-
2.
Knot S3-K1, S3-K2, S3-K3:
For these knots with an unusual type of H-Balmer absorption spectra (without H and H absorptions) we did not obtain a good fitting using open-cluster templates. However, we have obtained an excellent fit using a template from a Library of spectra of Stars (for details see the next sub-section).
9.3 Fitting the Stellar Population using Stellar Template
The blue H-Balmer absorption spectra were also analysed using a third method: observational templates of stats (presented and provided by Silva & Cornell 1992). This is a digital optical stellar library, covering 3510–8930Å, with a resolution of 11 Å; for 72 different stellar types.
From this study the following main result was found:
Knots S3-K1, S3-K2, and S3-K3: A good fit of the spectra of these knots (with weak H-Balmer lines absorptions, which started at H) was found using the template corresponding to stellar of type B1-I: i.e., super-giant stars of spectral type B1. Fig. 19b depicts the results of this fitting process.
Thus, this result (using templates from a stellar library) and also those obtained in sub-section 9.1 suggest that in the knots S3-K1, S3-K2, and S3-K3 the dominant population corresponds to massive blue stars (probably associated with a young starburst). This result shows a good agreement with the study of the emission line ratio since the knots S3-K1, S3-K2 and S3-K3 all show ELR consistent with composite properties of shocks plus H ii regions.
In addition, the presence of a young starburst detected in S3 (using the GMOS data) is in good agreement with the detection of CO J 1-0 line emission, in this area. Which implies a mass M(H2) 2 1010 M⊙ and high star formation rate (Papadopoulos et al. 2008). This mass of H2 is at least a 30 per cent of the dynamical mass in the CO-luminous region. Recently, Letawe et al. (2009) reported strong reddening in the central area of S3.
For the knots S3-K4 and S3-K5 (with A-type stellar population), it is important to remark that an interesting result was found –in paper i– for the absorption lines of Mrk 231: when the position of the strong H, H, H absorptions were plotted, these strong absorptions are located close to the external border of the supergiant shells. Thus, these strong absorptions show “arc–shape” distribution in Mrk 231.
A simple explanation for this result could be that the OF process –in these shells– is cleaning the dust. Thus, this OF + cleaning process allow –probably– to see clearly the absorptions of the A-type stellar population in Mrk 231 (specially, close to the external borders of the expanding shells).
An interesting point about the A-type stellar populations (detected in mergers at low, medium and high redshift; see Poggianti et al. 1999) is that different works proposed that the star formation process was truncated in these mergers (see Balogh et al. 1997). However, it is not clear the process that could truncate the star formation. A interesting explanation for this result is that the OF process (detected in a high percent – 75 per cent– of IR mergers; Lípari et al. 2004a) could be the origin of the truncate star formation. Since the galactic wind in the last phase –blow–out + free wind– could change strongly the kinematics and physical properties of the different components of the ISM (and even to expel an important fraction of the ISM). Thus, the star formation –generate in the ISM– will change also strongly.
Finally, we note that –in this section– the study of the stellar population in the main knots of S3 shows a excellent agreement between the different theoretical and observational metods used.
10 The Emission and Absorption Lines in IRAS 04505-2958
Using high spatial and spectral resolution GMOS data, we studied in detail the properties of the emission and absorption lines (for IRAS 04505-2958). This QSO shows spectral features of narrow line Seyfert 1 AGN or QSOs. Several authors already suggested a link between NLS1 and BAL systems + IR emission (see Lípari 1994; Lawrence et al. 1997; Brandt & Gallagher 2000; Boller et al. 1993; Mathur 2000a,b; Boroson 2002; Kawakatu et al. 2007; Popovich et al. 2009).
Moreover, there is an interesting discussion about the derived mass of the SMBH in IRAS 04505-2958, using the properties of the emission lines. In particular, from a study of the profile of Hβ emission line, Merrit et al. (2006) derived a value of the mass of the SMBH of IRAS 04505-2958, namely [2–11] 107 M⊙. This value was obtained considering that IRAS 04505-2958 shows similar features and properties than NLS1 QSOs. Since this SMBH mass is smaller than that obtained by Magain et al. (2005) of 8 108 M⊙ (using the magnitude of the QSO, MV –25.8), Merrit et al. (2006) proposed that the host galaxy –of this IR QSO– could be less massive and less bright than the values previously assumed.
In Section 5, the results of detailed fits of the GMOS emission line spectra were presented (in Tables 4, 5, and 6) for: the QSO-core, the shells and several external regions. About the NLR in the QSO-core, it is important to remark that: using only one component for the fit of H, we found that the final Gaussian/Lorentzian solutions did not fit well the spectra. Only, including a broad, a intermediate and OF emission components, the fit obtained was correct: Fig. 23a shows this fact very clearly for H (since for this line the different components are strong and this line was observed with the best GMOS spectral resolution R831). Fig. 23b depicts the fit of H using a broad and an intermediate components (the GMOS spectra H was observed with medium spectral resolution, B600; in addition in this line the OF components are weak). Thus we have some differences with the results of Merrit et al. (2006) which were derived using only a single component for the emitting region of IRAS 04505-2958.
10.1 The Narrow Line Emission in the QSO–core and the extended regions
In Section 5 several interesting GMOS-IFU results were obtained in relation
with the narrow line (NL) emission; specially for the QSO-core, the
circumnuclear and external regions of IRAS 04505-2958. In particular,
At the QSO-core:
-
1.
H-Balmer and Fe ii: these strong emission lines were decomposed, using:
-
•
H-Balmer with 1 component + OF: a relatively narrow component with a FWHM at H and H of 1065 25 km s-1, plus several OF components (which fit the blueshifted asymmetry);
-
•
H-Balmer with 3 components + OF: a broad, an intermediate, and a narrow plus OF components, with the following FWHM at H and H,
FWHM-H-BROAD of [2050 30] km s-1 and
FWHM-H-INTERM. of [ 780 30] km s-1.FWHM-H-BROAD of [2150 30] km s-1 and
FWHM-H-INTERM. of [ 800 30] km s-1.It is interesting to remark that all the H-Balmer Broad components show a blueshift of 500 km s-1, in relation to the corresponding H-Balmer intermediate components.
-
•
Fe ii with 1 component: for this emission line we found a FWHM in the region of Fe ii-4570 of [800 35] km s-1.
We found that the Fe ii emission lines are at the same redshift of the H-Balmer intermediate components (and also these lines show the same FWHM). In addition, Table 4 shows that IRAS 04505-2958 could be considered as a strong Fe ii emitter, since the ratio Fe ii4570H-INTERM. is larger than 1.
-
•
-
2.
[S ii]6717-6731 and [N ii]6583: the [S ii]6717-6731 lines –at the QSO-core– are very weak (almost absent). In addition, the [N ii]6583 line is absent.
The GMOS-IFU spectra of almost all the BAL + IR + Fe ii QSOs (Mrk 231, IRAS 04505-2958, IRAS 17002+5153, IRAS 07598+6508, etc) show –in the QSO-cores– very weak NLR or absent, at [S ii]6717-6731 and [N ii]6583. We already associated this fact, with the QSO OF process: which expel the NLR.
At the QSO-core, circumnuclear and external reg.:
-
1.
[O iii]5007: this strong emission line has a FWHM of 630 20 km s-1 (with the peak blueshifted by -100 25 km s-1, from the peak of the H-Balmer lines). This line shows also OF components. Lípari (1994, his Fig. 4) showed that there is an anticorrelation between the strength and presence of this line [O iii]5007 and the Fe ii emission.
We remark that the surveys of the ionized gas using narrow band images show frecuently that the [O iii]5007 emission show different extension and location that those found for low ionization emission lines.
-
2.
[O ii]3727: the strong [O ii] line depicts a FWHM of 480 25 km s-1, and again, this line depicts OF components.
Figs. 20, 21 and 22 show a very interesting point about the strong and extended [O iii]5007 and [O ii]3727 emissions. In these plots is clear that the emission associated with these narrow lines are very extended, which were detected in almost all the GMOS-IFU field of 20 30 kpc. Letawe et al. (2008) reported a similar result, using ESO VLT+VIMOS spectra. These emissions show the highest values of flux in the region of: the shell S1 and S2, and to the left border of the GMOS field.
Thus, an interesting point about the GMOS results of the NLR observed in IRAS 04505-2958 is the fact that we are observing at least 3 different NL emission systems:
(a) one strong NL system associated with the H-Balmer lines, in the QSO-core, with an intermediate FWHM of 800 km s-1;
(b) a very weak NL emission associated with the lines [S ii]6717+31 and [N ii]6583 (also in the QSO-core);
(c) an extended and strong NL system associated with the
[O iii]5007 and [O ii]3727 emission
(in almost all the GMOS field of 20 30 kpc).
In addition, Fig. 24 shows the FWHM-[O iii]5007 map of IRAS 04505-2958. Large values of the FWHM of [O iii]5007 were detected, in different regions of the shell S3. This result could be explained by the presence of weak OF components in [O iii] (which can not be deblended –from the main emission line component– using the spectral resolution of GMOS-B600).
A similar GMOS-IFU result was obtained for the NLR associated with the weak [S ii]6717+31 and [N ii]6583 emission in Mrk 231, IRAS 17002+5153 and IRAS 07598+6508 (Paper i; Lípari et al. 2008). Furthermore, we found for the QSO-core of Mrk 231 GMOS spectral evidence of two weak [S ii] narrow emission line systems clearly associated with OF of low velocity. A simple explanation –already proposed– for these very weak nuclear NLR observed in BAL + IR + Fe ii QSOs is that the extreme OF expel the NLR. Even we already suggested that part of the broad line emission region in Mrk 231 is likely generated by an extreme OF process (Lípari et al. 2009, 2005a).
Finally, an interesting point is to study if the spectra of extreme OF associated with giant-SNe/HyN could generate the spectra of NLS1, similar to IRAS 04505-2958 or to the prototype of this class I Zw 1 (which is in addition an extreme Fe ii emitter; Lipari 1994). Fig. 25 shows the spectra of the type iin SN 1998E (Ruiz & Suntzeff 2009, private communication), obtained at CTIO in 1998 January 31, with the 4 mt telescope, together the spectra of SN 1998E, IRAS 04505-2958 and I Zw 1. This plot depicts very similar features in the spectra of SN 1998E and IRAS 04505-2958. Moreover, this plot shows that the spectra of SN 1998E and I Zw 1 are almost identical, and both with extreme Fe ii emission!.
Moreover, Lípari et al. (2005a, their Fig. 14) showed the superposition of the spectrum of the radio HyN type ii–L 1979c (observed in 1979 June 26.18; Branch et al. 1981) and Mrk 231. Only using colours it is possible to distinguish each spectrum, since they are almost identical. Thus, likely a more constant OF –rather than a single SN– could explain the very unusual spectra of: NLS1 in general (even with extreme Fe ii emission, like i Zw 1), IRAS 04505-2958 (a NLS1 with strong Fe ii) and Mrk 231 (a QSO with broad H-Balmer lines and extreme Fe ii).
Therefore, from all these results we are suggesting that at least part of the narrow, intermediate and broad line emissions are associated with explosive OF processes: i.e. in giant-SN/HyN + galactic winds + shells.
10.2 The Intermediate Emission Line Component at H-Balmer and Fe ii
In Table 4, new GMOS results regarding the H-Balmer and Fe ii emissions were presented for the QSO-core, of IRAS 04505-2958. Specifically, we found that the widths of the H-Balmer H intermediate components and the Fe ii emission show exactly the same value of FWHM of [800 30] km s-1. In addition, we already noted that the H-Balmer Broad components are blueshifted (of –500 km s-1) in relation to the H-Balmer intermediate components and the Fe ii emission.
A very similar result was found by Popovich et al. (2009), from a 3D spectroscopic study of the Narrow Line Seyfert 1 AGN Mrk 493. Specifically, they found that the widths of the H-Balmer intermediate emission and the width of the Fe ii show the same value of FWHM-H [790 80] km s-1. Thus, they associated the same origin for the Fe ii and the intermediate H component. In addition, Popovich et al. (2009) found that the NLR of Mrk 493 is ionized by H ii regions (not by the Seyfert 1 nucleus).
Lipari (1994) already included Mrk 493 in his IR colour-colour evolutionary diagram. He found that Mrk 493 is located at the end of the second sequence of transition AGNs/NLS1s (i.e., close to the power low area).
In addition, from the study of two sample of 568 and 4037 QSOs Hu et al. (2008a,b) found that the H emissions, of almost all these QSOs: (i) can be decomposed in a broad and intermediate component; (ii) the shift and width of the intermediate component correlate with the Fe ii emission, but not with the broad one. They also detected that these broad H emissions are blueshifted of –400 km s-1 in relation with the intermediate H and Fe ii emission. They suggested that these results could be explained by the presence of OF. Lípari & Terlevich (2006) and in the sub-Section 2.2 (of the present paper) already analysed –from the observational and theoretical point of view– the OF process associated with galactic wind as one of the main source of the NLR emission, in composite QSOs.
Thus, the GMOS data obtained for the intermediate and narrow emission of IRAS 04505-2958, plus the results of similar NLS1 and of large sample of QSOs, suggest that: it is important to know more clearly the nature of these emission line regions before to reach a final conclusion about the mass of the SMBH, and the host galaxy. Since at least part of the NLR and ILR in BAL + IR + Fe ii QSOs could be associated with strong OF process + giant-SN/HyN.
10.3 The Broad Emission at H-Balmer in IRAS 04505-2958 and BAL + IR + Fe ii QSOs
In the previous sub-section we have explained that only including a broad, intermediate and weak-OF components, in the fit of the H-Balmer emission lines the fitting was correct. Thus, we found for H and H emission a broad component with FWHM-H-BROAD of [2050 30] km s-1 and FWHM-H-BROAD of [2150 30] km s-1. An interesting point is to analyse the possible nature of this component. Which could be associated with the SMBH and/or the extreme OF.
According to the extreme OF + explosive + shells composite-scenario for IRAS 04505-2958, it is interesting to note –from the theoretical point of view– that several authors proposed that at least part of the broad line emission region could be associated with OF processes. In particular, these theoretical works suggest that the BLRs could be associated with different types of outflow processes. The main models associated the OF with ejecta of SN remnants, shocked clouds in nuclear galactic winds, extended stellar envelopes, accretion disks, jets, etc Terlevich et al. 1992; Perry 1992; Perry & Dyson 1992; Dyson, Perry & Williams 1992; Scoville & Norman 1988; Norman & Miley 1984; see for a review Sulentic, Marziani, & Dultzin–Hacyan 2000). In particular, Terlevich et al. (1992) showed that all the ELR of the BLR could be explained in the framework of compact SNR.
Lípari et al. (2004d) found in all the IR QSOs with OF of their sample (with more than 50 QSOs) that the H broad line component is blushifted in relation to the narrow one. For the broad H component of IRAS 04505-2958 their measured a blushift/OF -1700 km s-1. Which correspond the same velocity of the BAL detected in C iv1550 emission line. Thus, this result -studied in more detail using GMOS data- suggest that the optical low ionization BL-emission and the BAL could be originated in the same OF process, with supershells.
On the other hand, even in the standard model of SMBHs/AGNs the OF process could play an important role. There are two main groups of standard models about the structure and dynamics of the gas near the core of QSOs and specifically, about the broad emission line region (BELR) and broad absorption line region (BALR). In these models the gas may exist as:
(i) Continuous Winds: spectral analysis of Arav et al. (1994, 1997, 1998, 2001, 2005) seems to show that continuous winds might be better suited to explain high resolution spectra of BALR and BELR.
(ii) Discrete Clouds: the idea that gas is partitioned into discrete clouds is the more traditional approach to BELR and BALR (see Everett, Konigl, Kartje 2000; Bottorff et al. 1997).
Therefore, we suggest that at least part of the Fe ii emission and the H-Balmer intermediate + broad width regions could be originated in OF processes (in the cores of BAL + IR + Fe ii QSOs), more specifically in warm regions obscured from direct ionizing UV photons. The obscuring material could be in the form of expanding shells. Giant explosive events would produce large scale shocks plus shock-heated material. This scenario is in good agreement with our recent finding, for the BAL + IR + Fe ii QSOs IRAS 07598+6508. We found that the properties of the BLR of this BAL QSO are consistent with collisional rather than radiative process (Veron et al. 2006).
10.4 The Broad Absorption Line systems in IRAS 04505-2958
In general, the GMOS data of IRAS 04505-2958 and Mrk 231 show that both QSOs have similar OF processes and properties, even both QSOs have “relatively narrow” BALs (Lípari et al. 2005a, 1994). In addition, in Paper i, we already detected the extended nature of the BAL system i of Mrk 231.
Extended BALs were detected in others narrow BALs, by de-Kool et al. (2001, 2002). Using very high resolution Keck spectroscopic data of associated absorption line (AAL) and BALs QSOs FIRST J104459.6+365605 and FBQS 0840+3633, they found that the distances between the AGN and the region where the OF gas generate the AAL and BAL line are 700 and 230 pc, respectively.
It is interesting to point that Mrk 231, FIRST J104459.6+365605 and FBQS 0840+3633 (which show extended BAL systems) are all members of the rare class of low ionization BAL QSOs. Furthermore, these 3 QSOs are also members of the “very” rare sub-class of Fe ii low ionization BAL QSOs with very strong reddening in the UV continuum. In particular, for Mrk 231 Lípari et al. (2005a) found the presence of strong absorption in the Fe ii and Mg ii lines; which are the standard lines that define the Fe ii low ionization BAL QSO sub-class. Thus, an interesting alternative that required to be studied in detail is the possibility that the BAL system of IRAS 04505-2958 is extended.
11 The QSO as the main source of the ultra luminous IR emission
In Sections 1 and 2, we have explained that the mid and far IR emissions of IRAS 04505-2958 were associated “mainly” with a luminous quasar (see de Grijp et al. 1987, 1992; Low et al. 1988, 1989; Hutching & Neff 1988; Lípari et al. 2003, 2005a, 2007a,b, 2009; Lípari & Terlevich 2006; Kim et al. 2007; Zhou et al. 2007; and others). However, some authors suggested that the extended object could be a companion/interacting ring galaxy and also the “only” source of the ultra luminous IR continuum emission (Canalizo & Stockton 2001; Magain et al. 2005; Merrit et al. 2006; and others).
Lípari et al. (2005a) already proposed that the QSO is at least the dominant source of the ultra luminous IR emission IRAS 04505-2958. Since this IR source is located in the IR colour-colour diagram exactly in the sequence of BAL + IR + Fe ii QSOs. Furthermore, the BAL system of this QSO was found using this IR colours diagram (i.e. using their mid and far IR emission, which are typical of IR QSO; see also de Grijp et al. 1987, 1992; Low et al. 1988, 1989).
In the context of the new GMOS-IFU data, we remark the following results:
-
1.
Regarding the location of IRAS 04505-2958 in the IR colours diagram, it is important to remark that their position is between two standard BAL + IR + Fe ii QSOs: IRAS 07598+6508 and IRAS 17002+5153. Using new GMOS-IFU data, Lípari et al. (2008) found new evidences that IRAS 07598+6508 and IRAS 17002+5153 are also explosive BAL + IR + Fe ii QSOs with supergiant shells (very similar to IRAS 04505-2958 and Mrk 231).
-
2.
In the shell S3 the GMOS spectra show young starbursts in the main knot K1, K2 and K3; with also strong OF processes and shocks. Thus the shell could be a second source of IR energy.
-
3.
For the shell S3 all the GMOS velocity fields show that the kinematics and the multiple emission line components ere related with strong OF process (similar to the kinematics of the proto-type of expanding external shell in NGC 5514). Thus, the kinematics of this extended object is not consistent with a interacting ring galaxy (this is an interesting point since several authors suggested that the only source of IR emission is a ring galaxy).
Recently using HST-NICMOS and ESO-VLT/VISIR near IR images, Jahnke et al. (2009) also concluded that S3 is not a collisional ring galaxy.
Therefore, there are several inconsistencies in the idea that the extended object is a ring interacting galaxy and the only source of the ultra luminous IR energy. On the other hand, all the previous enumerated results are in excellent agreement with the original suggestion that the QSO is the dominant source of ultra luminous IR energy. However, it is important to note that probably also the starburst process detected in the knots K1, K2 and K3 of the shell S3 could be a second source of IR emission, which is in agreement with the detection –in S3– of CO J 1-0 line emission, with a derived mass M(H2) 2 1010 M⊙ and high star formation rate (Papadopoulos et al. 2008).
Moreover, Jahnke et al. (2009) and Letawe et al. (2009) suggested that the QSO and the extended companion galaxy are both ultraluminous IR source. This proposition is in agreement with the scenario propossed in this paper for IRAS 04505-2958 (QSO + a galaxy in formation). In addition, we alrady noted that Letawe et al. (2009) found –in their IR images– a point source close to the knot S3-K5 (strongly obscured, at optical wavelength, by dust), which they associated with an AGN, and/or a compact and unusual extremelly brigth starburst. This last result could be also in agreement with our proposition that S3 is probably a young galaxy in formation.
Finally, we note that Papdopoulus et al. (2008) suggested a new scenario for IRAS 04505-2958 and “some” transition IR QSOs. Specifically, using their interesting result that the CO emission was detected only in S3 but not in the QSO-host, they proposed that the QSO + S3 (in IRAS 04505-2958) could be considered an example of gas–poor (elliptical) + gas-rich (spiral) interaction of galaxies. In the hyperwind scenario –for IRAS 04505-2958– the results of the study of CO in the QSO (absence of CO molecular gas) could be explained mainly by the ejection of the ISM/CO by multiple explosive processes (and the remnant galaxy –of these multiple explosive events– could be a dwarf elliptical).
12 The Host Galaxy of the BAL QSO IRAS 04505-2958
Recently, several interesting observational and theoretical studies of the host galaxy of the QSO IRAS 04505-2958 were carried out. A brief summary of these results are presented here (then these results will be compared with the new GMOS-IFU data):
-
•
Boyce et al. (1996) –using HST–WFPC2 images– detected at the same redshift of the QSO IRAS 04505-2958 a close and extended object. They associated this extended object with a companion ring galaxy, which is probably interacting with the host galaxy of the QSO.
-
•
Lípari et al. (2003, 2005a) –using HST–WFPC2 images and HST/FOS plus CASLEO spectra– associated the extended object with a hyper shell generated in an extreme OF process (very similar to those detected in almost all the BAL + IR + Fe ii QSOs).
-
•
From a detailed study of host galaxies of a sample of 17 QSOs (using HST–ACS images, ESO–VLT long-slit spectroscopy), Magain et al. (2005) found that only in the case of the QSO HE 0450-2958 the host galaxy was not detected. This result (the absence of detection of the host) was found in high resolution data: the deconvolved HST–ACS images and the deconvolved ESO–VLT 1D-Spectra.
Magain et al. (2005) proposed that the host galaxy is under the detection limit could suggests that the host galaxy is dark or is absent (i.e., a naked QSO).
Therefore, these HST–WFPC2, HST–ACS images and ESO–VLT, HST–FOS spectra show two very interesting but controversial results, for the host galaxy of this BAL IR-QSO. Specifically: (1) the host galaxy –in this bright QSO– remain undetected, even using deep HST–ACS images and ESO–VLT spectra (plus using deconvolution technique of images and spectra); but (2) an extended object –at the same redshift of the QSO– was found; which shows a very clear, bright and a knotty sub-structure.
From the theoretical point of view, four/five main –and very different– scenarios were proposed, for this QSO + host + extended ring object. In particular:
-
1.
Interaction of Galaxies. Boyce et al. (1996), from the HST–WFPC2 images of IRAS 04505-2958 suggested that this QSO could be the result of an interaction of galaxies, between the host galaxy of the QSO and a close and very extended object.
-
2.
Explosive BAL + IR + Fe ii QSO. Lípari et al. (2005a, 2007a,b, 2009) proposed for IRAS 04505-2958 an explosive and composite hyperwind scenario. More specifically, we suggested that: (a) the close and extended object is a hyper shells, probably forming a companion/satellite galaxy; (b) the extreme OF –generated by the composite QSO– with multiple explosive process and shells, probably expel a high fraction of the ISM of the host galaxy.
-
3.
Naked QSO. Magain et al. (2005) from a study of host galaxy in QSOs (using new HST–ACS images and ESO–VLT spectra) suggested that the host galaxy is absent in their deconvolved data. They proposed that: the host is dark, or a naked QSO scenario;
-
4.
Ejected QSO. Haehnlet, Davies & Rees (2005) analysed theoretically the possibility that a naked QSO was ejected from the companion ring galaxy-candidate. Hoffman & Loeb (2006) discussed the special conditions required for the theoretical ejected scenario for this QSO.
-
5.
Normal Host Galaxy of NLS1. Merritt et al. (2006) suggested that the value of the black hole mass –of this high luminous version of NLS1 AGN– is lower that the value obtained by Magain et al. (2005); and thus, the host galaxy could be fainter and less massive than the values assumed previously (by Magain et al. 2005).
In this paper, we found new GMOS evidences which are in good agreement with the explosive and hyperwind model in this BAL + IR + Fe ii QSO IRAS 04505-2958. The main new GMOS-IFU evidence (supporting the explosive scenario) are the following:
-
•
Multiple emission line components were detected in the QSO-core, in the two circumnuclear shell S1, S2 and in the extended hypergiant shell S3. These components show very high OF velocities (even with V 2000 km s-1) which could be associated only with extreme and explosive process (see Sections 2 and 5; and Suchkov et al. 1994).
-
•
The kinematics and emission line ratios maps are consistent with an extreme OF and associated shocks in the QSO and in the shells S1, S2 and S3. Specifically, the kinematics of the shell S3 show a small scale bipolar OF.
-
•
A blue component was detected in all the continuum GMOS map (3.55′′ 2030 kpc), which is consistent with an extreme galactic wind (associated with the QSO).
-
•
The presence of a very extended shell S4 at r 80 kpc (previously found by Hutching & Neff 1988) was discussed. In particular, we found that this shell is probably associated with a bipolar OF, at PA 40∘ and with an opening angle of 95∘ (Fig. 3).
Thus, these new GMOS-IFU results are in good agreement with a composite and explosive hyperwind scenario for the BAL + IR + Fe ii QSOs IRAS 04505-2958. Furthermore, this hyperwind model could explain the previous –apparently– surprising and controversial results:
-
1.
The host galaxy remain undetected, because the hyperwind ejected a high fraction of the ISM of the host galaxy; and
-
2.
The extended, bright and knotty object is an hyper shell (similar to those detected in almost all the BAL + IR + Fe ii QSOs) with properties of a shell and also of a companion/satellite galaxy. The kinematic maps and the spectra of S3 show strong OF, which suggests that this likely young galaxy is still in the phase of formation via explosions. Which is in good agreement with the theoretical explosive models of formation of galaxies (see Section 2 and Ikeuchi 1981; Ostriker & Cowie 1981; Berman & Suchkov 1991).
In conclusion, the hyperwind model –with multiple extreme explosive events– for BAL + IR Fe ii QSOs explain with a very simple physic, the fact that the extended object plus the two internal blobs were detected very clearly, but at the same redshift the host galaxy still remain undetected.
13 Explosive Model for IRAS 045052958, and for Galaxy Formation/End
For the discussion of the explosive and composite hyperwind model
for IRAS 045052958,
it is important to remark some interesting previous results.
More specifically,
From the observational point of view:
Several surveys of Ly emitters at high z (Steidel et al. 2000; Keel et al. 1999; Francis et al. 2001; Matsuda et al. 2004) have established the existence of extended, highly luminous Ly halos (of 50-100 kpc and 1.4 1044 erg s-1). In addition, several extended Ly halos were detected in high redshift radio sources (see for references Reuland et al. 2003).
In several BAL + IR + Fe ii QSOs
Lípari et al. (2003, 2005a, 2007a,b, 2008, 2009) detected very extended
OF processes of 50–100 kpc with giant shells and bubbles.
From the theoretical point of view:
Dey et al. (1997) and Reuland et al. (2003) proposed that in high z radio source: starburst and superwinds can generate extended Ly nebulae/halos. Taniguchi & Shioya (2000) suggested a starburst hyperwind scenario for the origin of the high redshift Ly blobs.
Lípari et al. (2005a, 2007a,b, 2009); Lípari & Terlevich (2006) proposed a composite and explosive hyperwind scenario in order to explain the very extended shells –of 30–100 kpc– found in the BAL QSO IRAS04505-2958. In addition, they proposed a similar hyperwind for the OF process of 50 kpc in the BAL + IR + Fe ii QSOs Mrk 231 (and also for IRAS 17002+5153 and IRAS 07598+6508; Lípari et al. 2008).
13.1 Explosive Model for the QSO and the shells S1 and S2
The GMOS-IFU data presented in this paper show clear evidences that an extreme outflow process is present in the QSO-core of IRAS 04505-2958, and also in the close shells (with symmetric and circular external–borders) S1 and S2.
From this GMOS study of the OF process (at different scale, from the QSO-core to the multiple expanding shells systems), we found again that the detection of multiple OF components and the ELR –for the QSO-core and the shells S1, S2– show a good agreement with an extreme galactic wind scenario. Specifically, multiple OF emission systems were detected, showing very high OF velocities. Specifically these OF systems depict V from 300 to 3000 km s-1. These very high velocities –of the multiple emission line components– could be explained as OF processes. In addition, the ELR diagrams for the shells S1 and S2 show the typical values associated with ionization by OF + shocks plus the QSO. Thus, our GMOS results suggest the presence of multiple expanding supergiant shells, which are centered at the location of the QSO IRAS 04505-2958.
13.2 Explosive Model for the Shell S3 (and a new scenario for Galaxy Formation)
Fig. 2 shows the very extended morphology of the main hypergiant shell S3. Again in this plot, the border of S3 depicts symmetric and circular external–border, with the centre at the position of the QSO (this result is the same that the previous one obtained for S1 and S2). Moreover, this fact is also in agreement with the previous result of Hutching & Neff (1988), in the sense that the hyper shell S4 is centered in the QSO.
Here, we remark some interesting results found for S3, and using GMOS-3D individual spectra, emission lines maps, and plots of the kinematics and physical conditions. All the main knots of the shell S3 show multiple emission lines with multiple components which could be only associated with an OF process, in addition these multiple components shows mainly LINER properties, which are likely generated by shocks (these shocks are clearly observed in the [S ii]/H ELR map).
Moreover, the complex kinematics of S3 –for all the observed emission lines– show a small scale bipolar OF, with centre in the main knost K4 and K3. These results show the typical physical properties of an external shell with extreme explosive OF processes (for example these results are similar to those obtained for the kinematics of the prototype of external exploding shell in NGC 5514; Lípari et al. 2004c). In addition, the main knots K1, K2, and K3 –of this hyper shell S3– show a young starburst, with multiple OF emission line components.
Therefore, S3 exhibits typical properties of a shell in expansion, but also the properties of a young companion or satellite galaxy (in formation). More specifically, we have explained that S3 depicts kinematics of an expanding shell; plus starburst knots with multiple OF components and ELR typical of extreme OF process. A new and strong support for the young galaxy scenario –for S3– came from the detection of CO J 1-0 line emission in S3: with a mass M(H2) 2 1010 M⊙ (Papadopoulos et al. 2008). Which is at least a 30 per cent of the dynamical mass in the CO-luminous region. This is one of the standard criteria for the definition of a galaxy in formation.
In conclusion, the GMOS plus the CO J 1-0 results are in exellent agreement with the prediction of theoretical explosive models for the formation of galaxies/QSOs. Which were already proposed by Ikeuchi (1981), Ostriker & Cowie (1981), Berman & Suchkov (1991). For details of these explosive models see Section 2.
13.3 Hyperwind and Explosive Model for Ly Blobs
In the introduction of this Section we have explained that in the last years very extended blobs –specially in Ly– has been detected in a variety of high and low redshift objects. In addition, the results of the surveys at high z of bright Sub-mm source (Chapman et al. 2004a; Bower et al. 2004, Swinbank et al. 2005) suggest that a high fraction (3/4) of these sources are extended and complex (i.e., showing extended and highly luminous Ly halos; Chapman et al. 2004a,b).
Lípari et al. (2004a) already found that 75 of IR QSOs and mergers (including BAL QSOs) show clear evidence of OF. Which is the same percent (75) found by Chapman et al. (2004b,a) in their study of Sub-mm sources showing extended and highly luminous Ly halos. Recently, we have started a study of 3D spectroscopic data of high redshift Sub-mm and Radio BAL-QSOs, using Gemini+GMOS and ESO VLT+VIMOS. Using these GMOS data we are studying the interesting possibility (already suggested by Lipari & Terlevich 2006) that in Sub-mm and Radio QSOs –at high redshif– also extreme explosive OF process could play a main role in their evolution.
13.4 Explosive Model for the End of the Host Galaxy
Multiple explosive events expelling a high fraction of the host galaxy could be a probable explanation for interesting and controversial result the shell S3 is clearly observed,but at the same redshift the host galaxy of the QSO remain undetected. Several explosive events can eject a large fraction of the ISM. Moreover, an extreme galactic wind could strongly change the kinematics and the physical condition of the ISM in general (and not only the ejected ISM). Thus, in this way explosive processes would play a main role in the evolution of the star formation and therefore in the evolution of the galaxy. Even extreme OF process could define the mass of the remnant of the original galaxy. The end product of a multiple explosive processes was called a galaxy remnant.
We believed that likely in IRAS 04505-2958 we are observing for the first time a candidatefor a host galaxy at the end phase of their evolution, or a galaxy remnant.
Thus, giant QSOs explosions is an interesting process in order to consider as the base for a model of galaxy end. Our observational GMOS-IFU results for BAL + IR + Fe ii QSOs, plus several theoretical works show a good agreement with explosive models for the end and the formation of “some” type of galaxies.
14 Main Consequences of the Explosive Model: HyN, CR and Neutrinos/Dark-Matter
The GMOS-IFU data of IRAS 04505-2958 show new evidence of a multiple hypergiant symmetric shells, with centre at the location of the QSO. These hypershells could be generated only by giant SN and HyN (Norman & Ikeuchi 1989; Heiles 1979; Suchkov et al. 1994; Strickland & Stevens 2000; Tenorio-Tagle et al. 1999, 2005, 2006). In addition, the high resolution spectra of the QSO show multiple OF components, which could be associated only with OF processes. Moreover, from our GMOS observational programme and study of nearby BAL + IR + Fe ii QSOs we found new evidence of super/hyper shells and explosive processes in four of these objects: Mrk 231, IRAS 04505-2958, IRAS 17002+5153, IRAS 07598+6508 (Lipari et al. 2007a,b, 2008, 2009). In the evolutionary, explosive and composite model for BAL + IR + Fe ii QSOs, the presence of multiple shell systems, extreme OF, and extreme explosive events are associated mainly with HyN and giant SNe (Lipari & Terlevich 2006).
In this paper we show that the OF process of giant type ii SN/Hyn (like 1998E) could explaine the spectra of the very rare class of NLS1 galaxies and even the spectra of extreme Fe ii emitters. The strong and extreme Fe ii emission could not be explained using standard fotoionization models (see for details Section 2; Lipari & Terlevich 2006; Veron et al. 2006). In addition, the discovery of new giant HyNe (like 2006gy, 2006tf, 2005ap) confirms our suggestion of the presence of extreme explosive events, powered by the death of extreme massive stars (like Eta Carinae). These and similar HyNe in QSOs and galaxies could help to explain several main themes in Astrophysics.
Specifically, the GMOS results obtained in this paper for IRAS 04505-2958 are in good agreement with some theoretical studies that suggest that ultra high energy cosmic rays (CR) and neutrinos are generated in giant-SN/HyN explosions. Thus, the GMOS results obtained in this paper could help to discriminate between several theoretical models for the generation of ultra high energy CR and Neutrinos. This is probably one of the main astrophysical consequences, derived from the study of the explosive model for composite AGNs/QSOs (see for details Section 2).
14.1 Diversity of HyperNova associated with GRB
The GRB-HyN connection (Woosley & Bloom 2006; see also Colgate 1968) shows a new type of giant-SN explosion, associated with: (a) high kinetic energy in the range ESN 1052–1053 erg, (b) very broad emission lines, and (c) strong radio emission indicating relativistic expansion of 0.3c (Kulkarni et al. 1998). Nomoto et al. (2004, 2006, 2007a,b,c, 2008); Packzinki (1998) studied this type of giant–SN, that they call HyN.
More specifically, there is strong observational evidence, that –at least– some large duration gamma ray burst (GRB) are associated with giant-SN and starbursts areas. Five pairs were detected of long duration GRB associated with confirmed giant-SN/HyN (which show spectra of giant-SN): HyN 1998bw+GRB 980425, HyN 2003dh+GRB 030329, HyN 2003lw+GRB 031203, SN 2006aj+XRF 060218 and SN 2008d/XRT 080109.
For the giant-SN/HyN 2008bw, 2003dh, 2003lw, Nomoto et al. (2007c) found that these events could be explained as the collapse to a Black Hole, of the core of massive star of 40–45 M⊙ (and ejected mass of 4–10 M⊙). For of SN 2006aj Nomoto et al. (2007c) found that the progenitor had a smaller mass than the previous HyN+GRB, with a value of 20 M⊙. This result suggests that a Neutron star was formed. For SN 2008d Tanaka et al. (2008) found for the progenitor is a main sequence star with a mass of M 20-25 M⊙. Li (2008), Xu et al. (2008) and Mazzali et al. (2008) considered this XRT as the lest energetic end of GRBs and XRFs.
Thus, there are very different types of long duration GRBs and HyNe. Since even these five pairs/cases of confirmed GRBs associated with HyNe are very different. From the study of these five HyN+GRB several interesting consequences could be derived. In particular: (i) For these five pairs of GRB + HyN, a linear relation was found between the peak of of energy of GRB/XRF versus peak of bolometric magnitude of the associated giant-SN/HyN (Li 2008). (ii) The detection of the normal type Ibc SN 2008d (associated with XRT 080109), clearly extends: the GRB–HyN connection to normal core-collapse SNe. Hence, it has been suggested that probably every core-collapse SN (type Ib, Ic and II) has a GRB/XRF associated with it (Li 2008). Moreover, Bloom (2003) proposed that all long duration GRB could be associated with giant-SN/HyN
Moreover, even the standard collimated-jet model –for the origin of GRB– require to be analysed in detail for each GRB/HyN. Since investigations found that GRBs with softer spectra tend to have larger jet opening angle: i.e., weakly collimated outflows (Lamb, Donaghy & Graziani 2005; Li 2007). Even, it appear that some GRBs have spherical outflow (see for references and details Li 2007, 2008).
Therefore, in these very different types of HyN+GRB: the mildly relativistic ejecta and the relativistic jets are both important physical processes; which could generate ultra high energy emission.
14.2 Diversity of HyperNova in General
In addition of HyN associated with GRB, several types of hypernovae (and giant explosive processes) were observational and theoretical studied. Specifically, the following main types of HyN were observed and/or theoretically proposed,
-
1.
Radio HyperNovae
Several years before the discovery of the first HyN (associated with GRB), Colina & Perez-Olea (1992, 1995) suggested that the presence of compact strong Radio-SN remnant –and strong Radio-SNe– mean also the existence of HyNe (that they call Radio-HyN). They proposed that the prototype of radio hypernova is the Radio-SN/HyN 1979c. We already noted the spectra of Radio-HyN 1979c and the BAL + IR + Fe ii QSO are almost identical. In addition, Weiler et al. (2002) proposed that one of the main process associated with the radio emission –in very bright radio-SN/HyN– can be best explained as the interaction of a mildly relativistic shock ( 1.6) with a dense pre-explosion stellar wind, in the circumstellar medium. Which is the same interpretation of the radio emission of HyN+GRB, suggested by Kulkarni et al. (1998) and others.
From a survey of SNe at radio emission in Arp 220, Lonsdale et al. (2006) reported the important detection of 4 new and strong radio-SN/HyN in a period of only 12 months, in the two nuclear regions. Arp 220 is of one of the prototype of IR Merger with extreme OF + associated very extended super-giant shells. This IR Merger shows two shells with bipolar structure, each one with an extension or radius of 15 kpc (detected by Heckman et al. 1987, 1990).
-
2.
HyperNovae associated with Extreme Massive Stars
An important result, in the HyN field, was the discovery of the SN 2006gy (in NGC 1260, Smith et al. 2007), that reached a peak of absolute magnitude of –22, and remain brighter than –21 mag for about 100 days!.
This SN 2006gy (of type iin) is one of the most luminous SN, powered by the death of an extremely massive star. This result confirm one of the main suggestion of the evolutionary and explosive model for composite AGNs: the existence of giant–SN/HyN explosions, associated with extreme massive stars, like Eta Carinae (Lípari et al. 2003, 2005a; Lípari & Terlevich 2006).
Very recently, the discovery of new giant-SN or HyN similar to 2006gy (SN 2006tf and 2005ap; see Smith et al. 2008; Quimby et al. 2007) confirm the presence of these extreme explosive events. This type iin HyN and their remnant could help to explain several main themes in Astrophysics (see the next sub-Sections).
-
3.
HyperNovae associated with Neutron Stars
In accretion disks of AGNs, the star–gas interactions may lead to a special mode of massive star formation. Collin & Zahn (1999) suggest that the residuals of the first SNe, mainly neutron stars, can undergo a new accretion/interaction phase, with the gas, leading to very powerful SN or hypernova explosions. We have already suggested that in the core of BAL + IR + Fe ii QSOs some HyN could be generated from the collapse of neutron stars in accretion disks (these are giant-SN/HyN generated in a second explosive event).
-
4.
HyperNovae associated with Population iii Stars
It has been suggested that in the Population iii star, extreme massive stars existed (Abel, Brian, & Norman 2000; Bromm, Coppi & Larson 2002; Nakamura & Umemura 1999; and others). Several authors already studied the collapse –end phases– of very and extremely massive Pop. iii stars. Ohkubo et al. (2006) presented a summary of the main theoretical results obtained for the end phases of extreme massive stars, and for different ranges of masses:
(a) 8 M⊙ to 130 M⊙, the stars undergo ONe Fe core collapse leaving Neutron stars and black hole.
(b) 130 M⊙ to 300 M⊙, the stars undergo electron positron pair creation instability, during O burning, releasing more energy by nuclear burning than the gravitational energy of the star; and thus these stars disrupt completely as pair-instability SN (PISN).
(c) 300 M⊙ to 1000-10000 M⊙, also these stars enter in PISN, but continue to collapse (see Fryer, Woosley, & Heger 2001; Ohkubo et al. 2006; Heger et al. 2002; Nomoto et al. 2004, 2006, 2007a,b,c, 2008; and others).The results of these theoretical SN models suggest that these very and extreme massive population iii (or primordial) stars explode as giant–SN/HyN with energies of 1052–1053 erg (Fryer et al. 2001; Heger et al. 2002; Ohkubo et al. 2006; Nomoto et al. 2004, 2006, 2007a,b,c, 2008). Moreover, Collin & Zahn (1999) suggested that in the accretion regions of the AGNs, the massive stars could be similar to extreme massive population iii stars.
Finally, following the results presented in the previous paragraphs we conclude that very different types of HyNe could be present in composite QSOs/AGNs and specially in the core of explosive low ionization BAL + IR + Fe ii QSOs. In HyNe mildly relativistic ejecta is probably the source of ultra high energy (UHE) Cosmic-Rays (UHE-CR) and Neutrinos (UHE-N).
14.3 Cosmic Rays associated with Explosive QSOs/AGNs and HyN
In the last decades, a main astrophysical issue is to understand the origin of UHE cosmic rays. Recently, using the Pierre Auger Observatory, Abraham et al. (2007) found that the extremely high energy CR are generated with AGNs. Two different theories and models could explain these P. Auger observations: (i) Obscured and Collimated AGN/Black-Hole; (ii) Evolutionary, Explosive, and Composite AGN + starburst Model.
The production of relativistic electrons is in young SN remnants and it is believed that remnants simultaneously produce relativistic ions/CRs (see Ellison et al. 2007). In the evolutionary and composite model for AGNs, HyN explosions are a main component; thus we have suggested that giant HyN explosions and their remnants (RHyN) could be natural candidates for the origin –in AGNs– of UHE CRs (Lípari et al. 2007b). In addition, the large duration and very energetic gamma ray bursts are associated mainly with HyN explosions.
From the theoretical point of view several groups already analysed
the generation of UHE-CR and UHE-N in:
-
•
GRBs in general: in the fireball blast wave scenario for GRB, the waves of ejected relativistic plasma that collide with each other form shocks, which accelerate UHE particles/CR and radiate high-energy UV photons (Vietri 1995, 1998a,b, 2003; Waxman 1995; Milgrom & Usov 1995; Waxman & Bahcall 1997, 1999, 2000; Vietri, De Marco, Guetta 2003; Dai & Lu 2001; Dermer 2002, 2003, 2007a,b; Dermer & Atoyan 2006; Razzaque, Meszaros, Waxman 2004; Wick et al. 2004; Fang, Zhang, Wei 2005; Meszaros & Razzaque 2006; Murase et al. 2006, 2008; Grupta & Zhang 2007; and others);
-
•
HyperNovae, associated with neutron stars in GRB: in the collapse of neutron star to a black hole (years after the initial SN, that generate the neutron star), the BH-outflow interact with the original SN-remnant through an external shock to form GRB and accelerate UHE particles/CR and radiate high-energy photons (Vietri & Stella 1998, 1999; Dermer & Mitman 2003)
-
•
HyperNovae, associated with low/sub energetic GRB: in mildly relativistic HyN ejecta (similar to HyN 1998bw + GRB980425 and HyN 2003lw + GRB031203) the external shock wave –produced by the ejecta– could generate UHE cosmic rays and UHE neutrinos (Wang et al. 2007; Wang, Razzaque, Meszaros 2008)
-
•
AGN jets: the shocks associated with relativistic jets, in radio AGNs/QSOs could accelerate UHE particles/CR and radiate high energy UV-photons (Berezinky et al. 2006; Dermer et al. 2009); and
-
•
Intergalactic accretion shocks: accretion and mergers shocks in massive clusters of galaxies could accelerate UHE protons/CR, which can give rise neutrinos through pp interactions with intercluster gas (Inoue, Ahoronian & Sugiyama 2005; Murase, Inoue, Nagataki 2008).
Therefore,
in the evolutionary, composite and explosive model for AGNs (and
BAL + IR + Fe ii QSOs) the presence of HyNe could generate
UHE-CR and UHE-N, according to the processes and theoretical studies
performed by Wang et al. (2007, 2008); Vietri & Stella (1998, 1999);
Dermer & Mitman (2003).
In the core of composite
QSOs and AGNs different types of HyN could be generated in the accretion
regions (Collin & Zahn 1999), in particular HyNe
associated with: extreme massive stars, and neutron stars.
In addition,
several works suggested that a high per cent of core collapse SN/HyN are
associated with mildly relativistic ejecta and GRBs.
Thus, in the core of explosive + composite AGNs and BAL + IR +
Fe ii QSOs, different types of HyNe are one of the
main candidates for the origin of UHE-CR and UHE-N.
Test for the Explosive+HyN AGNs Model (as the source of UHE-CR)
An important test for this scenario (that “the observed UHE-CR are generated by HyN ejecta, in the core of AGNs”) is the following: to detect starburst, giant explosions and the associated super shells in nearby AGNs.
Recently, this type of evidence was detected in the prototype of AGN: Centaurus A. This nearby AGN is one of sources associated with UHE cosmic rays by Abraham et al. (2007). However, even for Cen A, only very recently and using mid-IR images obtained with Spitzer Space Telescope, Quillen et al. (2006) found a supergiant nuclear symmetric+circular shell (at r 500 pc, from the core of the AGN). They suggested that this shell is probably associated with a nuclear starburst (and/or AGN).
Thus, for the nearest AGNs (Cen A) the nuclear starbursts, explosions and the associated shells were detected only using the last generation of space telescope (Spitzer Telescope), and in the mid-IR wavelength range (i.e., in the range of energy free of dust absorption). For more distant AGNs is important the search of evidences of explosive and OF nuclear processes (i.e., supergiant shells, multiple OF emission lines components, emission line ratios associated with OF + shocks, etc) using multi wavelengths data obtained from the last generation of telescope+instruments. We expect to find these evidences in the analysis of BAL + IR + Fe ii QSOs (at low and medium redshift), and Sub-mm and Radio BAL QSOs (at high redshift) through deep Gemini GMOS-IFU spectroscopy plus HST data.
14.4 HyperNovae as the source of Neutrinos and Dark Matter
In the last sub-Section, we have explained that several groups already studied theoretically the generation of UHE-N and UHE-CR in GRBs. More specifically, for the HyN scenario Wang et al. (2007, 2008) found that in mildly relativistic ejecta of HyNe: the UHE-N could be generated by the interaction of the HyN UHE-CR and HyN UV-Optical photons. In addition, in the HyN scenario Vietri & Stella (1998, 1999) also analysed the generation of UHE-N associated with the collapse of neutron stars to black holes.
On the other hand, in the last decades a main issue in Astrophysics is the search of non-baryonic massive particles which does not interact strongly with ordinary matter: i.e., weakly interacting massive particles (WIMPSs; White 1988). One of the most attractive candidates for a WIMP are the neutrinos. Because their thermal motion are so significant, particles like massive neutrinos are known as Hot Dark Matter (HDM). Very recently, Lípari et al. (2007b) proposed that the discovery of different types of giant and extreme–SNe/HyNe (which generate UHE-N, UHE-CR, -Rays) strongly suggest that these neutrinos –generated by HyNe– are the probable origin of dark matter.
From the study of HyN 2006gy, Smith et al. (2007) proposed that giant–SN/HyN explosions from extreme massive progenitors could be more numerous –specially, in Population iii stars: i.e., in young objects and in the early universe– than previously believed. Thus, also the UHE-CR and UHE-N generated by explosion from massive and extreme massive star are probably more numerous than previously believed.
Therefore, it is expected that UHE-CR and UHE-N might have been generated in the young universe, and also in composite + explosive QSOs and AGNs (specially, in BAL + IR + Fe ii QSOs).
15 Confirmation of the Explosive Model (for BAL + IR + Fe ii QSOs)
15.1 Confirmation 1: Extreme Starburst and [O ii]3727 emission in the BAL + Fe ii + IR QSO SDSS 143821.40+094623.2
Very recently, from a detailed study of the [O ii]3727 emission line in QSOs from the very large sample of Sloan Digital Sky Survey Data Release 5 (SDSS DR5; Adelman-McCarthy et al. 2007: with 90596 spectra of QSOs), Lu et al. (2008, 2009, in preparation) reported for the low ionization BAL QSO SDSS 143821.40+094623.2 an extreme [O ii]3727 emission, plus large ELR [O ii]3727/[Ne iii]3869 and [O ii]3727/[O iii]5007. These results indicate (together with the large far-IR emission) that the [O ii]3727 came from an extreme starburst. Furthermore, this low ionization BAL QSO is an extreme Fe ii emitter. Thus, this is the first BAL + IR + Fe ii QSO with extreme [O ii]3727 emission (showing new evidence of extreme starbursts in this class of QSOs).
These results –detected in the BAL + IR + Fe ii QSO SDSS 143821.40+094623.2, at z 0.8– are an important and independent confirmation (using a very different method, to that used by us) of our proposition that extreme starbursts and the associated HyN + shells play a main role in the evolution of low ionization BAL + IR + Fe ii QSOs.
15.2 Confirmation 2 and 3: Explosive BAL + IR + Fe ii QSOs IRAS 17002+5153 & IRAS 07598+6508
Very recently, Lípari et al. (2008) presented the first results of the study of the BAL + IR + Fe ii QSOs IRAS 17002+5153 & IRAS 07598+6508, using Gemini + GMOS-IFU and HST data. These data show:
-
1.
IRAS 17002+5153: the 3D spectra in the region of the shells (Lípari et al. 2003) show multiple emission line components with typical properties and ELR of Liners associated with low velocity shocks.
-
2.
IRAS 07598+6508: the 3D spectra –to the north of the QSO– in the circumnuclear area where a possible shell was detected (at r of 2.38.0 kpc) show multiple emission line components also with typical properties and ELR of Liners/shocks.
These Gemini + HST results confirm our previous suggestion that these two similar low ionization BAL QSOs could be considered as exploding BAL + IR + Fe ii QSOs (Lípari 1994). Thus, these GMOS data are in good agreement with the explosive model for BAL + IR + Fe ii QSOs.
15.3 Future works and a New Explosive BAL QSO Candidate
Our programme of study of BAL QSOs and mergers with strong OF (using IFU and MOS Spectroscopy) include more than 30 objects already observed. Which are mainly low redshift BAL + IR + Fe ii QSOs, SDSS-Submm, SDSS-Radio low ionization BAL QSOs at medium and high redshift (in the range 0.5 z 3) and Ly emitters at redshift z 5–6. We are searching for new evidence of extreme explosions and starbursts in these systems with extreme OF (similar to those found in IRAS 04505-2958).
Finally we note that using GMOS-IFU spectra a detailed study BAL QSO SDSS 030000.56+004828.0 was started. This BAL QSO shows strong Ca ii + Fe ii BAL systems, extreme Fe ii emission and a strong fall in the blue continuum. These are typical spectral features of low ionization BAL + IR + Fe ii QSOs. Moreover, the spectrum of this SDSS BAL QSO is almost the same than the spectra of the prototype of explosive QSO Mrk 231. (i.e., a twin of Mrk 231). Thus SDSS 030000.56+004828.0 is a good candidate –at z = 0.9– for a new exploding BAL + Fe ii QSO.
16 Summary and Conclusions
In this work we have presented new results for the BAL QSO IRAS 045052958 obtained from a study of BAL + IR + Fe ii QSOs; based on very deep Gemini GMOS 3D spectroscopy, and HST images. We have studied in detail the outflow process and their associated structures, at two large galactic scales: two blobs/shells (S1 and S2) at radius r 0.2 and 0.4′′ (1.1 and 2.2 kpc); and an external hypergiant shell (S3) at r 2.0′′ (11 kpc). The presence of two external supergiant shells (S4 and S5) at r 10 and 15′′ (55, and 80 kpc) was discussed.
From this GMOS-IFU study the following main results were obtained:
-
1.
For the external hypergiant shell S3 at r 2.0′′ (11 kpc) the kinematics GMOS maps of the ionized gas ([O ii], [Ne iii], [O iii], H) show a small scale bipolar OF, with characteristics very very similar to those observed in the prototype of exploding external super shell in NGC 5514.
-
2.
The knots K1, K2 and K3 of this hypergiant shells S3 show a stellar population and emission line ratios consistent with the presence of a starburst + OF/shocks.
-
3.
The two internal shells S1 and S2 (at r 1 and 2 kpc) show multiple OF components with typical properties of nuclear shells.
-
4.
The shells S1+S2 and S3 are aligned at PA 131∘ with bipolar OF shape (at 10–15 kpc scale), and probably in the blow-out phase. In addition, the shells S4 and S5 (at 60–80 kpc) are aligned at PA 40∘, with also bipolar OF shape, which is perpendicular to the more internal OF.
-
5.
A strong blue continuum and multiple emission line components were found in all the observed GMOS field (including the shells, observed with GMOS: S1, S2 and S3).
-
6.
Using optical GMOS and HST data together wit the IR colour-colour evolutionary diagram for IRAS 04505-2958, IRAS 07598+6508 and IRAS 17002+5153 observation, we have confirmed that the QSO is likely the dominant source of ultra-luminous IR energy associated with IRAS 04505-2958. However, the starburst detected in the hyper shell S3 could be also a second source of IR energy.
The nature of the extreme and extended OF process in IRAS 045052958, with large and very large scale super/hyper shells (from 1 to 100 kpc) was discussed.
Thus, the new GMOS data show a good agreement with an extreme and explosive OF scenario for IRAS 04505-2958; in which part of the ISM of the host galaxy was ejected as multiple shells. This extreme OF process could be also associated with 2 main processes in the evolution of QSOs and their host galaxies: (i) the formation of young/satellite galaxies by giant explosions; and (ii) to define the final mass of the host galaxy, and even if the explosive nuclear outflow is extremely energetic, this process could disrupt an important fraction (or even all) of the host galaxy.
Finally, the role of HyNe in BAL + IR + Fe ii QSOs and AGNs was analysed. In particular, the generation of UHE cosmic rays and neutrino –associated with HyNe in BAL + IR + Fe ii QSOs– is discussed. We sugested that neutrinos associated with HyN could be the source of dark–matter.
Acknowledgments
This research is based mainly on observations obtained at the Gemini Observatory, which is operated by AURA under cooperative agreement with the NSF-USA on behalf of the Gemini partnership: NSF-USA, PPARC-UK, NRC-Canada, CONICYT-Chile, ARC-Australia, CNPq-Brazil and CONICET-Argentina. In addition, in this work we are using observations from CASLEO, La Palma, Cala Alto observatories, and from the archive of the NASA and ESA satellite HST (at ESO Garching and STScI–Baltimore). The authors thank C. Bornancini, L. Colina, H. Dottori, G. Dubner, J. C. Forte, D. M., M. Pastoriza and R. Sistero, for stimulating discussions and help. We also tank E. Bicca, A. Piatti, J. J. Claria, J. Santos for their observational templates of stellar populations. Special tanks to Susan Neff and J. Hutching for their authorization to adapted our Fig. 3 from their original figure; and also to Lu et al. for their authorization to comment their results of the BAL QSO SDSS 143821.40+094623.2. We like to thank specially to M. T. Ruiz and N. Suntzeff for their spectra of SN 1998E, obtained with the CTIO 4mt telescope. Finally, we wish to thank the referee for very constructive comments and suggestions, which helped to improve the content, presentation and discussion of the results of the paper.
References
- [2000] Abel T., Bryan G., & Norman M. L., 2000, ApJ, 540, 39
- [2007] Abraham J. et al. [for P. Auger Colaboration], 2007, Science, 318, 938
- [2007] Adelman-McCarthy J. et al., 2007, ApJS, 172, 634
- [2002] Allington-Smith J. et al., 2002, PASP, 114, 892
- [1999] Alton P., Davies J., Bianchi S., 1999, A&A, 343, 51
- [2000] Aloy M., Muller E., Ibanez J., Marti J., MacFadyen A., 2000, ApJ, 531, L119
- [1994] Arav N., Li Z., Begelman M., 1994, ApJ, 432, 62
- [1997] Arav N., Barlow T., Laor A., Blandford R., 1997, MNRAS, 288, 1015
- [1998] Arav N., Barlow T., Laor A., Sargent W., Blandford R., 1998, MNRAS, 297, 990
- [2001] Arav N. et al., 2001, ApJ, 561, 218
- [2005] Arav N., Kaastra J., Kriss G., Gabel J., Proga D., 2005, ApJ, 620, 665
- [1988] Armus L., Heckman T.M., & Miley G. 1988, ApJ 326, L45
- [1998] Arribas S. et al. 1998, SPIE, 3355, 821
- [1993] Artymowicz P., Lin D., Wampler E., 1993, ApJ, 409, 592
- [2002] Ajiki M. et al., 2002, ApJ, 576, L25
- [1978] Akima H., 1978, Trans. Math. Software (ACM), 4, 148
- [2003] Barth A., Martini P., Nelson C., Ho L., 2003, ApJ, 594, L95
- [1997] Becker R. et al., 1997, ApJ, 479, L93
- [2000] Becker R. et al., 2000, ApJ, 538, 72
- [2003] Bell E. F., 2003, ApJ, 586, 794
- [1969] Bevington P., 1969, Data Reduction and Error Analysis for the Physical Sciences (McGraw-Hill, New York)
- [1991] Berman B., Suchkov A., 1991, Ap&SS, 184, 169
- [2006] Berezinky B., Gazizov A., Grigorieva S., 2006, Phys. Rev. D, 47, 043005
- [1988] Bica E., 1988, A&A, 195, 76
- [1985] Binette L., Dopita M., Tuohy I., 1985, ApJ, 297, 476
- [2003] Bloom J., 2003, in IAU Colloquium 192: Supernovae (“10 years of SN1993J”), arXiv: 0403549
- [2002] Bloom J., Kulkarni S., Djorgovski S., 2002, AJ, 123, 1111
- [1993] Boller Th., Trumper J., Molendi S., Fink H., Schaeidt S., Caulet A., Dennefeld M., 1993, A&A, 279, 53
- [1996] Boller Th., Brandt W., Fink H., 1996, A&A, 305, 53
- [2001] Bond N., Churchill C., Charlton J., Vogt S., 2001, ApJ, 562, 641
- [2002] Boroson T., 2002, ApJ, 565, 78
- [1992] Boroson T., Meyer K., 1992, ApJ, 397, 442
- [1992] Boroson T., Green R., 1992, ApJS, 80, 109
- [1991] Boroson T., Meyers K., Morris S., Persson S., 1991, ApJ, 370, L19
- [1997] Bottorff M., Korista K., Shlosman I., Blandford R., 1997, ApJ, 479, 200
- [1996] Boyce P. et al., 1996, ApJ, 473, 760
- [1981] Branch D., Falk S., McCall M., Rybski P., Uomoto A., 1981, ApJ, 244, 780
- [2000] Brandt W., Gallagher S., 2000, New Astron. Rev., 44, 461
- [2002] Bromm V., Coppi P., Larson R., 2002, ApJ, 564, 23
- [2003] Bromm V., Loeb A., 2003, Nat, 425, 812
- [2001] Canalizo G., Stockton A., 2001, ApJ, 555, 719
- [1984] Canto J., 1984, in M. Peimbert Ed., Temas Selectos de Astrofisica (Univ. Nac. Autonoma de Mexico), p. 115
- [2004a] Chapman S. et al., 2004a, ApJ, 606, 85
- [2004b] Chapman S. et al., 2004b, ApJ, 614, 671
- [2008] Chevalier R., Fransson C., 2008, ApJ, preprint, arXiv: 0806.0371
- [1992] Colina L., Perez-Olea D., 1992, MNRAS, 259, 709
- [1995] Colina L., Perez-Olea D., 1995, MNRAS, 277, 845
- [2001] Colina L., Alberdi D., Torelles M., Panagia N., Wilson A.S., 2001, ApJ, 553, L19
- [1968] Colgate S. A., 1968, Can. J. Phys., 46, 476
- [2006] Colgate S. et al., 2006, Nature, 442, 1008
- [1999] Collin S., Zahn P., 1999, A&A, 344, 433
- [1991] Conti P. S., 1991, ApJ 377, 115
- [2001] Dai Z., Lu T., 2001, ApJ, 551, 249
- [1987] de Grijp M., Miley G., Lub J., 1987, A&ASS, 70, 95
- [1992] de Grijp M., Keel W., Miley G., Goudfrooij P., Lub J., 1992, A&ASS, 96, 389
- [2001] de Kool M., Arav N., Becker R., Gregg M., White R., Laurent-Muehleisen S., Price T., Korista K., 2001, ApJ, 548, 609
- [2002] de Kool M., Becker R., Arav N., Gregg M., White R., 2002, ApJ, 570, 514
- [2002] Dawson S. et al. 2002, ApJ, 570, 92
- [2004] Della Valle M. et al., 2004, In AIP Conf. Proc. 62: GRB and Afterglow Astronomy, p. 393
- [2006] Della Valle M. et al., 2006, Nature, 444, 1050
- [2002] Dermer C., 2002, ApJ, 574, 65
- [2003] Dermer C., 2003, Phys. Rev Lett., 91, 071102
- [2007a] Dermer C., 2007a, ApJ, 664, 384
- [2007b] Dermer C., 2007b, Proceding of the 30th ICRS, Merida, Mexico, 2007
- [2006] Dermer C., Atoyan A., 2006, New Journal of Phys., 8, 122
- [2003] Dermer C., Mitman K., 2003, ASP Conference Series: Third Rome Workshop on GRB in the Afterglow Era, arXiv: 0301340
- [2009] Dermer C., Razzaque S., Finke J., Atoyan A., 2009, New Journal Phys., arXiv: 0811.1160
- [1997] Dey A. et al. 1997, ApJ, 490, 698
- [2002] Dietrich M., Appenzeller I., Vestergaard M., Wagner S., 2002, ApJ, 564, 581
- [1994] Dopita M., 1994, in Bicknell G., Dopita M., Quin P., eds., The Physics of Active Galaxies, (ASP Conf. Series Vol. 54), p. 287
- [1995] Dopita M., 1995, Astrop Sp. Sc., 233, 215
- [1995] Dopita M., Sutherland R., 1995, ApJ, 455, 468
- [1992] Dyson J., Perry J., Williams R., 1992, in Testing the AGN Paradigm, eds. S. Holt, S. Neff, M. Urry (AIP, New York) 548
- [2007] Ellison M. et al., 2007, ApJ, 661, 879
- [2000] Everett J., Konigl A., Kartje J., 2000, in Petterson, R. Polidan, R. Pogge eds., ASP Conference Serie, Probing the Physics of Active Galactic Nuclei by Multiwavelength Monitoring, in press (arXiv: 0010246)
- [2005] Fan Y., Zhang B., Wei D., 2005, ApJ, 629, 334
- [2007] Feain I., Papadopoulos P., Eker R., Middelberg E., 2007, ApJ, 662, 872
- [2005] Fernandes R. C., Mateus A., Sodre L., Stasinska G., Gomez J., 2005, MNRAS, 358, 363
- [2001] Francis P. et al. 2001, ApJ, 554, 1001
- [1993] Franco J. et al., 1993, ApJ, 407, 100
- [2003] Freudling W., Corbin M., Korista K., 2003, ApJ, 587, L67
- [2002] Frye B., Broadhurst T., Benitez N., 2002, ApJ, 568, 558
- [2001] Fryer C., Woosley S., Heger A., 2001, ApJ, 550, 372
- [1998] Galama T. et al., 1998, Nat, 395, 670
- [2000] Galama T. et al., 2000, ApJ, 536, 185
- [2002] García-Lorenzo B., Acosta-Pulido J., & Megias-Fernandez E., 2002, in Rosado M., Binette L., Arias L., eds., ASP Conf. Ser. Vol. 282 Galaqxies: The Third Dimension, San Francisco, p. 501
- [1997] Guillemin P., Bergeron J., 1997, A&A, 328, 499
- [1999] Gonzalez Delgado R., Leitherer C., Heckman T.M., 1999, ApJS, 125, 489
- [1989] Goodrich R., 1989, ApJ, 342, 224
- [2007] Grupta N., Zhang B., 2007, Astropart. Phys., 27, 386
- [2006] Haehnelt M., Davies M., Rees M., 2006, MNRAS, 366, L22
- [2002] Hall P.B. et al., 2002, ApJS, 141, 267
- [1987] Halpern J., Oke J., 1987, ApJS, 312, 91
- [2003] Hamann F., Sabra B., 2003, in G. Richards & P.B. Hall, eds., AGN Physics with the SDSS, ASP Conference Serie, arXiv: 0310668
- [1984] Hazard C., Morton D., Terlevich R., McMahon R., 1984, ApJ, 282, 33
- [1987] Heckman T.M., 1987, in E. Ye. Khachikian, K. Fricke, J. Melnick, eds., Observational Evidence of Activity in Galaxies, (Dordrecht: Reidel), p. 421
- [1996] Heckman T.M., 1996, in M. Eracleous, A. Koratkar, C. Leitherer, L. Ho, eds., The Physics of LINERs in View of Recent Observations, (ASP Conf. Series Vol. 103), p. 241
- [1987] Heckman T.M., Armus L., Miley G., 1987, AJ, 93, 276
- [1990] Heckman T.M., Armus L., Miley G., 1990, ApJS, 74, 833
- [2000] Heckman T.M., Lehnert M., Strickland D., Armus L., 2000, ApJS, 129, 493
- [1979] Heiles C., 1979, ApJ, 229, 533
- [1987] Heiles C., 1987, ApJ, 315, 555
- [2002] Heger A., Woosley S., Baraffe I., Abel T., 2002, in Ligthhouses of the Universe: The Most Luminous Celestial Objects and Their Use in Cosmology, ed. M. Gilfanov, R. Sunyaev & E. Curazov (Berlin: Springer), 369
- [2003] Heger A., Fryer C., Woosley S., Langer N., Hartmann D., 2003, ApJ, 591, 288
- [2002] Heger A., Woosley S., 2002, ApJ, 567, 532
- [2003] Hjorth J. et al., 2003, Nat, 423, 847
- [1987] Hutching J., Neff S., 1987, AJ, 93, 14
- [1988] Hutching J., Neff S., 1988, AJ, 96, 1575
- [1995] Hines D., Wills B., 1995, ApJ, 448, L69
- [1999] Hines D. et al., 1999, ApJ, 512, 140
- [2006] Hoffman L., Loeb A., 2006, ApJ, 638, L75
- [2008a] Hu C. et al., 2008a, ApJ, 683, L115
- [2008b] Hu C. et al., 2008b, ApJ, 687, 78
- [1981] Ikeuchi S. 1981, PASJ 33, 211
- [1986] Ikeuchi S., & Ostriker J. 1986, ApJ 301, 522
- [2005] Inoue S., Aharonian F., Sugiyama N., 2005, ApJ, 628, L9
- [1998] Iwamoto K. et al., 1998, Nature, 395, 672
- [2002] Iwamuro F. et al. 2002, ApJ, 565, 63
- [2009] Jahnke K., Elbaz D., Pantin E., Bohm A., Letawe G., Chantry V., Lagage P., 2009, ApJ, submitted,
- [2003] Kawakatu M., Umemura M., Mori M., 2003, ApJ, 583, 85
- [2007] Kawakatu M., Imanishi M., Nagao T., 2007, ApJ, 661, 660
- [1996] Keel W., 1996, ApJS, 106, 27
- [1999] Keel W. et al. 1999, AJ, 118, 2547
- [2008] Komossa S., 2008, RevMexAA, 32, 86
- [1998] Kim D.-C., Sanders D., 1998, ApJS, 119, 41
- [2002] Kim D.-C., Veilleux S., Sanders D., 2002, ApJS, 143, 277
- [2007] Kim M., Ho L., Peng Ch., Im M., 2007, ApJ, 658, 107
- [1998] Kunth D., Mas-Hesse J., Terlevich E., Terlevich R., Lequeux J., Fall M., 1998, A&A, 334, 11
- [1998] Kulkarni S. et al., 1998, Nature, 395, 663
- [2005] Lamb D., Donaghy T., Graziani C., 2005, ApJ, 620, 355
- [1997] Lawrence A., Elvis M., Wilkes B., McHardy I., Brandt N., 1997, MNRAS, 285, 879
- [1995] Lehnert M., Heckman T. M., 1995, ApJS, 97, 89
- [1996] Lehnert M., Heckman T. M., 1996, ApJ, 462, 651
- [2008] Letawe G., Magain P., Courbin F., 2008, A&A, 480, 69
- [2009] Letawe G., Magain P., Chantry V., Letawe Y., 2009, MNRAS, pre-print (arXiv: 0903.1781)
- [2006] Li L.-X., 2006, MNRAS, 372, 1357
- [2007] Li L.-X., 2007, MNRAS, 375, 240
- [2008] Li L.-X., 2008, MNRAS, 388, 603
- [1994] Lípari S.L., 1994, ApJ, 436, 102
- [2006] Lípari S.L., Terlevich R., 2006, MNRAS, 368, 1001
- [1991] Lípari S.L., Bonatto Ch., Pastoriza M., 1991, MNRAS, 253, 19
- [1993] Lípari S.L., Terlevich R., Macchetto F., 1993, ApJ, 406, 451
- [1994] Lípari S.L., Colina L., Macchetto F., 1994, ApJ, 427, 174
- [1997] Lípari S.L., Tsvetanov Z., Macchetto F., 1997, ApJS, 111, 369
- [2000] Lípari S.L., Diaz R., Taniguchi Y., Terlevich R., Dottori H., Carranza G., 2000, AJ, 120, 645
- [2003] Lípari S.L., Terlevich R., Diaz R., Taniguchi Y., Zheng W., Tsvetanov Z., Carranza G., Dottori H., 2003, MNRAS, 340, 289
- [2004a] Lípari S.L., Mediavilla E, Diaz R., Garcia-Lorenzo B, Acosta-Pulido J., Agüero M.,Terlevich R., 2004a, MNRAS, 348, 369
- [2004b] Lípari S.L. et al., 2004b, in T. Storchi Bergmann, L. Ho, H. Schmitt, eds., The Interplay among Black Hole Stars and IGM in Galactic Nuclei, IAU Symp. No. 222, (ASP Conf. Series), p. 529
- [2004c] Lípari S.L. et al., 2004c, MNRAS, 354, L1
- [2004d] Lípari S.L. et al., 2004d, MNRAS, 355, 641
- [2005a] Lípari S.L. et al., 2005a, MNRAS, 360, 416
- [2005b] Lípari S.L. et al., 2005b, Bol. AAA Meeting, No. 48, 391
- [2005c] Lípari S.L. et al., 2005c, Bol. AAA Meeting, No. 48, 409
- [2006] Lípari S.L. et al., 2006, Bol. AAA Meeting, No. 49, 267
- [2007a] Lípari S.L. et al., 2007a, Bol. AAA Workshop of Theoretical Astronomy in Argentina, pag. 55 (arXiv: 0707.1493).
- [2007b] Lípari S.L. et al., 2007b, Bol. AAA Meeting, No. 50, 259 (arXiv: 0712.0288)
- [2008] Lípari S.L. et al., 2008, Bol. AAA Meeting, No. 51, in press.
- [2009] Lípari S.L. et al., 2009, MNRAS, 392, 1295 [Paper i]
- [2006] Lonsdale C.J., Diamond P., Thrall H., Smith H., Lonsdale C.J., 2006, ApJ, 647, 185
- [1988] Low F.J., Huchra J., Kleinmann S., Cutri R., 1988, ApJ, 327, L41
- [1989] Low F.J., Cutri R., Kleinmann S., Huchra J., 1989, ApJ, 340, L1
- [2008] Lu H. et al., 2008, ApJL, Submitted
- [1989] Mac Low M., McCray R., Norman M., 1989, ApJ, 337, 141
- [2005] Magain P., Letawe G., Courbin F., Jablonka P., Jahnke K., Meyland J., Wizotski L., 2005, Nature, 437, 381
- [2003] Maiolino R., Juarez Y., Mujica R., Nagar N., Oliva E., 2003, ApJ, 596, L155
- [2004a] Maiolino R., Oliva E., Ghinassi F., PedaniM., Mannucci F., Mujica R., Juarez Y., 2004a, A&A, 420, 889
- [2004b] Maiolino R., Schneider R., Oliva E., Bianchi S. Ferrara A. Mannucci F., Pedani M., Roca Sogorb M., 2004b, Nat, 431, 533
- [2004] Malesani D. et al., 2004, ApJ, 609, L5
- [2003] Mas-Hesse J., Kunth D., Tenorio-Tagle G., Leitherer C., Terlevich R., Terlevich E., 1998, ApJ, 598, 858
- [2004] Matsuda Y. et al., 2004, AJ, 128, 569
- [2000a] Mathur S., 2000a, New Astron. Rev., 44, 469
- [2000b] Mathur S., 2000b, ApJ, 314, L17
- [2003] Mazzali P. et al., 2003, ApJ, 599, L95
- [2003] Mazzali P. et al., 2003, Nature, in press (arXiv: 0807.1695)
- [2006] Meszaros P., Rezzaque S., 2006, in Energy budget in the Early Universe, Wokshop (arXiv: 0605166)
- [2006] Merrit D. et al., 2006, MNRAS, 367, 1746
- [1995] Milgron M., Usov V., 1995, ApJ, 449, L37
- [2006] Mizuta A., Yamasaki T., Nagataki S., Mineshige S., 2006, ApJ, 651, 690
- [2008] Murase K., Inoue S., Nagataki S., 2008, ApJ, 689, L105 arXiv: 0805.0104
- [2006] Murase K., Ioka K., Nagataki S., Nakamura T., 2006, ApJ, 651, L5
- [2008] Murase K., Ioka K., Nagataki S., Nakamura T., 2008, Phys. Rev. D, 78, 023005
- [1995] Murray N., Chiang J., Grossman S., Voit G., 1995, ApJ, 464, 641
- [1999] Nakamura F., Umemura M., 1999, ApJ, 515, 239
- [1988] Neff S., Ulvestad J., 1988, AJ, 96, 841
- [2004] Nomoto K., Maeda K., Mazzali A., Umeda H., Deng J., Iwamoto K., 2004, in Stellar Colapse, ed. C. Fryer (Dordretch: Kluwer), p. 277 (arXiv: 0309136)
- [2006] Nomoto K., Tominaga N., Umeda H., Kobayashi Ch., Maeda K., 2006, in Langanke K. Ed., Special Issue on Nuclear Astrophysics, preprint (arXiv: 0605725)
- [2007a] Nomoto K., Tominaga N., Tanaka M., Maeda K., Suzuki T., Deng J., Mazzali A., 2007a, Proc. of the Conference ”SWIFT and GRBs: Unveiling the Relativistic Universe”, preprint (arXiv: 0702472)
- [2007b] Nomoto K., Tominaga N., Tanaka M., Maeda K., Umeda H., 2007b, in ”SN 1987A: 20 Years After SN and GRB Bursters”, eds. S. Immler, K. Weiler, & R. McCray, American Inst. of Phys., in press (arXiv: 0707.2187)
- [2007c] Nomoto K., Tanaka M., Tominaga N., Maeda K., Mazzali A., 2007c, New Astron. Rev, in press (arXiv: 0707.2219)
- [2008] Nomoto K., Tominaga N., Tanaka M., Maeda K., Umeda H., 2008, in ”Massive Stars & Cosmic Engines, Proc IAU Symp No. 250, eds. F. Bresolin, P. Crowther, J. Puls, in press (arXiv: 0803.1964)
- [1984] Norman C., Miley G., 1984, AA, 141, 85
- [1989] Norman C., Ikeuchi S., 1989, ApJ, 395, 372
- [2006] Ohkubo T., Umdeada H., Maeda K., Nomoto K., Suzuki T., Tsuruta S., Rees M., 2006, ApJ, 645, 1352
- [1985] Osterbrock D., Pogge R., 1985, ApJ, 297, 166
- [1981] Ostriker J.P., Cowie L.L., 1981, ApJ, 243, L127
- [1998] Paczynski B., 1998, ApJ, 494, L45
- [2008] Papadopoulos P., Feain I., Wagg J., Wilner D., 2007, ApJ, 684, 845
- [2007] Parra R., Conway J., Diamond P., Thrall H., Lonsdale C.J., Lonsdale C.J., Smith H., 2007, ApJ, 659, 314
- [1992] Perry J., 1992, in Relationships Between AGN and Starburst Galaxies, ed. A. Filippenko (ASP Conf.S.31, San Francisco) 169
- [1992] Perry J., Dyson R., 1992, in Testing the AGN Paradigm, eds. S. Holt, S. Neff, M. Urry (AIP, New York) 553
- [2006] Pian E. et al., 2006, Nature, 442, 1011
- [2000] Pian E., Amati L., Butler R., Costa E. et al., 2000, ApJ, 536, 778
- [2002] Piatti A., Bica E., Claria J., Santos J., Ahumada A., 2002, MNRAS, 335, 233
- [2009] Popovic L. et al., 2009, AJ, in press (arXiv: 0812.4817)
- [2003] Price P., Kulkarni S., Berger E., Fox D., Bloom J., 2003, ApJ, 589, 838
- [2005] Punsly B., Lípari S., 2005, ApJ, 623, L101
- [2007] Quimby N. et al., 2007, ApJ, 668, L99
- [2006] Quillen, A. C. et al., 2006, ApJ, 641, L29
- [2004] Razzaque S., Meszaros P., Waxman E., 2004, Phys. Rev. D, 69, 023001
- [2003] Reuland M. et al., 2003, ApJ, 532, 170
- [1963] Roederer Juan G. 1963, Mecanica Elemental. Editorial Eudeba, Buenos Aires
- [2004] Sanchez S.F, 2004, AN, 325, 167
- [2004] Sanchez S.F., Garcia-Lorenzo B., Mediavilla E., Gonzales-Serrano J., Cristensen L., 2004, ApJ, 615, 156
- [2005] Sanchez S.F., 2006, Astron. Nachr., in press (arXiv: 0606263)
- [2005] Sanchez S.F., Cardiel N., 2005, Calar Alto Newsletter, No. 10
- [2006a] Sanchez S.F., Garcia-Lorenzo B., Jahnke K., Mediavilla E., Gonzales-Serrano J., Cristensen L., 2006a, New Astron. Revew, 49, 501
- [2006b] Sanchez S.F., Garcia-Lorenzo B., Jahnke K., Mediavilla E., Gonzales-Serrano J., Cristensen L., Wisotzqi L., 2006b, Astron. Nachr, 327, 167
- [1988] Sanders D.B., Soifer B.T., Elias J.H., Madore B.F., Matthews K., Neugebauer G., Scoville N.Z., 1988, ApJ, 325, 74
- [1996] Sanders D.B., Mirabel F., 1996, ARA&A, 34, 749
- [1995] Scoville N.Z., Norman C., 1995, ApJ, 451, 510
- [1980] Shull M., 1980, ApJ, 237, 769
- [1977] Shull M., McKee 1979, ApJ, 227, 122
- [2004] Silich S. et al., 2004, ApJ, 597, 279
- [2005] Silich S., Tenorio-Tagle G., Anorve Zeferino G., 2005, ApJ, 635, 1116
- [2008] Silich S., Hueyot-Zahuantitla F., Tenorio-Tagle G., 2008, Mem. S. A.. It., in press arXiv: 0807.2662
- [1992] Silva D., Cornel M., 1992, ApJS, 81, 865
- [1998] Smith H., Lonsdale C., Lonsdale C., & Diamond P. 1998, ApJ 493, L17
- [2007] Smith N. et al., 2007, ApJ, 666, 1116
- [2008] Smith N. et al., 2008, ApJ, in press (arXiv: 0804.0042)
- [2006] Soderberg A. et al., 2006, ApJ, 638, 930
- [2008] Soderberg A. et al., 2008, Nature, 453, 489
- [2005] Stenek K. et al., 2005, ApJ, 626, L5
- [2000] Steidel C. et al., 2000, ApJ, 532, 170
- [2000] Strickland, D, Stevens, I., 2000, MNRAS, 314, 511
- [1994] Suchkov A., Balsara D., Heckman T., Leitherer C., 1994, ApJ, 430, 511
- [1996] Suchkov A., Berman V., Heckman T., Balsara D., 1996, ApJ, 463, 528
- [2000] Sulentic J., Marziani P., Dultzin-Hacyan D., 2000, ARA&A, 38, 521
- [2005] Suwinbank A. et al.,2005, MNRAS, 359, 401
- [2000] Taniguchi Y., Shioya K., 2000, ApJ, 532, L12
- [2008] Tanaka Y. et al., 2008, ApJ, preprint (arXiv: 0807.1674)
- [1988] Tenorio-Tagle G., Bodenheimer P., 1988, ARA&A, 26, 145
- [1990] Tenorio-Tagle G., Rozyczka M., Bodenheimer P., 1990, A&A, 237, 207
- [1999] Tenorio-Tagle G., Silich S., Kunth D., Terlevich E., Terlevich R., 1999, MNRAS, 309, 332
- [2003a] Tenorio-Tagle G. et al., 2003a, ApJ, 597, 279
- [2003b] Tenorio-Tagle G., Silich S., Munoz-Tunon C., 2003b, RevMexAA, preprint, arXiv: 0303120
- [2005] Tenorio-Tagle G. et al., 2005, ApJ, 620, 217
- [2006] Tenorio-Tagle G., Munoz-Tunon C., Perez E., Silich S., Telles E., 2006, ApJ, in press arXiv: 0601631
- [1992] Terlevich R. et al., 1992, MNRAS, 255, 713
- [1993] Terlevich R. et al. 1993, in First Light in the Universe: Star or QSOs, eds. B. Rocca-Volmerange, M. Dennefeld, B. Guiderdoni, & Tran Thanh Van (Editions Frontieres), p 261
- [2007] Tominaga N., 2007, ApJ, in press, (arXiv: 0711.4815)
- [2007a] Tominaga N., Maeda K., Umeda H., Nomoto K., Tanaka M., Iwamoto N., Suzuki T., Mazzali A., 2007, ApJ, in press, (arXiv: 0702471)
- [1988] Tomisaka K., & Ikeuchi S. 1988, ApJ, 330, 695
- [1997] Turnsheck D., Monier E., Sirola C., Espey B., 1997, ApJ, 476, 40 Krichbaun T., 1999b, ApJ, 517, L81
- [1994] Veilleux S., Bland-Hawthorn J., Tully R., Filippenko A., Sargent W., 1994, ApJ, 433, 48
- [1999] Veilleux S., Kim D., Sanders D., 1999, ApJ, 522, 113
- [2002] Veilleux S., Cecil G., Bland–Hawthorn J., Shopell P., 2002, in Henney W., Steffe W., Raga A., Binette L., eds., Rev. Mex. Astron. Astrofis. Serie Conf. Vol.. 13, Emission Lines from Jets FGlows. UNAM, Mexico, 222
- [2006] Veron M., Joly M., Veron P., Boroson T., Lípari S, Ogle P., 2006, A&A, 451, 851
- [1995] Vietri M., 1995, ApJ, 453, 883
- [1998a] Vietri M., 1998a, Phys. Rev. Lett., 80, 3690
- [1998b] Vietri M., 1998b, ApJ, 507, 40
- [2003] Vietri M., 2003, preprint arXiv: 0212352
- [2003] Vietri M., De Marco D., Guetta D., 2003, arXiv: 0302144
- [1998] Vietri M., Stella L., 1998, ApJ, 507, L45
- [1999] Vietri M., Stella L., 1999, ApJ, 527, L43
- [1993] Voit G., Weymann R., Korista K., 1993, ApJ, 413, 95
- [1999] Wang Q., 1999, ApJ, 517, L27
- [2007] Wang X.-Y., Razzaque S., Meszaros P., Dai Z., 2007, Phys. Rev. D, 76, 083009 (arXiv: 0705.0027)
- [2008] Wang X.-Y., Razzaque S., Meszaros P., 2008, ApJ, 677, 432 (arXiv: 0711.2065)
- [1995] Waxman E., 1995, Phys. Rev. Lett., 75, 386
- [1997] Waxman E., Bahcall J. N., 1997, Phys. Rev. Lett., 78, 2292
- [1999] Waxman E., Bahcall J. N., 1999, Phys. Rev. D, 59, 023002
- [2000] Waxman E., Bahcall J. N., 2000, ApJ, 541, 707
- [2002] Weiler K., Panagia N., Montes M., Sramek R., 2002, ARA&A, 40, 387
- [1991] Weymann R. et al., 1991, ApJ, 373, 23
- [2006] White R., Helfand D., Becker R., Glikman E., Vries W., 2006, ApJ, 654, 99
- [1988] White S., 1988, in Second Meeting of Astronomia Extragalactica (Cordoba, Argentina), Boletin A.N.C., Tomo 58, pag. 209
- [2004] Wick L., Dermer C., Atoyan A., 2004, Astrop. Phys., 21, 125
- [1993] Woosley S., 1993, ApJ, 405, 273
- [2006] Woosley S., Bloom J., 2006, ARA&A, 44, 507
- [2006] Woosley S., Heger A., 2006, ApJ, 637, 914
- [1986] Woosley S., Weber T., 1986, ARA&A, 24, 205
- [2008] Xu D., Zou Y.-C, Fang Y.-C., 2008, ApJ, submitted (arXiv: 0801.4325)
- [2003] Zhang W., Woosley S., Heger A., 2003, ApJ, 356, 365
- [2004] Zhang W., Woosley S., Heger A., 2004, ApJ, 608, 365
- [2007] Zhou X.-L., Yang F., Lu X.-R., Wang J.-M., 2007, AJ, 133, 432
| Object | Date | Telescope/ | Spectral region | Expos. time | Comments |
|---|---|---|---|---|---|
| instrument | [s] | ||||
| I04505-2958 | 2005 Oct 07 | 8.1 m Gemini+GMOS-IFU | R400, 5260–9440 Å | 18002 | Seeing-FWHM = 09 |
| I04505-2958 | 2005 Dec 25 | 8.1 m Gemini+GMOS-IFU | B600, 4770–7600 Å | 18001 | Seeing-FWHM = 05 |
| I04505-2958 | 2005 Dec 26 | 8.1 m Gemini+GMOS-IFU | B600, 4770–7600 Å | 18001 | Seeing-FWHM = 04 |
| I04505-2958 | 2007 Feb 14 | 8.1 m Gemini+GMOS-IFU | R831, 7440–9500 Å | 12001 | Seeing-FWHM = 05 |
| I04505-2958 | 2007 Feb 14 | 8.1 m Gemini+GMOS-IFU | B600, 3350–6150 Å | 12001 | Seeing-FWHM = 09 |
| I04505-2958 | 1995 Sep 30 | HST+WFPC2 | F702W, 6895/1389 Å(R) | 1800 | Seeing-FWHM = 01, archival |
| I04505-2958 | 2004 Oct 01 | HST+ACS | F606W, 5907/2342 Å(V) | 990 | Seeing-FWHM = 01, archival |
| I04505-2958 | 1996 Nov 18 | HST+FOS | G190H, 1570–2300 Å | 1620 | archival (specra) |
| Knots/Regions | X | Y | Deff |
|---|---|---|---|
| [′′] | [′′] | [′′] | |
| Shell S1 | |||
| Area S1-A1 | 0.00 | -0.20 | 0.15 |
| Area S1-A2 | 0.17 | -0.10 | 0.15 |
| Shell S2 | |||
| Area S2-A1 | 0.00 | -0.40 | 0.15 |
| Area S2-A2 | 0.17 | -0.30 | 0.15 |
| Shell S3 | |||
| Knot S3-K1 | -0.21 | 1.40 | 0.11 |
| Knot S3-K2 | 0.17 | 1.50 | 0.25 |
| Knot S3-K3 | -0.17 | 1.70 | 0.10 |
| Knot S3-K4 | -0.52 | 1.90 | 0.20 |
| Knot S3-K5 | -0.52 | 1.70 | 0.20 |
| Regions | |||
| region R1 | -1.56 | 0.00 | 0.15 |
| region R2a | 0.17 | -0.90 | 0.15 |
| region R2b | 0.17 | -1.10 | 0.15 |
| region R3 | 0.17 | 3.10 | 0.15 |
| region R4 | -0.69 | 0.80 | 0.17 |
Notes:
Column 2 and 3: The offset positions of the knots [X,Y]
are given from the QSO-core position (as 0′′,0′′).
The Y-axis was aligned at the postion angle PA 131∘.
Column 4: Deff are the effective diameters of the knots
(derived using the HST-WFPC F702W/R image).
| Emission Line Component | z | cz | V(OF) |
|---|---|---|---|
| [km s-1] | [km s-1] | ||
| QSO-core | |||
| Main Component Em. (MC-EMI) | 0.28600 | 85800 | — |
| Blue OF Component-1 (OF-EB1) | 0.20300 | 84900 | -900 |
| Blue OF Component-2 (OF-EB2) | 0.28033 | 84100 | -1700 |
| Blue OF Component-3 (OF-EB3) | 0.27700 | 83100 | -2700 |
| Red OF Component (OF-ER ) | 0.29150 | 87450 | +1650 |
| Shell S3 | |||
| Main Component Em. (MC-S3-EMI) | 0.28650 | 85950 | — |
| Blue OF Component-1 (OF-S3-EB1) | 0.28483 | 85450 | -500 |
| Blue OF Component-2 (OF-S3-EB2) | 0.28217 | 84650 | -1300 |
| Red OF Component (OF-S3-ER ) | 0.29550 | 87150 | +1200 |
| Lines | Component | Fluxes | FWHM |
| QSO-Core | [km/s] | ||
| [O ii]3727 | MC-EMI | 8.8 | 480 |
| OF-EB1 | 1.0 | 170 | |
| H113771 | MC-EMI | (0.8) | (830) |
| H103798 | MC-EMI | 1.2 | 790 |
| H93835 | MC-EMI | (0.3) | (2150) |
| MC-EMI | 2.0 | 700 | |
| MC-EMI 1-Compon. | 2.4 | 880 | |
| [Ne iii]3869 | MC-EMI | 6.8 | 540 |
| OF-EB1 | 0.9 | 180 | |
| H83889 | MC-EMI | (0.5) | (2100) |
| MC-EMI | 4.7 | 650 | |
| MC-EMI 1-Compon+OF | 5.5 | 940 | |
| H3970 | MC-EMI | 6.0 | 2020 |
| MC-EMI | 10.0 | 740 | |
| OF-EB1 | 0.5 | 210 | |
| OF-EB2 | 0.4 | 190 | |
| MC-EMI 1-Compon+OF | 17.0 | 1090 | |
| H4102 | MC-EMI | 10.0 | 2490 |
| MC-EMI | 12.0 | 700 | |
| OF-EB1 | 0.6 | 250 | |
| OF-EB2 | 0.5 | 230 | |
| MC-EMI 1-Compon+OF | 22.0 | 1120 | |
| MC-EMI 1-Compon. | 25.0 | 1350 | |
| [Fe v]4181 | MC-EMI | 5.9 | 980 |
| H4340 | MC-EMI | 11.0 | 2200 |
| MC-EMI | 20.0 | 730 | |
| OF-EB1 | 0.7 | 240 | |
| OF-EB2 | 0.6 | 210 | |
| OF-EB3 | 0.6 | 200 | |
| MC-EMI 1-Compon+OF | 29.0 | 1070 | |
| MC-EMI 1-Compon. | 32.0 | 1330 | |
| Fe ii4489+91 | MC-EMI | 3.5 | 820 |
| Fe ii4523 | MC-EMI | 5.3 | 800 |
| Fe ii4556 | MC-EMI | 4.8 | 780 |
| Fe ii4583 | MC-EMI | 5.2 | 790 |
| Fe ii4629 | MC-EMI | 5.4 | 810 |
| Fe ii4661 | MC-EMI | 5.6 | blend |
| Lines | Component | Fluxes | FWHM |
| QSO-Core | [km/s] | ||
| H4861 | MC-EMI | 20.0 | 2050 |
| MC-EMI | 24.0 | 780 | |
| MC-EMI | ( 4.0) | (230) | |
| OF-EB1 | 0.9 | 260 | |
| OF-EB2 | 0.7 | 235 | |
| OF-EB3 | 0.7 | 210 | |
| MC-EMI 1-Compon+OF | 44.0 | 1050 | |
| MC-EMI 1-Compon. | 48.0 | 1300 | |
| Fe ii (42)4925 | MC-EMI | 3.1 | 830 |
| [O iii]5007 | MC-EMI | 13.0 | 610 |
| MC-EMI | 5.0 | 280 | |
| MC-EMI 1-Compon. | 19.1 | 530 | |
| Fe ii5159 | MC-EMI | 2.5 | 780 |
| Fe ii5169 | MC-EMI | 3.0 | 730 |
| Fe ii5198 | MC-EMI | 2.8 | 720 |
| Fe ii5220 | MC-EMI | 4.4 | 810 |
| Fe ii5235 | MC-EMI | 3.6 | 690 |
| Fe ii5276 | MC-EMI | 4.2 | 660 |
| Fe ii5317 | MC-EMI | 3.8 | 650 |
| Fe ii5362 | MC-EMI | 3.0 | 620 |
| Fe ii5385 | MC-EMI | 4.0 | 800 |
| [O i]6300 | MC-EMI | — | — |
| H6563 | MC-EMI | 73.0 | 2150 |
| MC-EMI | 72.0 | 800 | |
| OF-EB1 | 2.3 | 210 | |
| OF-EB2 | 2.1 | 200 | |
| OF-EB3 | 2.2 | 210 | |
| OF-ER3 | 1.0 | 220 | |
| MC-EMI 1-Compon+OF | 140.0 | 1020 | |
| MC-EMI 1-Compon. | 151.0 | 1240 | |
| [N ii]6583 | MC-EMI | — | — |
| [S ii]6717/31 | MC-EMI | (1.6) | (280) |
| [S ii]6731 | MC-EMI | (2.0) | (300) |
| H/H | MC-EMI | 3.00 | |
| Fe ii4570/H | MC-EMI | 1.24 | |
| [O iii]5007/H | MC-EMI | 0.54 |
Column 2: emission line components (see Section 5).
Column 3: the fluxes are given in units of 10-15 erg cm-2 s-1
The H-Balmer lines show the results of 3 fitting processes,
using:
[1] one H-Balmer main component;
[2] one H-Balmer main component plus OFs; and
[3] Broad, intermediate, and narrow H-Balmer components, plus OFs.
All the H-Balmer broad components show a blueshift of 500 km s-1,
in relation to the corresponding H-Balmer intermediate components.
The Fe ii emission lines are at the same redshift of the H-Balmer
intermediate components (and also they show the same FWHM).
The errors/ in the fluxes and FWHM are less than 10.
The values between parentheses are data with low S/N.
| Lines | Compon | Fluxes | |||
|---|---|---|---|---|---|
| Area S1-A1 | Area S1-A2 | Area S2-A1 | Area S2-A2 | ||
| [0.0′′,-0.2′′] | [0.2′′,-0.1′′] | [0.0′′,-0.4′′] | [0.2′′,-0.3′′] | ||
| H | MC-EMI | 6.30 | 8.30 | 6.00 | 3.50 |
| OF-EB1 | 0.3 | 0.3 | 0.2 | 0.2 | |
| OF-EB2 | 0.2 | 0.3 | 0.2 | 0.1 | |
| [Oiii] | MC-EMI | 46.0 | 55.1 | 38.0 | 27.4 |
| [O i] | MC-EMI | 4.00 | 3.90 | 3.00 | 2.70 |
| H | MC-EMI | 18.3 | 25.0 | 17.1 | 15.0 |
| OF-EB1 | 0.8 | 0.9 | 0.7 | 0.5 | |
| OF-EB2 | 0.6 | 0.8 | 0.6 | 0.4 | |
| OF-EB3 | 0.5 | 0.6 | — | — | |
| [N ii] | MC-EMI | 6.00 | 11.0 | 7.00 | 7.00 |
| [S ii] | MC-EMI | 3.70 | 2.80 | 6.50 | 2.40 |
| [S ii] | MC-EMI | 6.00 | 3.20 | 3.50 | 3.50 |
| H/H | MC-EMI | 2.9 | 3.0 | 2.9 | 4.3 |
| FWHM H | MC-EMI | 390 | 380 | 370 | 360 |
| FWHM [O iii] | MC-EMI | 360 | 350 | 355 | 340 |
The fluxes are given in units of 10-16 erg cm-2 s-1.
Column 2: emission line components (see Section 5).
In particular,
MC-EMI means the Main Component of the emission line, and
OF-EB1 the outflow emission line of the blue component-1.
Line 3: the X and Y offset (from the QSO-core, as 0,0)
for each GMOS spectrum, in each knot (see Table 2).
The GMOS Y-axis was positioned at PA 131∘.
The FWHM are given in unit of Km/s.
The errors/ in the fluxes and FWHM are less than 10.
The values between parentheses are data with low S/N.
| Lines | Component | Fluxes | ||||
|---|---|---|---|---|---|---|
| Knot S3-K1 | Knot S3-K2 | Knot S3-K3 | Knot S3-K4 | Knot S3-K5 | ||
| [-0.2′′,1.4′′] | [ 0.2′′,1.5′′] | [-0.2′′,1.7′′] | [-0.5′′,1.9′′] | [-0.5′′,1.7′′] | ||
| [Oii]3727 | MC-EMI | 3.70 | 5.00 | 4.60 | 1.00 | 1.60 |
| OF-EB | — | 0.60 | 2.00 | 0.40 | — | |
| H3771 | MC-EMI | 0.14 | 0.10 | 0.30 | 0.08 | 0.08 |
| H3798 | MC-EMI | 0.10 | 0.10 | 0.10 | 0.07 | 0.08 |
| H3835 | MC-EMI | 0.20 | 0.20 | 0.20 | 0.09 | 0.15 |
| H83889 | MC-EMI | 0.30 | 0.10 | 0.05 | 0.08 | 0.10 |
| H3970 | MC-EMI | 0.10 | 0.20 | 0.10 | 0.05 | 0.10 |
| H4102 | MC-EMI | — | — | weak | 0.10 | 0.20 |
| H4340 | MC-EMI | — | — | — | weak | — |
| H4861 | MC-EMI | 1.10 | 1.30 | 1.20 | 0.28 | 0.75 |
| OF-EB1 | 0.40 | 0.60 | 0.50 | 0.10 | 0.40 | |
| OF-EB2 | 0.50 | — | 0.60 | 0.10 | 0.40 | |
| [Oiii]5007 | MC-EMI | 1.11 | 1.40 | 1.17 | 0.60 | 0.65 |
| OF-EB1 | 0.20 | 0.30 | 0.20 | 0.10 | — | |
| OF-EB2 | 0.20 | — | — | — | — | |
| [O i]6300 | MC-EMI | 0.24 | 0.35 | 0.28 | 0.35 | 0.50 |
| OF-EB1 | — | 0.30 | — | — | — | |
| H | MC-EMI | 2.80 | 5.50 | 3.60 | 1.33 | 2.20 |
| [N ii]6583 | MC-EMI | 1.40 | 2.40 | 1.80 | 0.56 | 0.90 |
| [S ii]6717 | MC-EMI | 0.35 | 1.30 | 0.60 | 0.40 | 0.50 |
| [S ii]6731 | MC-EMI | 0.24 | 1.10 | 0.70 | 0.40 | 0.50 |
| H/H | MC-EMI | 2.7 | 3.9 | 3.0 | 4.6 | (3.2) |
| FWHM H | MC-EMI | 400 | 380 | 405 | 390 | 380 |
| FWHM [O iii]5007 | MC-EMI | 380 | 375 | 395 | 380 | 385 |
| FWHM [O ii]3727 | MC-EMI | 295 | 290 | 300 | 270 | 260 |
The fluxes are given in units of 10-16 erg cm-2 s-1.
Column 2: emission line components (see Section 5).
In particular,
MC-EMI means the Main Component of the emission line, and
OF-EB1 the outflow emission line of the blue component-1.
Line 3: the X and Y offset (from the QSO-core, as 0,0)
for each GMOS spectrum, in each knot (see Table 2).
The GMOS Y-axis was aligned at the position angle PA 131∘.
The FWHM are given in unit of Km/s.
The errors/ in the fluxes and FWHM are less than 15.
The values between parentheses are data with low S/N.
| Lines | Component | EqW [Å] | ||||
|---|---|---|---|---|---|---|
| Knot S3-K1 | Knot S3-K2 | Knot S3-K3 | Knot S3-K4 | Knot S3-K5 | ||
| [-0.2′′,1.4′′] | [ 0.2′′,1.5′′] | [-0.2′′,1.7′′] | [-0.5′′,1.9′′] | [-0.5′′,1.7′′] | ||
| H3771 | MC-ABS | 3.8 | 5.8 | 5.7 | 4.0 | 6.0 |
| H3798 | MC-ABS | 8.7 | 8.5 | 12.0 | 11.8 | 8.8 |
| H3835 | MC-ABS | 8.5 | 15.5 | 11.3 | 10.8 | 10.2 |
| H8+He I3889 | MC-ABS | 10.2 | 13.0 | 7.8 | 12.8 | 11.0 |
| Ca II-H3933 | MC-ABS | 4.8 | 4.5 | 5.1 | 7.1 | 6.0 |
| H3970+Ca iiK | MC-ABS | 9.3 | 10.5 | 9.1 | 13.7 | 11.5 |
| H4102 | MC-ABS | 6.5 | 3.5 | 5.8 | 11.2 | 10.0 |
| H4340 | MC-ABS | — | — | — | 7.0 | 8.0 |
| H4861 | MC-ABS | — | — | — | 5.0 | 4.0 |
| FWH-Min. H3970 | MC-EMI | 495 | 485 | 460 | 570 | 590 |
The Equivalent Widths (EqW) are given in units Å
Column 2: absorption components (see Section 5).
In particular,
MC-ABS means the Main Component of the absorption line.
Line 3: the X and Y offset (from the QSO-core, as 0,0)
for each GMOS spectrum, in each knot (see Table 2).
The GMOS Y-axis was aligned at the position angle PA 131∘.
The FWHM are given in unit of Km/s.
The errors/ in the EqW are less than 13.
| Lines | Compon | Fluxes | ||||
|---|---|---|---|---|---|---|
| Region R1 | Region R2a | Region R2b | Region R3 | Region R4 | ||
| [-1.6′′,0.0′′] | [ 0.2′′,-0.9′′] | [0.2′′,-1.1′′] | [ 0.2′′,3.1′′] | [-0.7′′, 0.8′′] | ||
| [Oii] | MC-EMI | 1.50 | 3.00 | 2.10 | — | 2.00 |
| OF-EB1 | 0.60 | — | 0.70 | — | 0.30 | |
| H | MC-EMI | — | 0.60 | — | — | 0.65 |
| H | MC-EMI | 0.50 | 1.30 | 0.45 | (0.23) | 2.00 |
| OF-EB1 | 0.40 | — | — | — | 0.40 | |
| OF-EB2 | 0.20 | — | — | — | 0.50 | |
| [Oiii] | MC-EMI | 0.50 | 2.50 | 0.35 | (0.24) | 1.82 |
| OF-EB1 | 0.30 | — | — | — | 0.20 | |
| OF-EB2 | 0.20 | — | — | — | — | |
| [O i] | MC-EMI | 0.15 | 1.40 | 0.75 | 0.14 | 0.40 |
| H | MC-EMI | 1.00 | 3.70 | 1.75 | 0.60 | 5.90 |
| [N ii] | MC-EMI | 0.35 | 3.58 | 4.17 | 0.68 | 2.20 |
| [S ii] | MC-EMI | 0.30 | 1.68 | 1.95 | 0.45 | 0.70 |
| [S ii] | MC-EMI | 0.30 | 1.00 | 1.00 | 0.26 | 0.70 |
| H/H | MC-EMI | (2.0) | 3.0 | 3.8 | 2.8 | 3.3 |
| FWHM H | MC-EMI | 400 | 380 | 440 | 460 | 420 |
| FWHM [O iii]5007 | MC-EMI | 360 | 340 | 370 | 380 | 395 |
| FWHM [O ii]3727 | MC-EMI | 280 | 250 | 260 | — | 265 |
The fluxes are given in units of 10-16 erg cm-2 s-1
(from GMOS/IFU R831, B600 and R400 spectroscopy).
Column 2: emission line components (see Section 5).
Line 3: the X and Y offset (from the QSO-core, as 0,0)
for each GMOS spectrum, in each knot (see Table 2).
The GMOS Y-axis was positioned at PA 131∘.
The FWHM are given in unit of Km/s.
The errors/ in the fluxes and FWHM are less than 15.
The values between parentheses are data with low S/N.
| Knots/Regions | Compon | log[Oiii]/H | log[Oi]/H | log[Nii]/H | log[Siis]/H | Spectral Type |
|---|---|---|---|---|---|---|
| QSO | ||||||
| QSO-Core (02) | MC-EMI | -0.36 | — | — | — | — |
| Shell S1 | ||||||
| Area S1-A1 | MC-EMI | 0.86 | -0.66 | -0.48 | -0.26 | SHOCKS + AGN |
| Area S1-A2 | MC-EMI | 0.87 | -0.77 | -0.36 | -0.62 | SHOCKS + AGN + H ii |
| Shell S2 | ||||||
| Area S2-A1 | MC-EMI | 0.89 | -0.76 | -0.39 | -0.23 | SHOCKS + AGN |
| Area S2-A2 | MC-EMI | 0.89 | -0.75 | -0.33 | -0.40 | SHOCKS + AGN |
| Shell S3 | ||||||
| Knot S3-K1 | MC-EMI | 0.00 | -1.07 | -0.30 | -0.68 | LINER + H ii |
| Knot S3-K2 | MC-EMI | 0.07 | -1.20 | -0.36 | -0.36 | LINER + H ii |
| Knot S3-K3 | MC-EMI | -0.01 | -1.08 | -0.30 | -0.51 | LINER + H ii |
| Knot S3-K4 | MC-EMI | 0.08 | -0.58 | -0.38 | -0.22 | LINER |
| Knot S3-K5 | MC-EMI | -0.04 | -0.60 | -0.37 | -0.32 | LINER |
| Regions | ||||||
| Region R1 | MC-EMI | 0.00 | -0.82 | -0.45 | -0.22 | LINER |
| Region R2a | MC-EMI | 0.19 | -0.42 | 0.00 | -0.15 | LINER |
| Region R2b | MC-EMI | -0.11 | -0.37 | 0.38 | 0.23 | LINER |
| Region R3 | MC-EMI | -0.02 | -0.59 | 0.09 | 0.11 | LINER |
| Region R4 | MC-EMI | -0.04 | -1.20 | -0.43 | -0.62 | LINER + H ii |
The wavelengths of the main used lines are [O iii];
[O i]; [N ii];
[S iis]6716+6731.
Column 2: emission line components (Compon),
as in Table 3.
Column 7: spectral type, using mainly the diagrams
log log [S ii]/H vs log [O i]/H,
log log [O iii]/H vs log [S ii]/H,
log log [O iii]/H vs log [O i]/H
(from Heckman et al. 1990: Figure 14; Lípari et al. 2004d).
The errors/ in the emission lines ratios are less than 15.
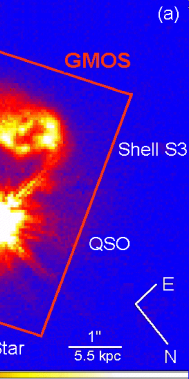 |
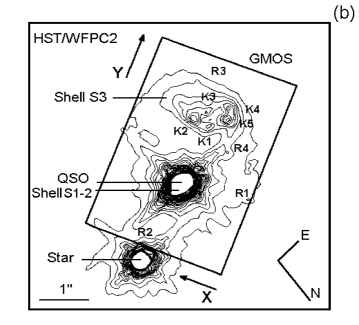 |
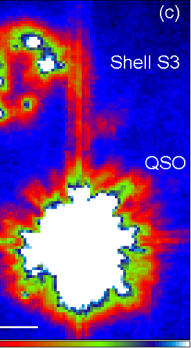 |
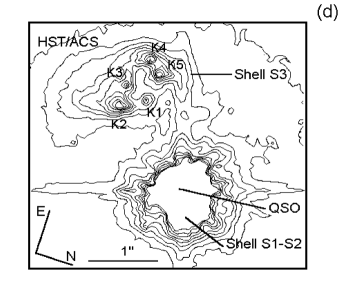 |
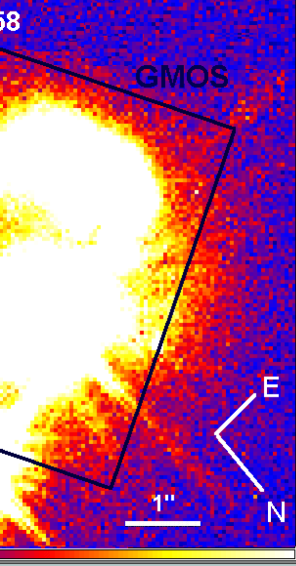 |
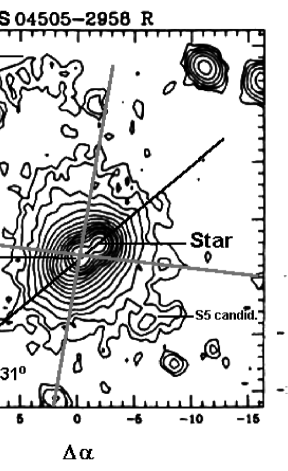 |
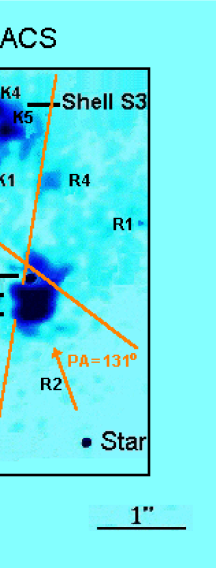 |
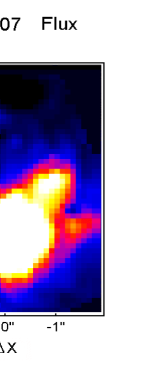 |
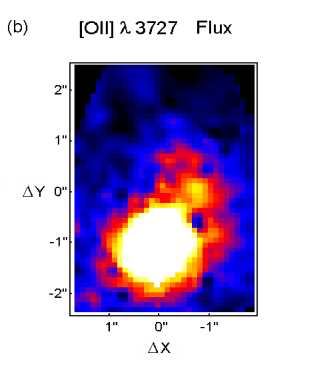 |
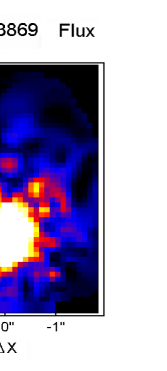 |
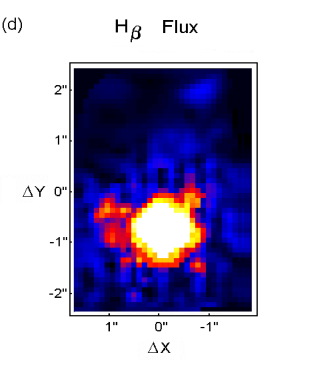 |
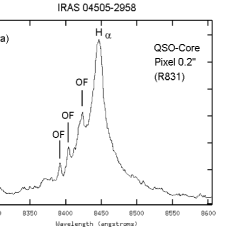 |
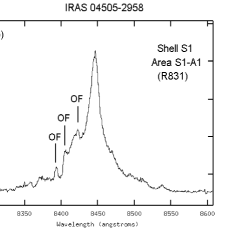 |
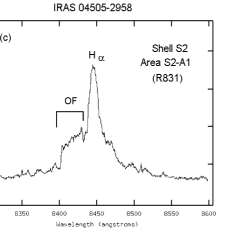 |
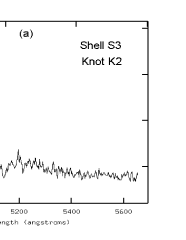 |
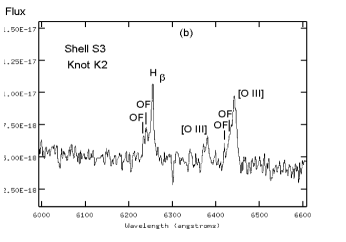 |
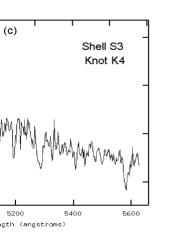 |
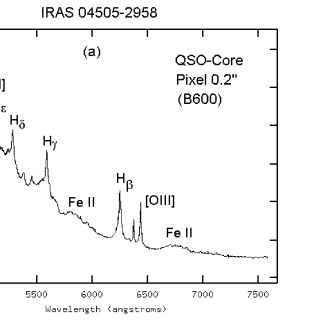 |
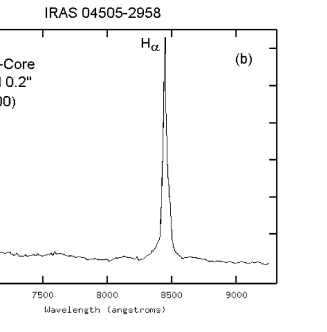 |
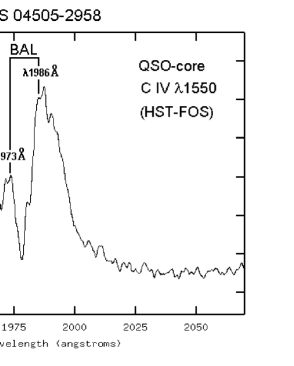 |
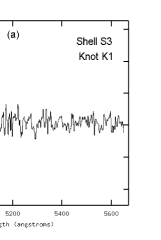 |
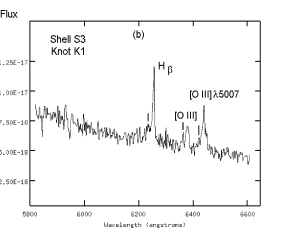 |
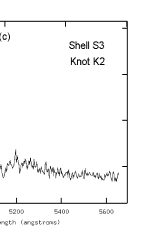 |
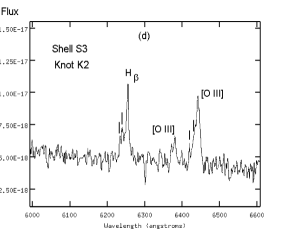 |
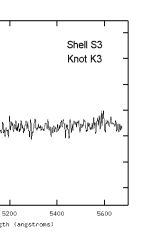 |
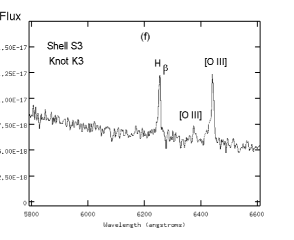 |
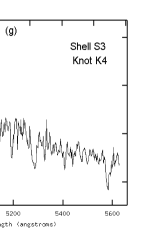 |
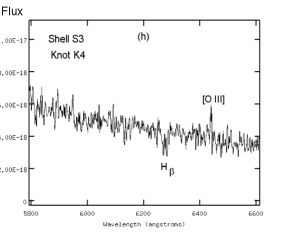 |
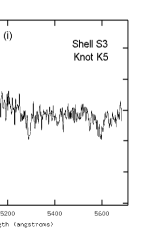 |
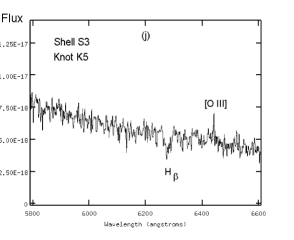 |
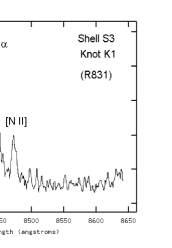 |
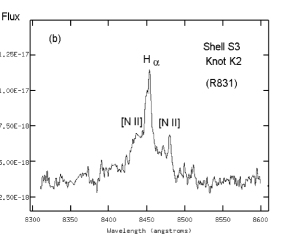 |
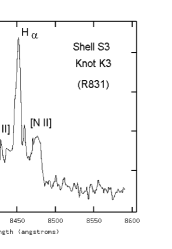 |
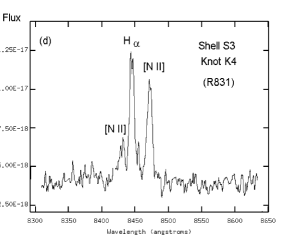 |
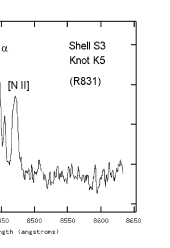 |
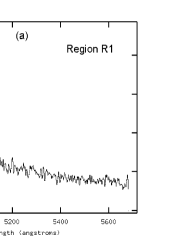 |
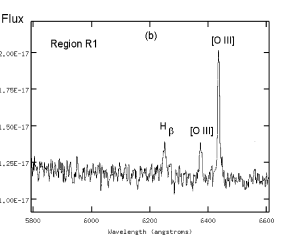 |
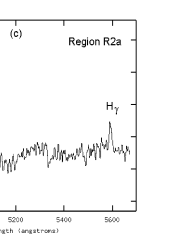 |
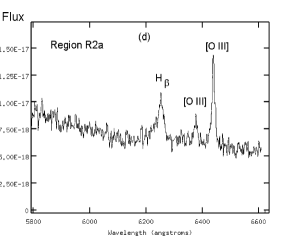 |
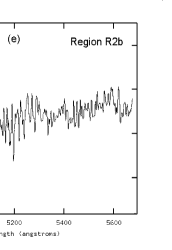 |
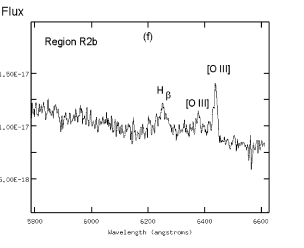 |
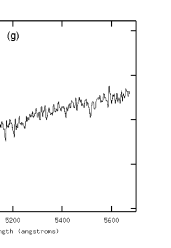 |
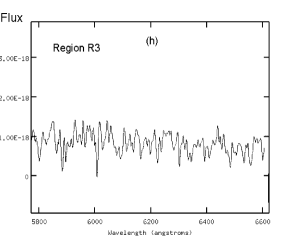 |
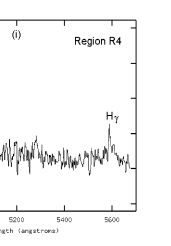 |
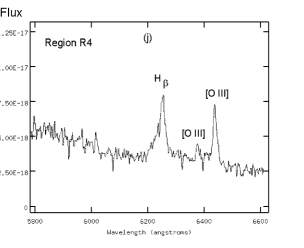 |
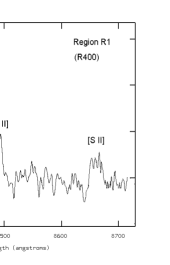 |
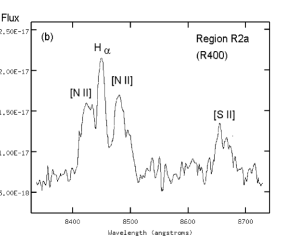 |
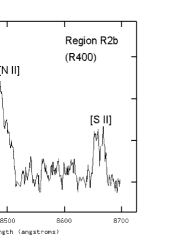 |
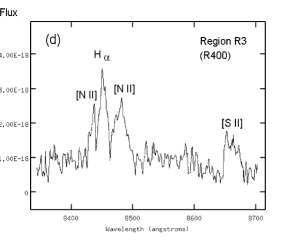 |
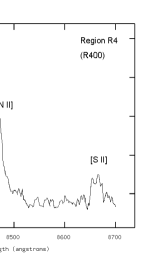 |
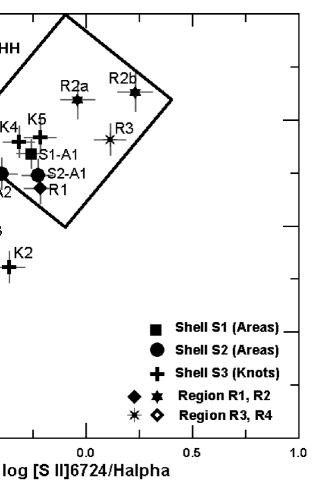 |
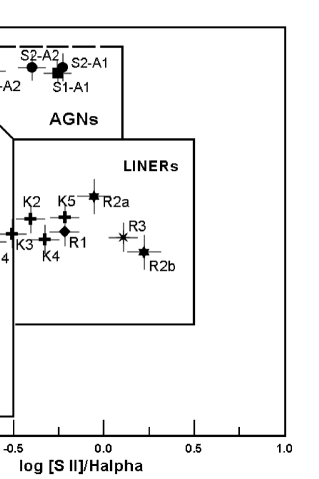 |
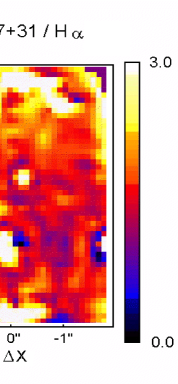 |
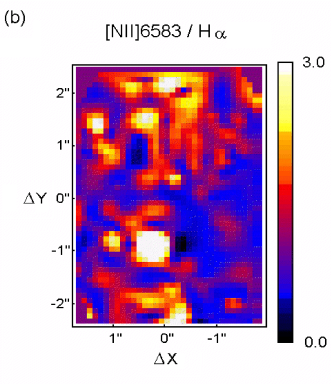 |
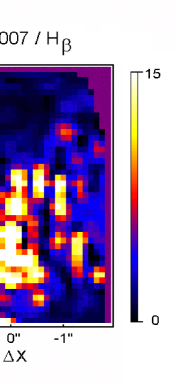 |
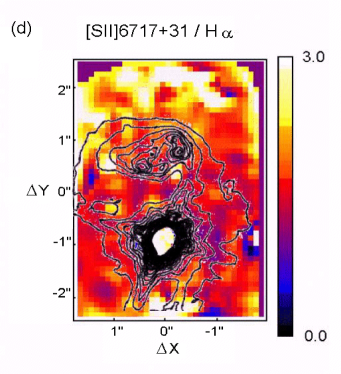 |
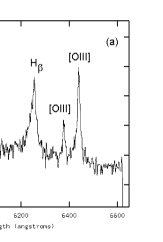 |
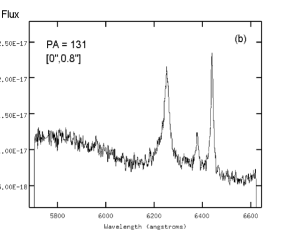 |
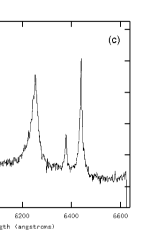 |
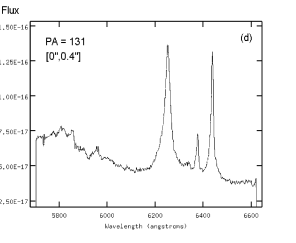 |
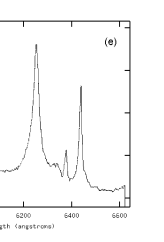 |
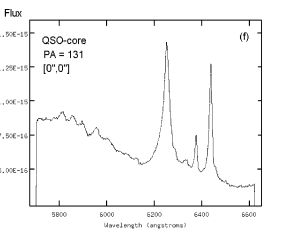 |
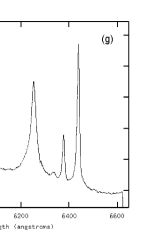 |
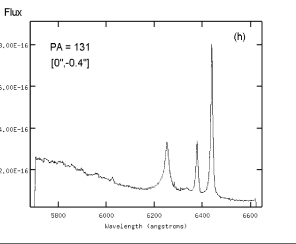 |
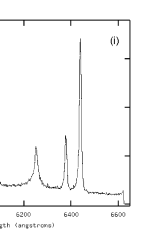 |
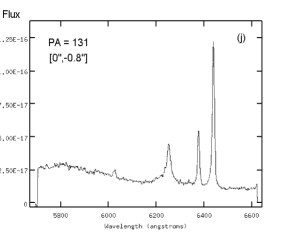 |
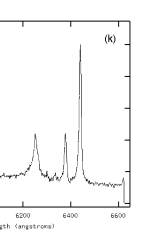 |
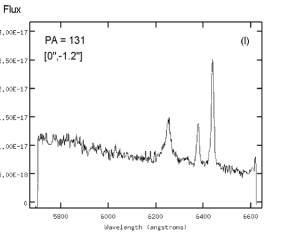 |
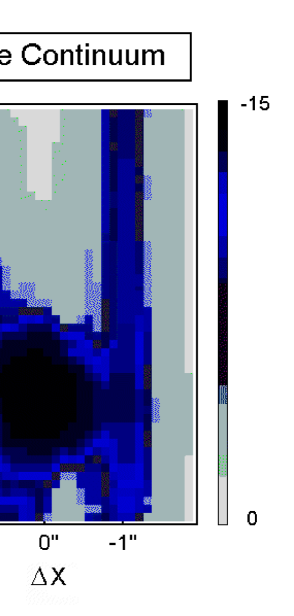 |
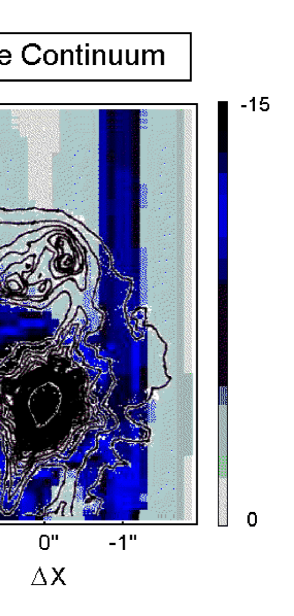 |
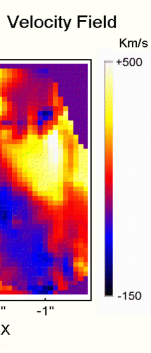 |
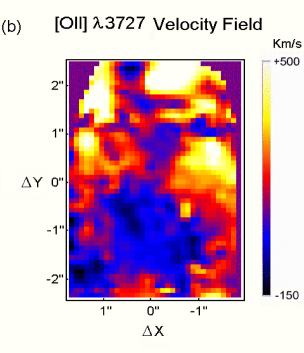 |
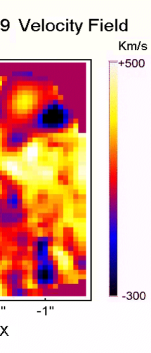 |
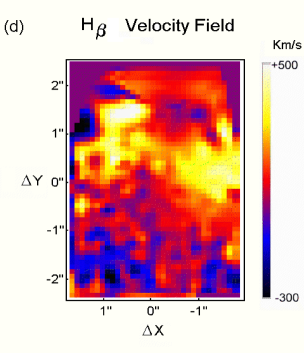 |
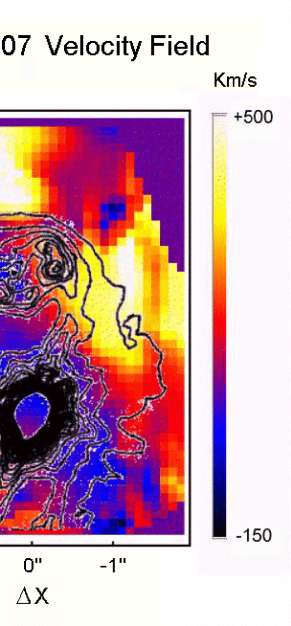 |
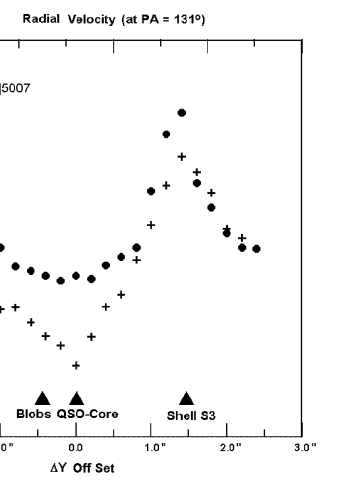 |
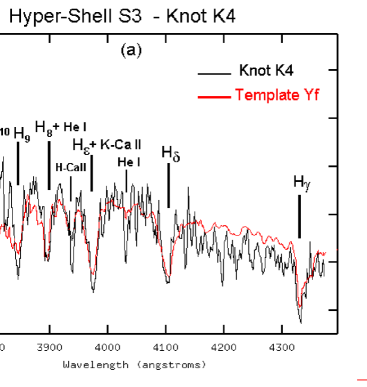 |
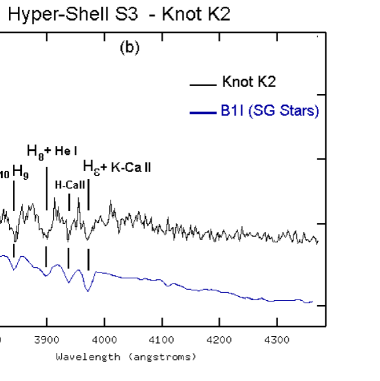 |
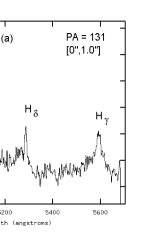 |
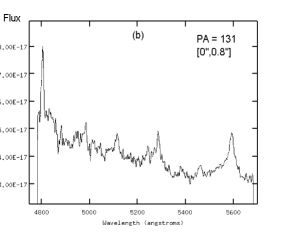 |
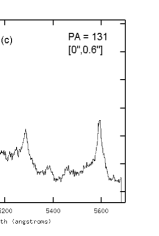 |
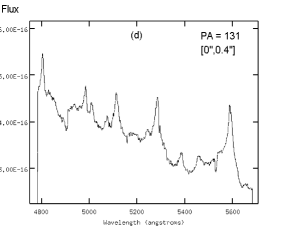 |
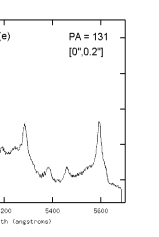 |
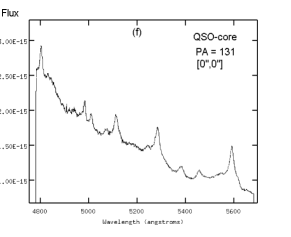 |
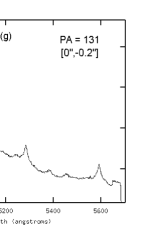 |
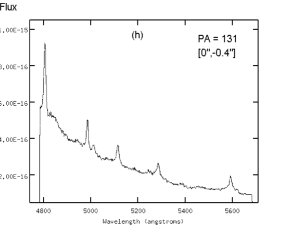 |
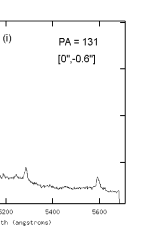 |
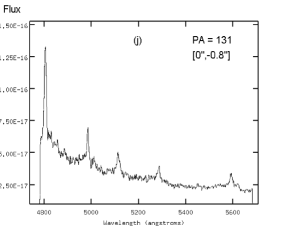 |
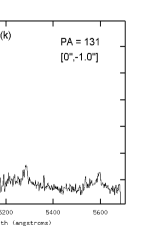 |
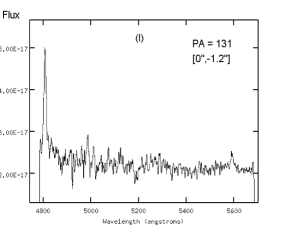 |
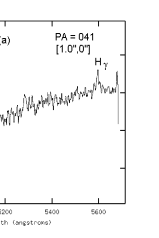 |
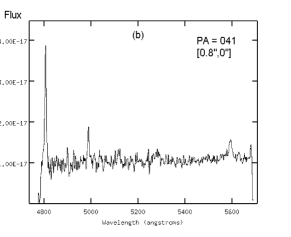 |
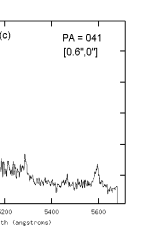 |
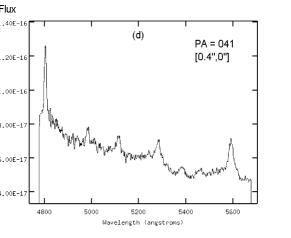 |
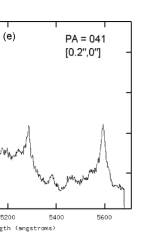 |
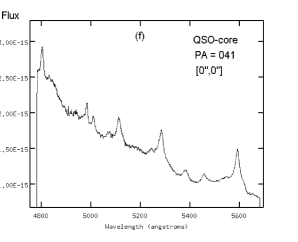 |
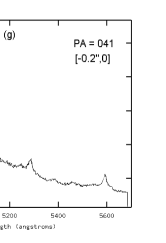 |
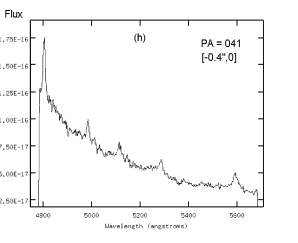 |
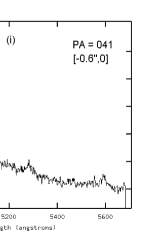 |
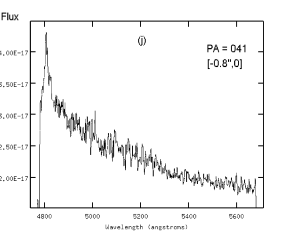 |
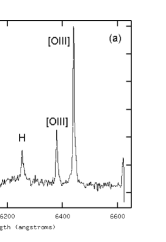 |
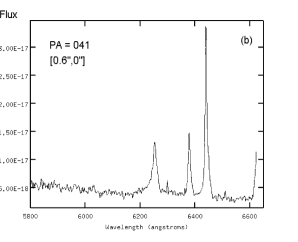 |
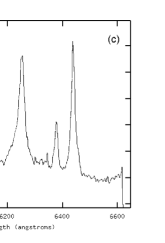 |
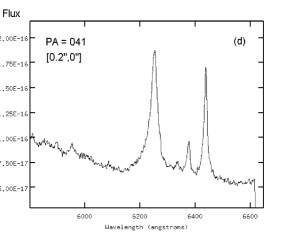 |
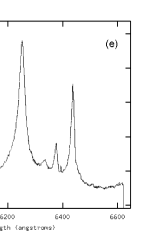 |
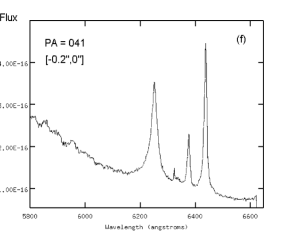 |
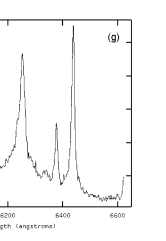 |
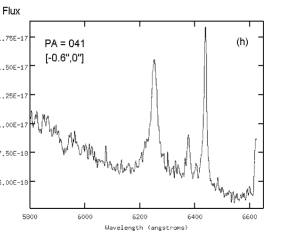 |
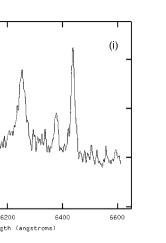 |
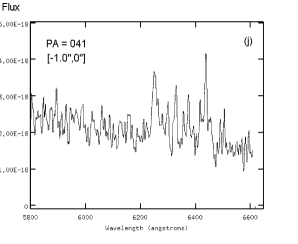 |
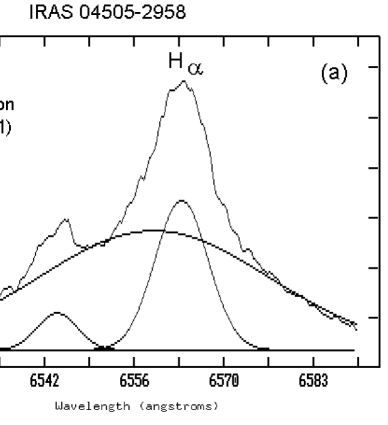 |
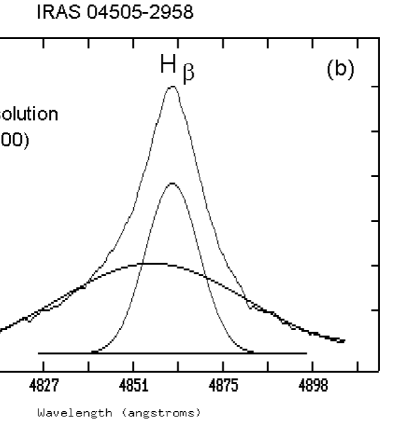 |
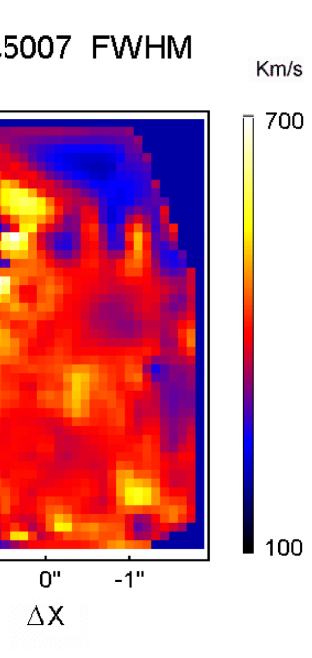 |
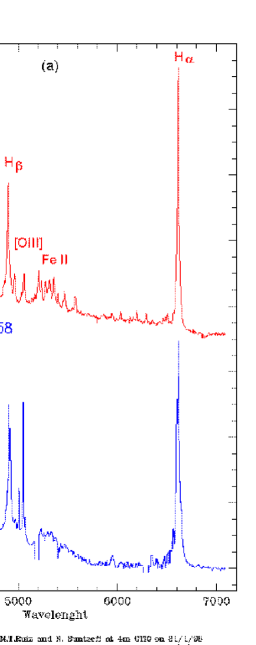 |
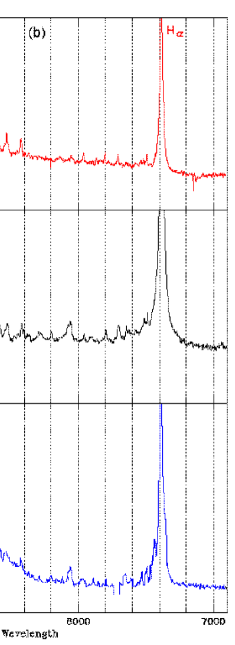 |