Simulating STM transport in alkanes from first principles
Abstract
Simulations of scanning tunneling microscopy measurements for molecules on surfaces are traditionally based on a perturbative approach, most typically employing the Tersoff-Hamann method. This assumes that the STM tip is far from the sample so that the two do not interact with each other. However, when the tip gets close to the molecule to perform measurements, the electrostatic interplay between the tip and substrate may generate non-trivial potential distribution, charge transfer and forces, all of which may alter the electronic and physical structure of the molecule. These effects are investigated with the ab initio quantum transport code smeagol, combining non-equilibrium Green’s functions formalism with density functional theory. In particular, we investigate alkanethiol molecules terminated with either CH3 or CF3 end-groups on gold surfaces, for which recent experimental data are available. We discuss the effects connected to the interaction between the STM tip and the molecule, as well as the asymmetric charge transfer between the molecule and the electrodes.
I Introduction
Scanning tunnelling microscopy (STM) STM is an invaluable surface characterization tool with multiple applications in molecular electronics. Typically, an atomically sharp probing tip constructed from heavy metals such as platinum, tungsten or iridium scans a substrate by means of a tiny tunneling current. The method can be used as a topographic tool to map the positions of atoms, defects and molecules on surfaces, as a spectroscopic tool to probe their local density of states, and more recently in its spin-polarized version as an ultra sensitive magnetometer Wisen . Furthermore STM can also be used as an atomic fabrication tool for depositing atoms and molecules on a surface so as to form nanoscale devices coral . Additionally, it can be used to manufacture breaking junctions, where a molecule is pulled out of a surface, so that electronic transport measurements can be performed Tao1 ; Tao2 . Indeed, the level of geometric control provided by the STM even allows mechanical gating experiments to be carried out, so that a range of different transport regimes can be investigated for the same molecule ptcda1 ; ptcda2 . In general, both in its topographic and spectroscopical modes, an STM measurement consists of a collection of different - curves for different tip-to-sample positions.
In the vast majority of cases, calculations of STM currents are based on Bardeen’s perturbative approach to tunneling bar and consist of evaluating the tunneling matrix elements between the STM tip and the sample. A simplified form due to Tersoff and Hamann (TH) th which reduces to the calculation of the local density of states, is now mainstream and usually implemented in standard electronic structure codes. The TH scheme assumes that the STM tip is sufficiently far from the molecule so as not to affect its electronic structure. As a result of this assumption, there is no self-consistent evaluation of the potential drop nor of the charge re-distribution between the tip and the sample. These methods are thus not reliable when the tip is close to the molecule and deviation from the TH current are expected. It is therefore important to explore, for STM simulations, the use of self-consistent transport methods smeagol1 ; smeagol2 ; negf-dft such as the non-equilibrium Green’s function formalism (NEGF) negf combined with ab initio electronic structures obtained from density functional theory (DFT) dft ; ks . This is the goal of our work, which is based on the use of the electronic transport code smeagol smeagol1 ; smeagol2 .
It is important to realize that NEGF-DFT is completely complementary to the standard TH scheme. Indeed, it presents problems in the limit of large tip-to-sample separation, where TH is most effective. The main reason for this is rooted in the fact that smeagol employs the numerical implementation of DFT contained in the siesta code siesta . The siesta basis set is constructed from numerical orbitals whose radial component is truncated beyond a certain cutoff radius siestabasis , and extended vacuum regions are usually only poorly described. In fact in the extreme case of a vacuum region extending well beyond all the cutoff radii, all matrix elements between the tip and the sample will vanish and the tunneling current will become identically zero. Improvements can be obtained by populating the vacuum region with empty orbitals (basis functions not associated to a pseudopotential). However for sensitive calculations of tiny tunneling currents the actual position of the empty orbitals can deeply affect the results, most typically by creating spurious current oscillations as a function of the tip-to-sample distance. Therefore we limit our method to tip-to-sample separation smaller than 6Å for which reliable calculations do not need empty orbitals in the vacuum. We call this limit the quasi-contact limit.
An example of experiments where the tip-molecule interactions are believed to be important, is that performed by Pflaum et. al. dtf , in which a monolayer of alkanethiol molecules is deposited on a gold surface, and the transport properties are then probed by using an STM setup. The obtained zero-bias conductance is low, being of the order of at zero bias (the quantum conductance is defined as , with the electron charge and the Planck constant). The - curves are asymmetric and this asymmetry increases noticeably when the terminating CH3 group is replaced by a CF3 one. It is speculated that the additional asymmetry of the -terminated molecule is due to a rearrangement of the charge distribution near the end of the molecule caused by the high electronegativity of the F atoms. This in turn generates an electrostatic force between the STM tip and the molecule, the direction of which depends on the electrostatic potential at the tip. Such interaction causes the molecule to be either repelled or attracted by the tip depending on the bias polarity, and creates the asymmetry in the -.
Calculations using the TH method have been performed for pentanethiol molecules on gold selloni . However, the nature of the TH method requires a large tip-molecule separation, and the current obtained in these calculations is an order of magnitude smaller than that observed in the experiments. In this work, the mechanism behind the asymmetry in the - curves of CH3 and CF3 terminated alkanethiol molecules on gold is explored with NEGF-DFT. The issue related to the electrostatic interaction between the tip and the sample is investigated in an approximate way. First we calculate from equilibrium DFT the electrical dipole on the molecules. Then we use classical electrostatic theory to determine the equilibrium position of the molecule with respect to the tip. Finally new transport calculations are carried out for the newly estimated atomic positions.
II Method: DFT-based Non-Equilibrium Green’s Function Formalism
STM transport measurements are equivalent to calculating the two-probe - curve of a molecule sandwiched in between two metallic electrodes. One electrode represents the surface to which the molecule is attached and the other is the STM tip. The NEGF scheme partitions such system into three regions, respectively the two current/voltage electrodes (leads) and a middle region called the scattering region (SR) (see figure 2).

The SR includes both the molecule and a portion of the leads, and it is extended enough so that charge density calculated at the most external atomic layer resembles that of the bulk electrodes. The leads, which are assumed to be periodic crystals in the transport direction, are kept at different chemical potentials where is the applied potential bias. We note this is somewhat different from STM experiments, where typically the chemical potential of the surface remains fixed while a potential bias is applied to the probe. However, such a difference in the definition does not effect the shape of the - curve, since the final potential drop is calculated self-consistently. The SR is described by a Hamiltonian . This is used to construct the non-equilibrium Green’s function
| (1) |
where are the self-energies for the leads, constructed by semi-analytical derivation Ivan from the electronic structure of the bulk. enters in a self-consistent procedure to calculate the density matrix, , of the SR, and hence the two-probe current of the device negf ; smeagol1 ; smeagol2 ; negf-dft ; negftb . The Hamiltonian for the scattering region is generally assumed to be a function of the non-equilibrium charge density , which is calculated following the NEGF prescription as
| (2) |
where . In practice, this integral is performed by splitting it into two partsnegf ; smeagol1 ; smeagol2 ; negf-dft ; negftb : an equilibrium part to be performed along a contour in the complex plane, and a non-equilibrium part to be evaluated along the real energy axis but that contributes only around . Finally, the converged Green’s function can be used to calculate the two-probe current through the device
| (3) |
This is effectively the integral between and (the bias window) of the transmission coefficients .
The NEGF scheme is general and not related to a particular electronic structure theory. In the case of smeagol smeagol1 ; smeagol2 , the electronic structure method used is density functional theory (DFT) dft in the siesta implementation. In particular in this work we will use the local density approximation ks (LDA) of the exchange and correlation functional.
III Results
III.1 Electronic Structure of the Molecules
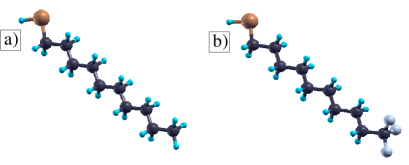
The molecules used in the experiments of Pflaum et. al. are both methyl-terminated and fluorine-terminated alkanethiols. A range of different alkane chain lengths were used in that study, but most of the data were collected for decanethiols (see figure 1(a) and 1(b)). Decanethiol consists of an alkane chain of ten carbon atoms terminated with thiol (-SH) group. The sulphur atom in the thiol group forms a strong bond with gold and anchors the molecule to the surface forming a well ordered self-assembled monolayer.
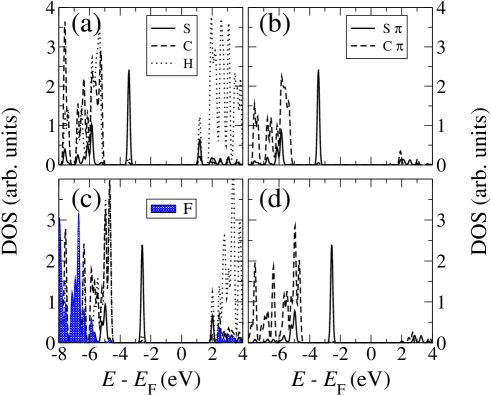
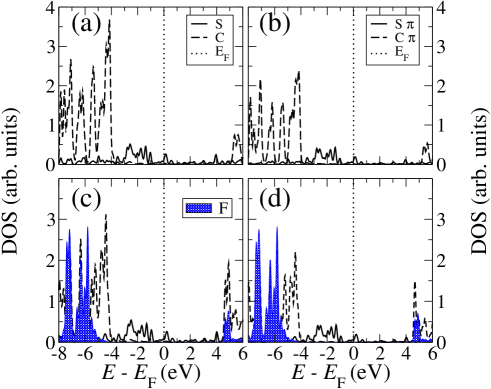
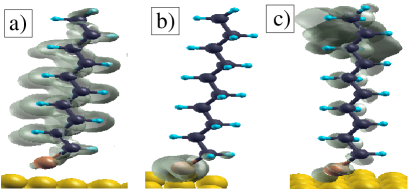
The orbital resolved density of states (DOS) for isolated decanethiol both - and CF3-terminated is shown in figure 3. The energy gap between the highest occupied molecular orbital (HOMO) and the lowest unoccupied molecular orbital (LUMO) is in both cases rather large ( 5 eV ) note1 . Most importantly the DOS of the two frontier molecular orbitals do not have large amplitude over the C atoms forming the decanethiol, but are rather localized on the states of S perpendicular to the molecule axis (see figures 3(b) and 3(d)). In the case of CF3-termination the F contribution to the DOS is only confined to part of the LUMO and to low energy HOMO levels. The orbital nature of the HOMO and LUMO is further investigated in figure 4 where we present the local DOS for the CH3-terminated molecule (the one for the CF3-terminated case is rather similar and it is not presented here).
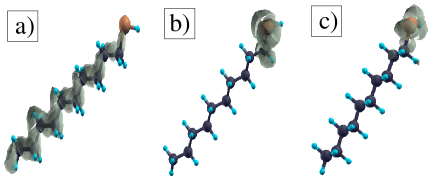
We note that both HOMO and LUMO have amplitude mainly around the thiol group with little charge spread over the alkane chain. One should therefore expect little conductance through those states. In contrast the first state below the HOMO (HOMO-1) (figure 4(a)) appears as a delocalized state and it is expected to conduct efficiently.
III.2 Transport Properties of the Molecules on Gold Surface
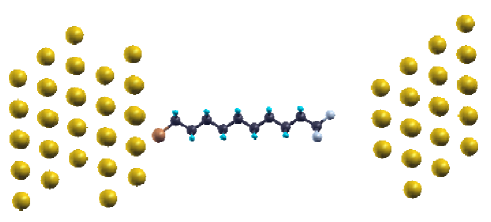
In order to calculate the transport properties, we attach the molecules to the Au fcc (111) hollow site via a terminating thiol group at a sulphur-surface distance of 1.9 ÅAuSdistDef . This is the equilibrium distance measured for the hollow site configuration AuSdist . The arrangement of the molecule on the surface and the relative position of the tip is shown in figure 5 for the -terminated molecule. The configuration for the -terminated case is similar and it is not displayed here. In the experiments from Pflaum et. al. -terminated decanethiols are tilted at an angle of from the vertical direction, while for -terminated the tilting angle is dtf . Our simulation cells however have the molecules placed perpendicular to the surface. This allows the unit cell used to be smaller than that required for simulating such tilting angles, and the computational overheads are greatly reduced. We also make some approximations in modeling the STM tip. First of all we consider a gold tip instead of the used tungsten or platinum-iridium ones, in such a way to avoid issues related to having two electrodes with different work functions. In doing this we describe the electronic structure of the electrodes with a only basis set, which was proved to provide a reasonably accurate choice for transport calculations at only a moderate computational cost bdtsic . Secondly we do not consider an atomically sharp tip but a slightly blunter one. This geometry improves the stability of the calculations, allowing the self-consistent convergence to be quicker and more reliable.
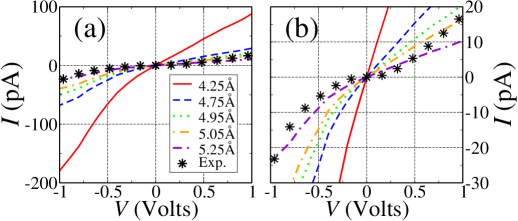
As expected the tunneling current is extremely sensitive to the distance between the tip and the molecule, so that it is rather difficult to determine from experiments the precise tip vertical position. Our working strategy is then to adjust this distance to match the magnitude of the current obtained in experiments. Such a a tuning exercise is presented in figure 6 where we show the - curves for different tip-to-molecule separations, where these are defined as the distance between the terminating surface of the tip and the C atom in the CH3 group. From the figure one can deduce that the best match is obtained for a distance of 5.25Å. The results presented in the rest of this section are obtained for this tip-to-molecule separation.
The orbital resolved DOS for both - and -terminated decanethiol on Au are shown in figure 7. In general and for both the molecule the HOMO is relatively close to the gold .
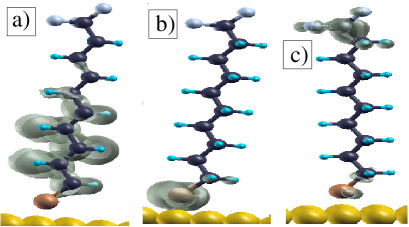
However, a closer look at its local DOS (this is calculated as the local DOS over an energy window corresponding to the HOMO level) depicted in figures 8 and 9, reveals that such a state is mainly localized around the S atoms of the thiol groups. The delocalized -orbitals capable of efficient charge transport across the molecule are further away from the Fermi level (approximately 4 eV for both molecules). It is also interesting to observe the effects that the different terminating groups (CH3 and CF3) have over the electronic structure of the HOMO-1 level. The most notable difference is associated to the charge density distribution along the CH2 groups forming the decanethiol. While in the case of CH3 termination the electron charge distributes almost uniformly over CH2 up to near the terminating CH3 group, in the case of CF3-terminated molecule there is a strong modulation with a decay of the charge density as the CF3 group is approached. This is due to the Coulomb repulsion from the more electronegative CF3 group. Such an electrostatic driven charge decay is reminiscent of the same effect investigated by STM for molecules on surfaces in the presence of point charges Wolcok .
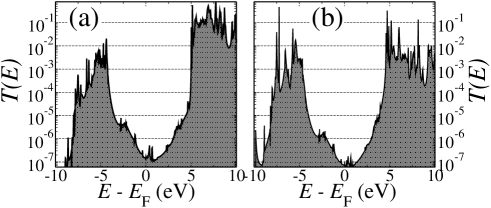
Despite these differences the absence of any extended molecular orbital near the Fermi level of gold is common to both molecules and therefore we expect just a tiny tunnel current at low bias. This can be appreciated by looking at both the transmission coefficients, (figure 10) and the - curves (figure 11). There is a large gap in the resonances in the zero bias transmission coefficients of about 5 eV on each side of the Fermi level with the edges of such a gap corresponding to the HOMO-1 and the LUMO, respectively below and above the Au Fermi energy. The transmission of the HOMO provides only a small shoulder in () at about 2.5 eV below , confirming that the HOMO does not provide an efficient transport channel at resonance. However, since the HOMO is the first molecular level to enter the bias window (at least for one of the two current polarities), it is expected to dominate the low-bias region of the -.
Moving our attention to the - curves and the differential conductances shown in figure 11, the most noticeable feature is their asymmetry. In particular conductance at positive bias is about between 2 to 3 times smaller than that for negative bias. Moreover we observe that the conductance of CH3-terminated molecules is both larger and more asymmetric of that for CF3-terminated.
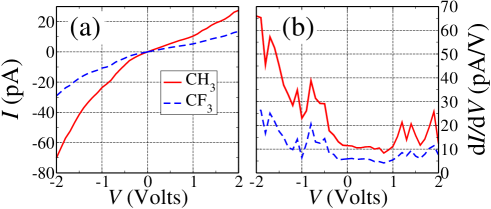
The reason for the conductance asymmetry is rooted in the different electronic coupling strength between the molecule and the gold surface as compared to the much weaker one between the molecule and the STM tip. The S atom in fact forms quite a strong bond with the gold surface, whereas the tip is separated by a vacuum region which provides a substantial potential barrier. Such difference in coupling persists to rather close tip-to-molecule separations since both the CH3 and CF3 endgroups do not bind to the Au tip. The mechanism leading to the asymmetry is then illustrated in the cartoon of figure 12(a). Since the different coupling strengths of the two electrodes with the molecule, electrons are easily transferred from the substrate to the molecule, but they can hardly hop to the tip. This means that the occupation of the molecule is determined by the chemical potential of the substrate and that the molecule gains electronic charges when the electron flux is from the surface to the tip (negative bias according to our definition). In contrast the molecules lose charge when the flux is in the other direction (positive bias). Since charging produces a shift of the molecular electronic states towards higher energies one expects the HOMO to move into the bias window at negative voltages and away from it at positive ones. The same behaviour is expected for the HOMO-1, while the LUMO follows exactly the opposite pattern (it moves into the bias window for positive bias and away from it for negative) NoteBias .

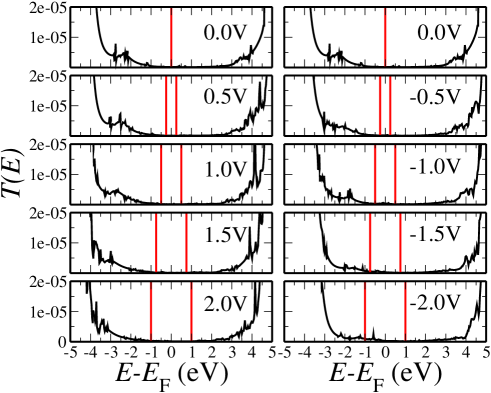
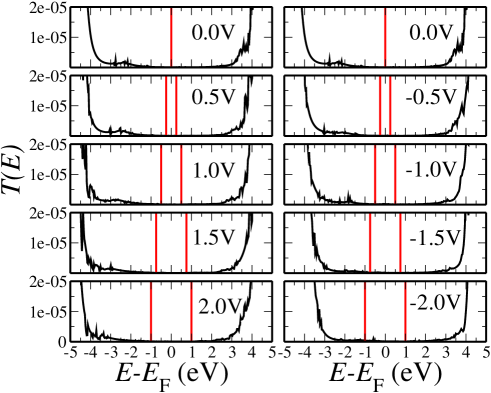
The electrostatic evolution of the system under bias is illustrated in figures 13 and 14 where we show the transmission coefficients as a function of energy for different voltages. Clearly the behaviour is the one expected by our simple electrostatic model with an upshift (downshift) in energy of the molecular levels at negative (positive) bias. Since the highly conducting HOMO-1 and LUMO levels never enters the bias window in this voltage range (limited to 2 Volt), the onset of the current is solely determined by the position of the HOMO. This however can enter the bias window only for negative bias explaining the current asymmetry. Furthermore, since the transmission of the HOMO for CH3-terminated decanethiol is larger than that of the CF3-terminated case, the conductance of CH3-decanethiol is both larger and more asymmetric than that of its CF3 terminated counterpart.
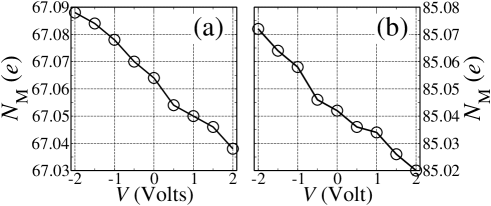
Finally, in figure 15 we present the total Mülliken population, , of the molecule as a function of voltage. The figure provides quantitative evidence for the charging of the molecule as a function of bias and one can observe a total charge variation of about 0.05 over the entire bias range of 4 Volt. Interestingly, and despite the different terminating groups, the charge variation with bias is essentially identical for the two terminations.
III.3 Influence of the tip-to-molecule electrostatic interaction over the transport
As concluded in the previous section, the asymmetry of the conductance with respect to the bias direction found in our calculations is due to the asymmetry in the electronic coupling of the molecule to the leads. Interestingly a strong asymmetry was also observed in the experimental conductance measurements for the same molecules dtf . However, in the experiments, -terminated molecules displayed a far more pronounced asymmetry than the -terminated ones. This is in contrast with our findings where the asymmetry is similar, and in fact it is more pronounced for the -terminated case. In agreement with the initial suggestion from Pflaum et al., here we argue that this additional asymmetry is not of electronic origin but rather is connected to the electrostatic interaction between the tip and the molecule under bias. This re-positions the molecule with respect to the tip, effectively changing the tunneling current.
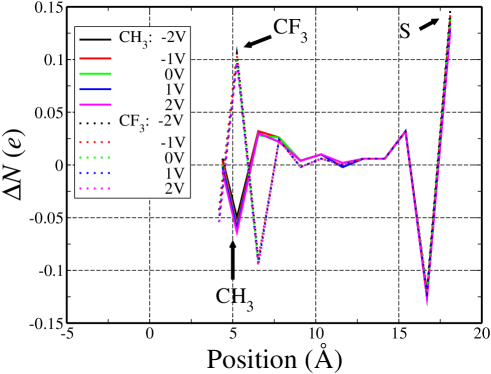
The main idea is illustrated schematically in figure 12(b). The large electronegativity of the F atoms in the CF3 group is expected to displace a substantial net charge towards the end of the molecule. This then interacts electrostatically with the surface charge of the STM tip, either repelling or attracting the molecule depending on the bias polarity. Such a charge displacement is illustrated in in figure 16 where we show the charge excess with respect to neutrality, , as calculated from the Mülliken population as a function of the position along the molecule axis. In our notation () indicates a negatively (positively) charged portion of the molecule. Substituting H by F atoms causes an increase in the occupation of the endmost carbon atom, although the F atoms show a net positive charge. Overall the total net charge on the group is negative (it posses extra electrons), whereas the total net charge on the group is positive. In addition the two end groups produce an electrical dipole with opposite sign and different magnitude, with that associated to CF3 being the largest. Finally it is important to observe that by large the charge distribution over the molecule is not affected by the external electric field so that is almost bias independent for both the terminations.
We estimate the forces acting on the molecule by using simple classical electrostatic theory. In the case of CH3-terminated decanethiol we calculate a force of eV Å-1 in the direction of the tip at the positive bias of 2 Volt, and eV Å-1 in the direction of the substrate at the negative bias of 2 Volt. These have to be put in relation with the elastic forces needed to stretch the molecule. DFT calculations performed using siesta demonstrate that the tip-to-molecule electrostatic force at positive bias causes the molecule to stretch by about 0.002 Å, while at negative bias the compression is of the order of 0.001 Å (at Volt). Similarly, the force acting on the group is calculated to be of the order of eV Å-1 in the direction of the substrate when a positive bias of 2 Volt is applied, and of the order of eV Å-1 in the direction of the tip at a negative bias of 2 Volt. These forces are in the opposite direction to those on the termination due to the opposite directions of the two dipoles. Again DFT calculations for -decanethiol indicate that the force at positive bias causes the molecule to compress by about 0.001 Å, and the force at negative bias to stretch by 0.002 Å. These length changes are of the same magnitude for both types of endgroup, but they occur at opposite bias directions due to the opposite direction of the electrostatic force in the two cases.
The stretching (or compressing) of the molecule under bias alters the tip-to-molecule separation, which in turn affects the magnitude of the current. Let us look at the CH3 case first. At positive bias the molecule is stretched so that its end is closer to the STM tip, the tip-to-molecule separation is reduced and the current will increase. In contrast at negative bias, the molecule is compressed and a reduction of the current is expected. Since the current obtained from our calculations at negative bias is larger than that for positive bias, such a change in molecule length would contribute to reducing the - asymmetry in agreement with the experimental results. However, a quantitative estimate of the changes in the - curve as a function of the molecule compression/expansion reveals that molecular displacements of this tiny magnitude (a few of an Å) are insufficient to make a noticeable change to the -.
The results for -terminated decanethiol are similar. At positive bias, the molecule is compressed so that the group is further away from the STM tip, while at negative bias the molecule is stretched and the tip-to-molecule separation is reduced. Since the current calculated at negative bias is larger than that at positive bias, the electrostatic interaction in this case has the effect of enhancing the asymmetry of the - curves. This is also consistent with the experimental results, showing a larger asymmetry in the transport for the molecule terminated with the group. However, similar to the -terminated case, the estimated molecule length change is insufficient to make a noticeable modification to the - curve. Note that these negative estimates are all obtained by comparing the geometry at zero bias with that corresponding to the largest displacement (at Volt), so that they should be considered as the upper bound for the current changes. Therefore we can safely conclude that changes in molecule length can hardly be at the origin of the experimentally observed asymmetry in the - curve.
A further possibility is to consider changes in the bonding angle between the molecule and the substrate. As mentioned before, decanethiols do not arrange vertically to the surface, but they rather form angles of and , respectively for the and terminations dtf . Hence it is likely that the interaction between the STM tip and the endgroups causes the molecule to rotate either away from or towards the STM tip, as shown in figure 17. The direction of the rotation depends again on the sign of the electrostatic force. However since the energy required to change the bonding angle is expected to be rather smaller than that required for an axial distortion, we expect changes in bond angle to produce larger changes in the tip-to-molecule separation.

Using the same electrostatic forces calculated before we estimate for the termination a rotation towards the STM tip at positive bias (2 Volt), and a rotation towards the surface at negative bias (-2 Volt). Similarly for the termination, the rotations are along the opposite direction with changes in the bond angle of towards the surface at positive bias and towards the STM tip at negative bias. These rotations are sufficient to alter the - characteristics, as shown for both types of molecule in figure 18.
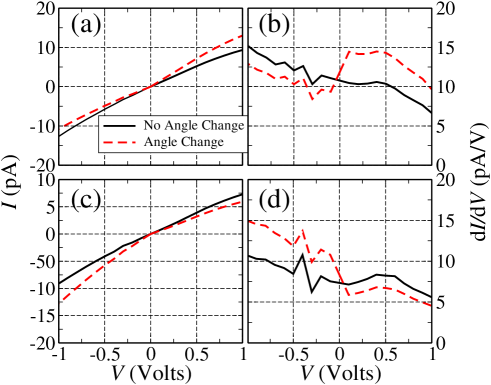
In the case of termination the calculated rotation is actually sufficient to suppress the asymmetry in the - present because of the asymmetric coupling to the electrodes. The current at 1 Volt is now larger for positive bias than that at the same negative bias. In contrast for -terminated molecules, the rotation is such that the - asymmetry already present is enhanced. Thus, when the electrostatic-induced rotation of the molecule is taken into account, the - curve for the -terminated molecule appears as more pronounced than that obtained for the -terminated one, in semi-quantitative agreement with experiments dtf .
In concluding we wish to point out a few possible sources of error in our calculations, which might affect a fully quantitative comparison with experiments. Firstly we remark that the Au atoms of both the tip and the substrate are described at the 6-only level. This provides a good description of the Au Fermi surface, thus of the transport properties, but usually it does not provide accurate interatomic forces. Secondly the calculated forces between the molecule and the tip certainly depend on the actual shape and detailed position of the tip. These are difficult to characterize with certainty and errors are therefore difficult to avoid. Finally the actual value of the tilting angle depends on the inter-molecular interaction is the self-assembled mono-layer, and thus the force required to change the angle would depend on the details of the molecular coverage (density, symmetry, bonding site, etc.).
IV Conclusion
We have demonstrated that the DFT-NEGF code smeagol can be used to simulate STM-type experiments in the near to contact regime. This is under the working condition of the tip-to-sample distance being sufficiently small that the basis orbitals have not been artificially cut off (i.e. the vacuum region between the tip and the surface is still well described). smeagol then allows us to investigate systems in which the tip interacts with the molecule, and to study effects of finite bias on the electronic structure of the molecule.
Calculations for alkanethiol molecules with STM-type arrangements show strong asymmetry in the - curves, which can be explained by the asymmetry in the coupling to the two different electrodes (substrate and tip). However, the calculated asymmetry is similar for both - and -terminated decanethiols, in contrast to the experimental measurements, showing a far stronger asymmetry for the case of termination. We have then investigated the original suggestion, which attributed the asymmetry to small configurational changes of the molecule under bias due to electrostatic interaction between the tip and the substrate. Our calculations demonstrate that changes to molecule length are too small and unlikely to have any major impact on the - curves, however a rotation of the molecule may cause significant changes to the current.
As a final remark we point out that the results presented in this work have obtained by using the LDA. However, LDA has several shortfalls which can strongly affect electron transport calculations. In this case, approximate self-interaction corrections such as ASIC dasc ; bdtsic are unlikely to offer a substantial improvement, since the conductance is due to off-resonance tunneling, and would not be particularly sensitive to the exact position of the molecular orbitals. However, for these molecules, an accurate calculation of the electric polarisability beyond the LDA might be important ASICPOL .
Acknowledgments
We thank G. Scoles for having driven our attention to the experiments discussed in this paper.
This work is funded by Science Foundation of Ireland (grant 07/IN.1/I945). Computational resources have
been provided by the HEA IITAC project managed by the Trinity Center for High Performance Computing and by
ICHEC.
References
- (1) G. Binnig, H. Rohrer, Ch. Gerber, and E. Weibel, Appl. Phys. Lett. 40, 178 (1982); G. Binnig, H. Rohrer, Ch. Gerber, and E. Weibel, Phys. Rev. Lett. 49 57 (1982).
- (2) F. Meier, L. Zhou, J. Wiebe and R. Wiesendanger, Science 320, 82 (2008).
- (3) M.F. Crommie, C.P. Lutz and D.M. Eigler, Science 262, 218 (1993).
- (4) B. Xu and N.J. Tao, Science 301, 1221 (2003).
- (5) X. Xiao, B. Xu and N.J. Tao, Nano Lett. 4, 267 (2004).
- (6) R. Temirov, A. Lassise, F.B. Anders and F.S. Tautz, Nanotechnology 19, 065401 (2008).
- (7) F. Pump, R. Temirov, O. Neucheva, S. Soubatch, S. Tautz, M. Rohlfing, and G. Cuniberti, Appl. Phys. A 93, 335 (2008).
- (8) J. Bardeen, Phys. Rev. Lett. 6, 57 (1961).
- (9) J. Tersoff and D.R. Hamann, Phys. Rev. Lett., 50, 1998, (1983); J. Tersoff and D.R. Hamann, Phys. Rev. B, 31, 805, (1985).
- (10) A. R. Rocha, V. M. García-Suárez, S. Bailey, C. Lambert, J. Ferrer and S. Sanvito, Nature Materials 4, 335 (2005)
- (11) A. R. Rocha, V. M. García-Suárez, S. Bailey, C. Lambert, J. Ferrer and S. Sanvito, Phys. Rev. B. 73, 085414 (2006); Smeagol is available at www.smeagol.tcd.ie.
- (12) M. Brandbyge, J.-L. Mozos, P. Ordejón, J. Taylor and K. Stokbro, Phys. Rev. B 65, 165401 (2002); J. Taylor, H. Guo, and J. Wang, Phys. Rev. B 63, 245407 (2001).
- (13) S. Datta, Electronic Transport in Mesoscopic Systems, (Cambridge University Press, Cambridge, UK, 1995).
- (14) H. Hohenberg and W. Kohn, Phys. Rev. 136, B864 (1964).
- (15) W. Kohn and L.J. Sham, Phys. Rev. 140, A1133 (1965).
- (16) J. M. Soler, E. Artacho, J. D. Gale, A. García, J. Junquera, P. Ordejón and D. Sanchez-Portal, J. Phys. Cond. Matter 14, 2745 (2002).
- (17) J. Junquera, O. Paz, D. Sánchez-Portal and E. Artacho, Phys. Rev. B 64, 235111 (2001)
- (18) J. Pflaum, G. Bracco, F. Schreiber, R. Colorado Jr., O.E. Shmakova, T.R. Lee, G. Scoles and A. Kahn, Surface Science, 498, 89 (2002).
- (19) Q. Sun and A. Selloni, Jour. Phys. Chem. A, 110, 11396 (2006).
- (20) I. Rungger and S. Sanvito, Phys. Rev. B 78, 035407 (2008).
- (21) A.R. Rocha and S. Sanvito, Phys. Rev. B 70, 094406 (2004).
- (22) Note that this is the LDA HOMO-LUMO gap calculated from the Kohn-Sham eigenvalues. As such, in general it is not expected to be a good estimate of the actual experimental gap, which is the difference between the ionization potential and the electron affinity of the molecule. In this case however the junction is in a tunneling regime already at this LDA level and possible corrections are expected to produce only minor quantitative changes to the calculated transport properties.
- (23) The sulphur-surface distance is defined as the distance between the S atom of the thiol group and the hollow position in the fcc (111) surface.
- (24) H. Sellers, A. Ullman, Y. Shnidman, and J.E. Eilers, J. Am. Chem. Soc. 115, 9389 (1993).
- (25) P.G. Piva, G.A. DiLabio, J.L. Pitters, J. Zikovsky, M. Rezeq, S. Dogel, W.A. Hofer and R.A. Wolkow, Nature (London) 35, 658 (2005).
- (26) Note that in our transport calculation the bias window is introduced by shifting the chemical potentials of both the tip and the substrate by . This is however completely equivalent to the standard STM setup where the sample potential is kept fixed and the voltage is applied to the tip. Note also that the definition of bias polarity in our work is opposite to that of Pflaum et al. dtf .
- (27) C. Toher and S. Sanvito, Phys. Rev. Lett. 99, 056801 (2007), C. Toher and S. Sanvito, Phys. Rev. B 77, 155402 (2008).
- (28) C.D. Pemmaraju, T. Archer, D. Sanchez-Portal, and S. Sanvito, Phys. Rev. B 75, 045101 (2007).
- (29) C.D. Pemmaraju, S. Sanvito and K. Burke, Phys. Rev. B 77, 121204(R), (2008).