Physical properties of amorphous solid interstellar material from X-ray absorption spectroscopy of Sco~X-1
High quality, high resolution X-ray spectra were obtained of Sco~X-1 with the Reflection Grating Spectrometer (RGS) on board the XMM-Newton satellite. The spectrum around the Oxygen K-edge is searched for signatures indicative for EXAFS. Analysis shows a clear indication for the existence of EXAFS with photo-electron scattering distances in the absorbing medium in a range which applies to many solids. When scattering of the photo-electron on Oxygen atoms is assumed, the Oxygen to Oxygen atom distances found are 2.75 Å. This fits with distances as found in amorphous water-ice, although water ice is thought to be an unlikely constituent of the diffuse interstellar clouds which form the absorbing medium towards Sco~X-1.
Key Words.:
X-rays, interstellar matter1 Introduction
Extended X-ray absorption fine structures (EXAFS) refer to the oscillatory appearance of X-ray spectra at the short wavelength side of an atomic edge. When an electron can be emitted from an atom due to absorption of an X-ray photon, back-scattering of the photo-electron wave by the surrounding atoms causes interferences which may prevent the absorption of the X-ray photon in the first place. This process is determined by the distances of the emitting atom to its neighbours. This interference behaviour will cause a sinusoidal structure of the absorption cross-section with wavelength. Since the photo-electron will normally be absorbed within short distance by the medium into which it is emitted, the EXAFS spectral structure will only show the average local surroundings of emitting atoms. Whereas crystalline structures, which are repetitive over large distances, can be studied by X-ray diffraction techniques, EXAFS were recognized as an important tool to study amorphous materials (see e.g. Sayers et al. (1971)). The availability of high intensity X-ray facilities therefore has made the study of EXAFS an established technique in many fields of the materials sciences.
For astronomy, the availability of a new generation of large X-ray telescopes like Chandra and XMM-Newton, with their high resolution X-ray spectrometers, was already early recognized as an opportunity to observe EXAFS of interstellar dust and hence study the character of the solid material of dust particles (see. e.g. Woo (1995)). However, until now only limited possible observations of interstellar EXAFS have been reported (Petric et al. (2005), Ueda et al. (2004), Lee et al. (2002)).
The high intensity of the ground based X-ray sources used by the material sciences for EXAFS studies means that signal to noise ratio is extremely high. In contrast, in astronomical sources noise is a serious problem for EXAFS studies. In addition, since EXAFS extend over a broad range in wavelengths, stability and knowledge of the instrument effective area and response is needed to a very high level of accuracy.
| Orbit | Observation | Date | Duration (ksec) | pointing | CCD mode |
|---|---|---|---|---|---|
| 0224 | 0134550501 | 27-02-2001 | 8 x 2 | on-axis | single CCD |
| 0402 | 0153950201 | 18-02-2002 | 4 x 6 | off-axis | 2-CCD |
| 0592 | 0152890101 | 03-03-2003 | 15 | on-axis | RGS1 CCD4 |
| 8 x 1.4 | on-axis | RGS2 single CCD | |||
| 0152890201 | 9 | on-axis | RGS1 CCD4 | ||
| 6 x 1.4 | on-axis | RGS2 single CCD | |||
| 0152890301 | 9 | on-axis | RGS1 CCD4 | ||
| 6 x 1.4 | on-axis | RGS2 single CCD |
Sco~X-1 is one of the brightest X-ray sources in the sky and its emission is subject to interstellar absorption. It is located at a distance of about 2.8 kpc (Bradshaw et al., 1999) at a galactic latitude of , which means the source is situated about 1.1 kpc above the galactic plane. This is well above the scale height of neutral interstellar material in the galaxy. For this reason the expected total column density of in front of the source can be derived from H i surveys and is estimated at about . This corresponds quite well with the absorption derived from low energy X-ray spectra (de Vries et al., 2003). Using a dust to gas ratio of (Vuong et al., 2003) we get a total of about 1 magnitude of extinction at optical wavelengths. Comparing this with a general extinction of about 1.9 magnitude/kpc (Savage & Mathis, 1979) in the plane of the galaxy and keeping in mind that the line of sight to this high latitude source only traverses part of its total length through the molecular disk of the galaxy it is safe to assume that all low energy X-ray absorption is due to the common diffuse material present in the galactic interstellar medium. In cold parts of this medium absorption by solid dust particles will play a significant role.
The high intensity of the X-ray flux from Sco~X-1 provides high signal to noise ratio spectra in relatively short exposure times. This allows for a detailed study of the X-ray absorption characteristics of the interstellar medium. In addition the high likelihood of absorption by solid matter makes this source ideally suited to look for EXAFS.
2 Observations and data reduction
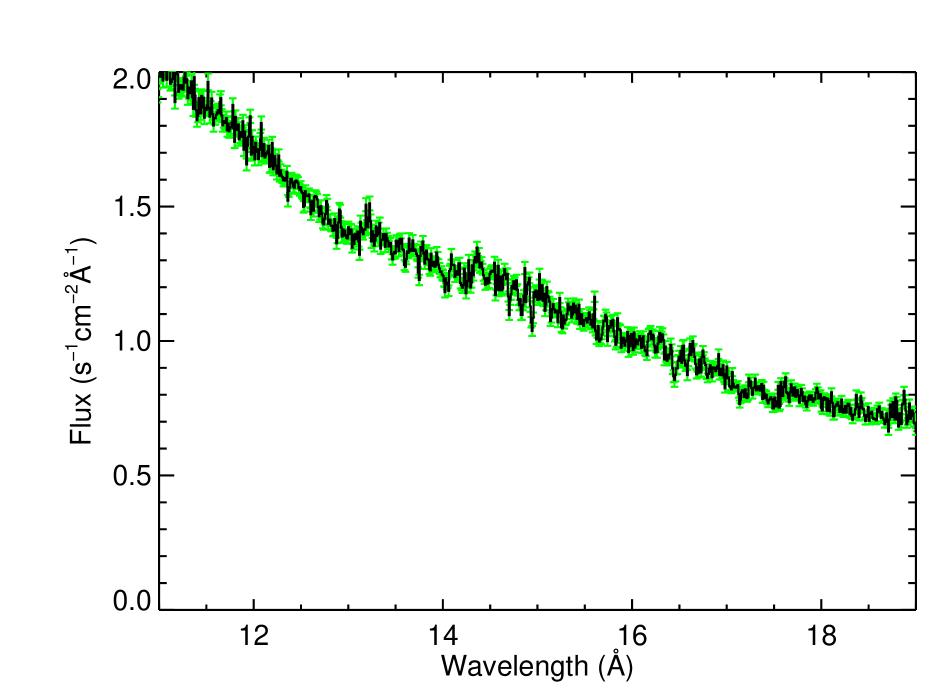
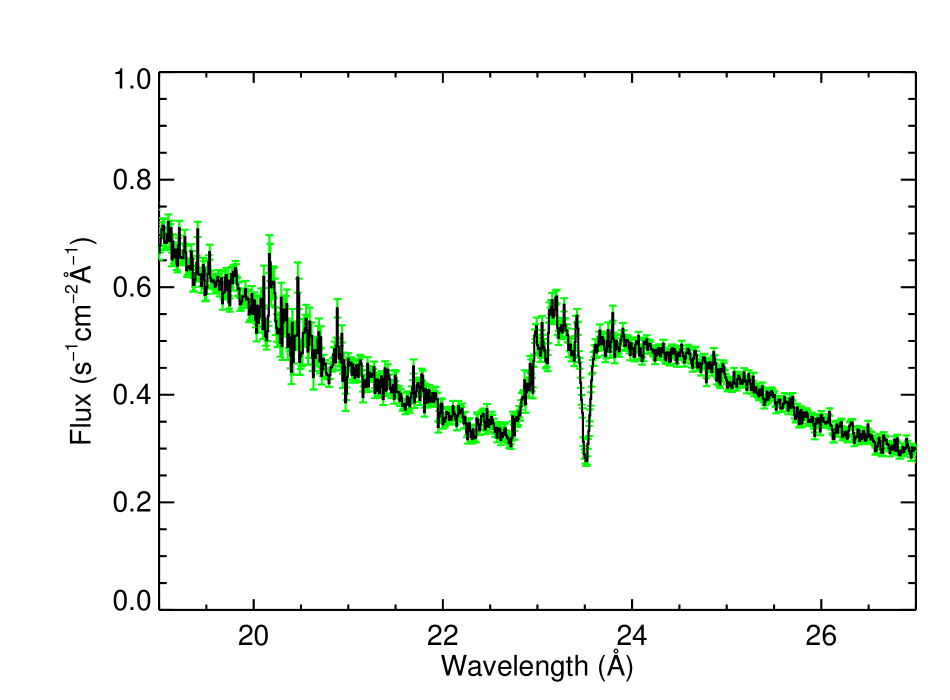
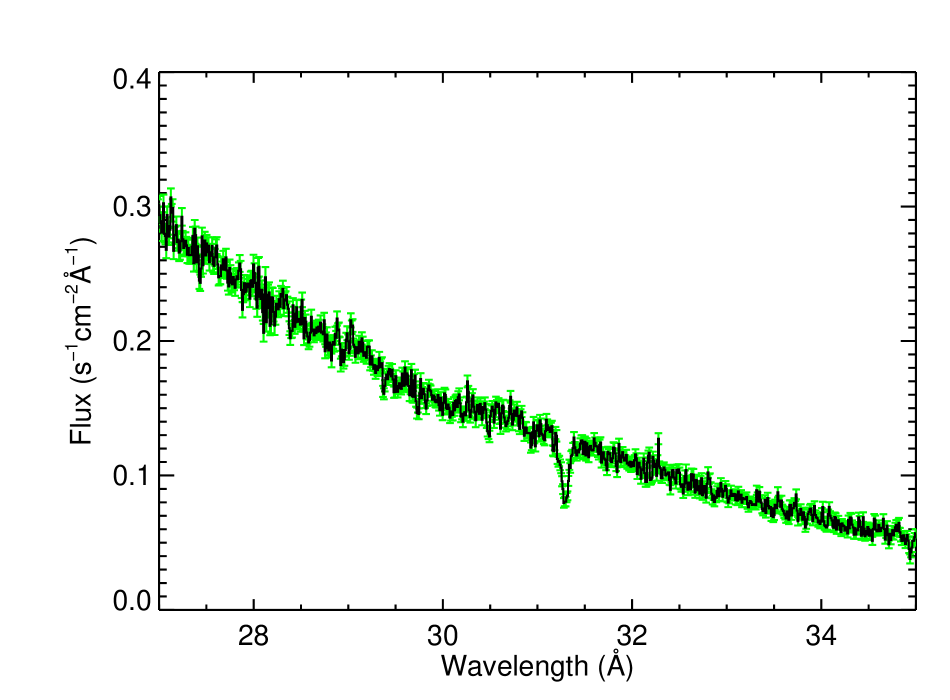
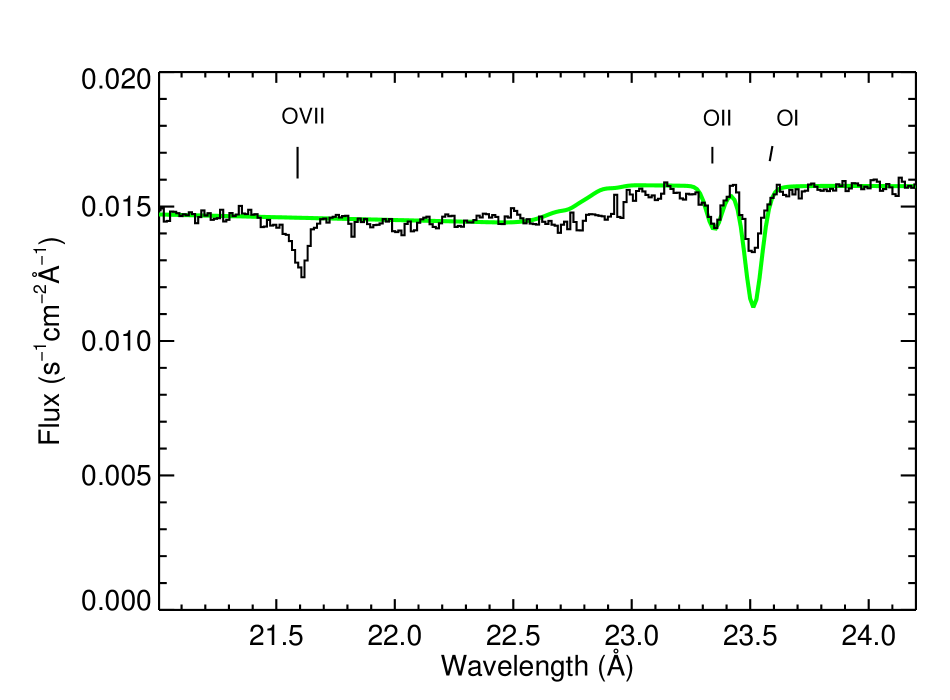
The XMM-Newton RGS instrument (den Herder et al., 2001) provides high resolution X-ray spectra in the soft energy band (6 - 38 Å). In this energy band the predominant interstellar absorption features are caused by the elements oxygen, nitrogen, neon and iron (see Fig. 1). Neon and nitrogen are thought to be present mainly in atomic gas phase, while iron will be mainly chemically bound in compounds contained in interstellar dust. Oxygen is one of the most abundant elements and causes the most prominent features in the spectrum, notably the deep Oxygen edge at around 23 Å. Oxygen is expected to be partly in (atomic) gas phase and partly bound in various chemical compounds in solid form. Here we concentrate on signatures (EXAFS) of solids around the oxygen edge.
Sco~X-1 has been observed on several occasions with the RGS instrument, in part for calibration purposes. Table 1 gives an overview of the observations used in this paper. Due to the high X-ray flux of Sco~X-1, a standard spectroscopy mode observation would lead to unacceptable pile-up on the detector and loss of large amounts of observing time due to overload of the on-board processing capabilities and limited telemetry capacity. For this reason a faster readout mode was selected by reading individual single RGS CCD’s in separate exposures. The high flux of Sco~X-1 also allowed for an off-axis observation mode, effectively shifting the spectrum to a different location on the CCD’s. At large offset angles (we used 27 arc-minutes), the effective area of the instrument is reduced, decreasing potential problems with pile-up thus allowing for multiple CCD readouts. This will increase effective exposure time. Although large offset angles do introduce some additional uncertainty in absolute flux, the change in shape of the response curve is mild and well-modeled. In the limited wavelength range of interest (21-24 Å) the effect is negligible and it is almost inconceivable that the off-axis positions will introduce (or erase) a spectral modulation indicative of EXAFS.
Combining observations with different offsets will decrease systematic errors in the spectra due to hot and erratic pixels on the CCD. Combining observations with large offsets will also decrease small unknown fluctuations of effective area due to inhomogeneous CCD response, effectively smoothing errors in the effective area. This will increase the possibility of detecting real source broad wavelength flux fluctuations. The large offset has the extra advantage that the important oxygen edge is covered by both RGS instruments. In default on axis pointing mode the oxygen edge is only visible by one RGS (RGS1) since the corresponding CCD on the other RGS has failed early in the mission. The large offset shifted the oxygen edge to a different CCD location where both instruments have operational CCD’s.
In all, these special calibration mode observations have made this set of observations ideally suited for the search for EXAFS.
Due to the shifted spectrum in the offset pointings, the total usable spectral range of the combined observations extends from 12 to 38 Å.
All data were reduced with the XMM-Newton data analysis system SAS version 7. Since the source was slightly variable between different observations and the scale of the off-axis effective area is not accurately known, obtained fluxes from the different observations have been scaled to fit the revolution 0224. The average of the scaled, fluxed spectra (obtained using task ”rgsfluxer”) was taken for further analysis (Fig. 1)
3 Analysis and discussion
Defining the edge energy at we can compute the wave number of the escaping photo-electron as:
With the electron mass, the wavelength and and Planck’s constant and the velocity of light respectively.
is defined as the relative change in the absorption coefficient with respect to the smooth continuum (see Fig. 2, top) at energies above the edge:
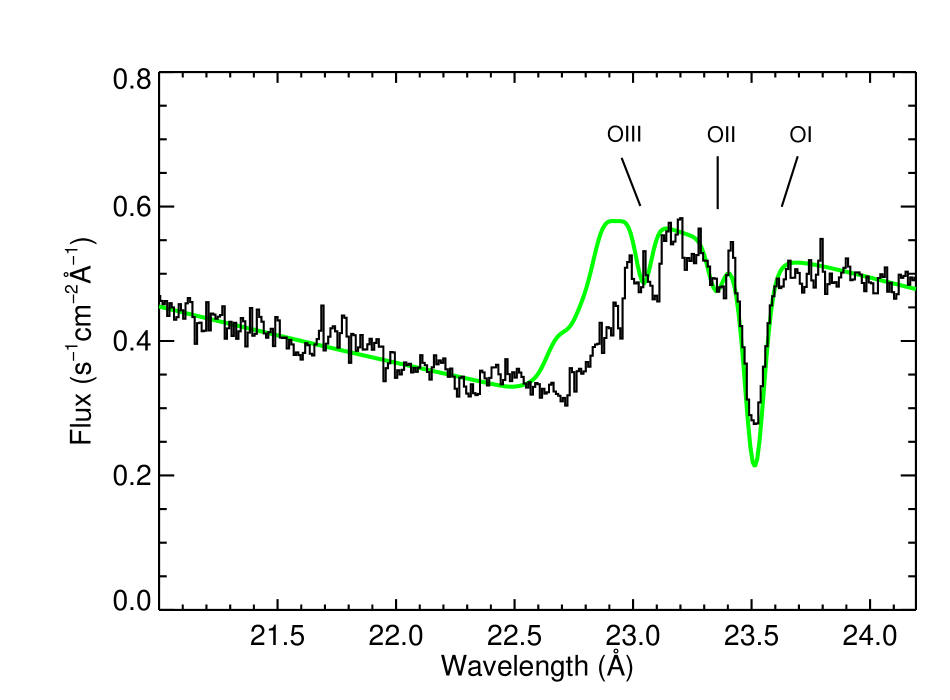
Because changes in the observed flux due to EXAFS are small with respect to the absolute flux, can be obtained directly from the relative changes of the flux with respect to the smooth continuum flux. This continuum is computed by taking the atomic oxygen absorption cross-section as given by McLaughlin & Kirby (1998) applied to a linear slope across the small wavelength region of interest (21-24 Å), fixing the continuum to the flux actually observed at the edges of the wavelength region. (see Fig. 2, top plot)
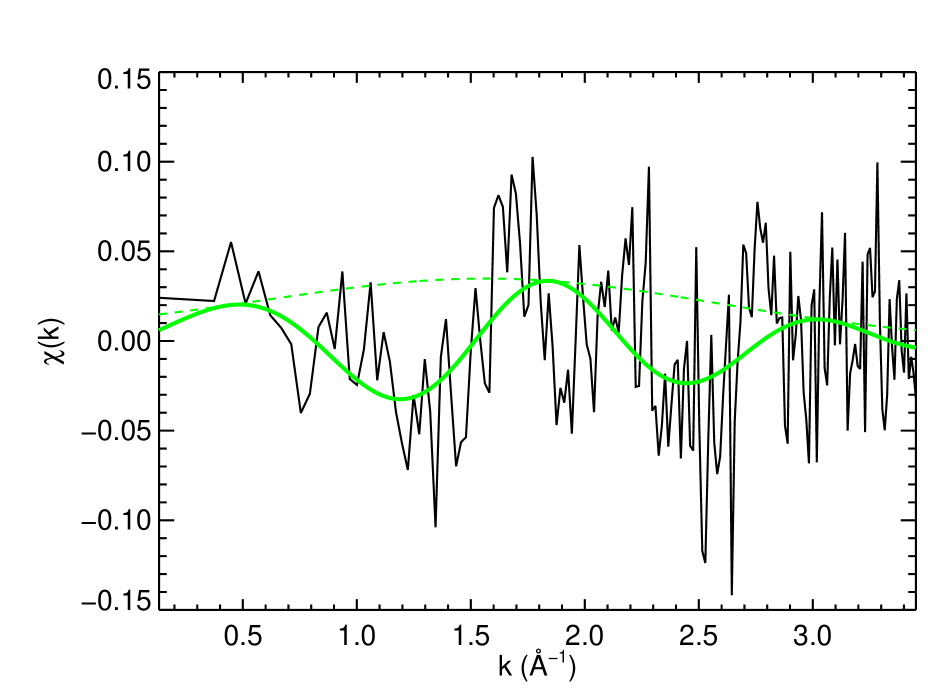
Plotting as function of (see Fig. 2, middle plot), will reveal EXAFS as a sinusoidal structure. Analyzing the spatial frequencies in this plot, by taking the absolute value () of the Fourier transform (FT), which scales linearly with EXAFS amplitudes, will show peaks representing the distances of the scattering atoms in the absorbing solid. (The surface area under the peak corresponds to the total amplitude of the EXAFS, since zeroes added to extend the range prior to the transform (see e.g. Lee et al. (1981)) cause a smoothing (convolution) of the FT-magnitude graph). Peak positions () do not however translate directly to atomic distances, due to phase shifts in the scattering process. Phase shifts must be known beforehand, e.g. from theoretical calculations, in order to obtain true atomic distances.
A major problem is the adopted value for the edge energy (Lee et al., 1981). Although edge energies for many isolated atoms are known with sufficient precision, edge energies are subject to chemical shifts for atoms bound in solids and are generally not known. Methods do exist to resolve this issue by comparing the phase of the EXAFS (as function of ) with similar representative known solids. Since such data are lacking here, we adopted the strategy of slightly varying within reasonable bounds and looking for features which remain constant.
In standard EXAFS analysis is multiplied with prior to Fourier transformation, to cancel the decreasing power of EXAFS oscillations at large . The extremely low noise in such (ground) spectra does allow this weighting. In our spectrum however, noise is significant. Multiplying with would blow up the Fourier transform at higher to unacceptable values. For this reason multiplication was left out. The result is that the height and width of the peaks in the power spectrum will not represent the true magnitude of the presence of a particular atomic distance and scattering cross-section in the solid. For this reason we will only discuss the position of the peak (and hence distances) found and not their magnitude.
Figure 2 shows the EXAFS analysis described above for Sco~X-1. The top plot shows the spectrum in the wavelength region of interest, including the smooth continuum based on the atomic oxygen cross sections computed by McLaughlin & Kirby (1998). These cross sections include the 1s-2p O i resonance feature indicated in the plot. The fact that comparing the combined fit of edge depth and line shows a shallower line in the actual spectrum may be due to the fact that not all oxygen is in atomic form. Bound oxygen may have a strongly diminished 1s-2p feature when the 2p shell can be thought of as being filled by the chemical binding. The edge depth on the other hand does sample both oxygen in bound and atomic state. In addition possible resonance lines of O ii and O iii are fitted (see e.g. Costantini et al. (2005)) These resonance structures are indicated for reference only and have no meaning for the EXAFS analysis. The apparent shift of the observed edge structure with respect to the computed atomic oxygen edge may also be due to the fact that part of the oxygen is bound in solids. A detailed analysis of the edge structure itself however is beyond the scope of this paper and will be discussed in a subsequent article.
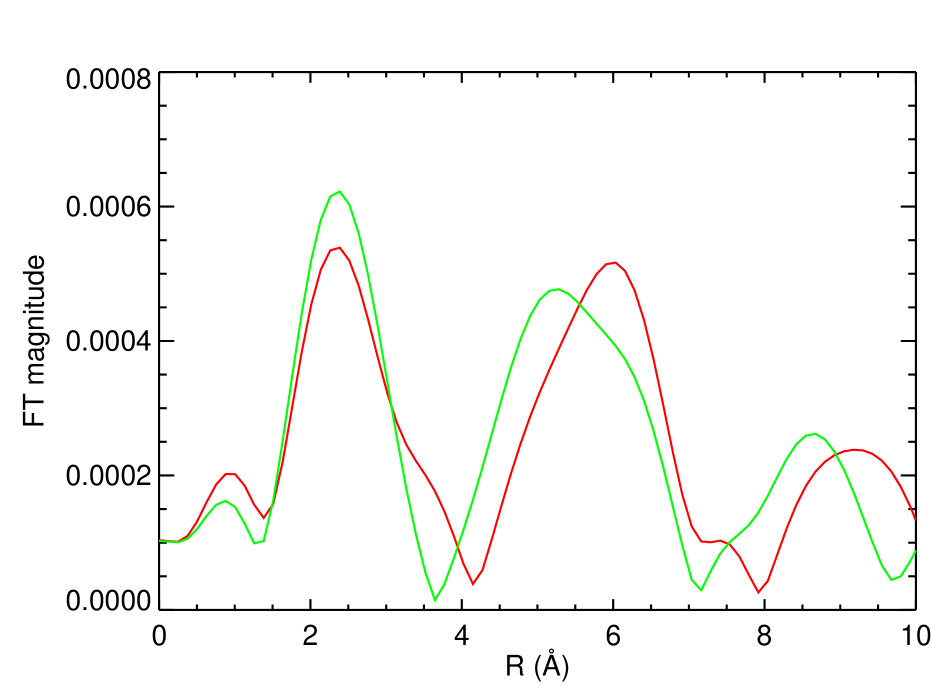
For our EXAFS analysis, the edge energy was varied between 22.6 and 22.9 Å and a representative plot with is shown in figure 2 (middle plot). Looking at the peaks in the FT magnitude, it is found that the peak at Å is quite insensitive to changes in edge energy and varies only by about 0.1 Å within an appropriate range of edge energies (22.70 - 22.80 Å), while the peak at Å is a bit more variable in both magnitude and position (see figure 3) Selecting the Å peak and Fourier transforming back to the scale, we get the sinusoidal curve (light grey line) in the middle plot. This clearly shows that the selected spatial frequency indeed follows the structure of the raw data and that sinusoidal signatures do exist in the data. This is clearly an indication for the presence of EXAFS in the data.

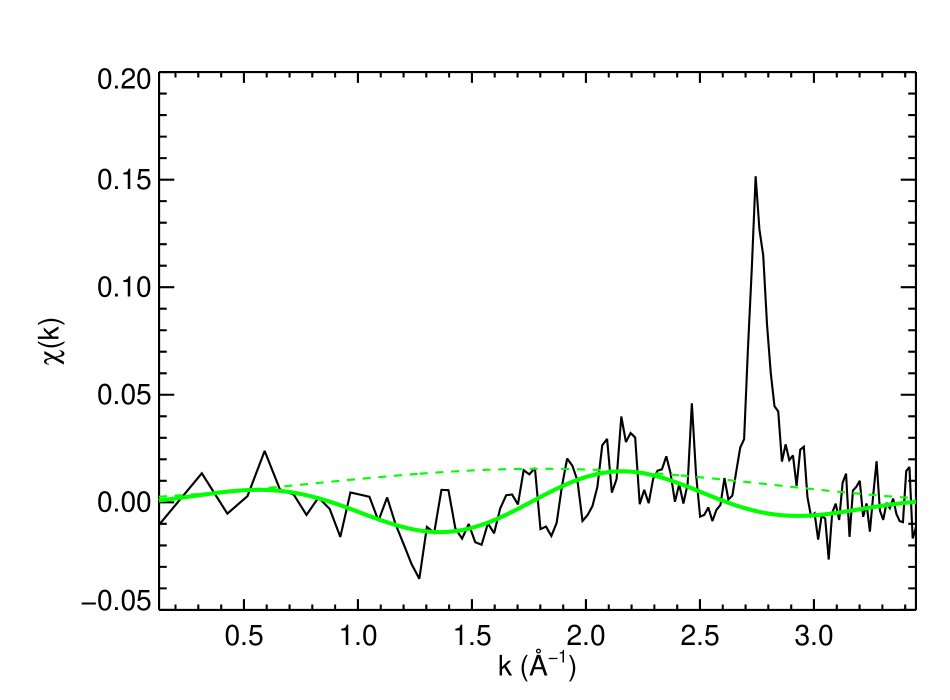
Next issue is to see if these EXAFS are originating in the source, or can be attributed to instrumental effects. For this reason the same analysis was performed on the total of all RGS Mrk~421 data. All these data-sets combine a total of about 1.3 Ms of exposure time. The line of sight towards Mrk~421 suffers only from very low extinction (de Vries et al., 2003) and no significant absorption by solid material is expected there. As in the case of Sco~X-1 offset observations were performed, but in this case the magnitude of the offsets was limited. For the oxygen edge therefore only one RGS can be used. The limited offsets also mean that possible gradual unknown errors in effective area will diminish less than in the case of the Sco~X-1 spectrum.
In figure 4 the result is shown. A first peak does appear at 1.9 Å, which is close to the 2.4 Å position of the Sco~X-1 spectrum. However, comparing the FT magnitudes of figures 2 and 4 (bottom plots) it can be seen that the FT magnitude of this peak as derived from is only 40% of the 2.4 Å peak of Sco~X-1. is defined as the relative change in absorption which corrects for the relative difference between source fluxes. Since peak widths are virtually identical this also means the surface of the Mrk~421 peak, which traces the total EXAFS magnitude, is 40% of the Sco~X-1 feature. This is confirmed by proper analysis of the peaks. This difference is significant, since the error in the amplitude, derived from the average statistical error around the oxygen edge and the number of datapoints used in the fit, was computed at about 10% only for both peaks.
It appears that the source with largest absorption (Sco~X-1) does have the largest EXAFS signature. For purely instrumental features, one would have expected equal signatures.
An extra check was made by removing the EXAFS found in Mrk~421, which may trace instrumental features, from the derived in Sco~X-1 by subtracting the relative EXAFS amplitudes (relative to the smooth continuum and keeping in mind that the amplitudes of the EXAFS are small with respect to the total flux) and check the resulting Fourier transform. This plot is shown in Fig. 5. The main peaks of Fig. 2 remain, confirming their likely interstellar nature. The top amplitudes in the Fourier transform hardly change, since the peak in the Mrk~421 Fourier transform was somewhat shifted with respect to the peak in the Sco~X-1 FT transform and phases of slightly differ. The shape of the R=2.40 Å peak changes in the sense that it becomes somewhat more narrow on the short R side.
The peak positions found are in a range of distances (taken into account possible phase shifts up to 0.4 Å) which apply to a multitude of minerals. Unfortunately, proper laboratory data on the solid structures expected for interstellar dust grains are scarce. The data presented here can help solving the likely structure of solid dust grains when data on appropriate compounds become available.


A likely candidate atom for the photo-electron scattering is another oxygen atom, since those are very abundant. Phase shifts for scattering on oxygen atoms are computed at about 0.35 Å (Zubavichus et al., 2004). Therefore the atomic distance probed by a peak at R=2.40 Å amounts to a real distance of 2.75 Å. Amorphous water-ice is known to have an oxygen-to-oxygen distance of 2.73 Å (Zubavichus et al., 2004), which fits very nicely with the peak we find, given our peak-position uncertainty of about 0.1 Å. However, other compounds with electron scattering on other atoms then oxygen cannot be ruled out. Woo (1995) reports a set of atomic distances for different atoms for different minerals. None of these distances seem to be observed in here, but the list is by no means exhaustive. Furthermore, not much is known about the exact mineral atomic lattice structure in dust grains which might be different from the solids generally found on earth.
It is known that the RGS instrument features an instrumental oxygen edge, which is constant with time and is taken into account by the calibration during data processing. This instrumental oxygen, which amounts to an Oxygen column depth of about is most likely in the form of a thin ice-layer of about 550 Å on top of the detector (de Vries et al., 2003). This ice will also cause EXAFS features which are not taken into account by the calibrations. The Å feature in the Mrk~421 spectrum may be due to a combination of this ice layer and small uncorrected wiggles in the effective area. As such the intensity of the Å peak can thus be regarded as an upper limit for EXAFS caused by the instrumental ice layer. If we assume the Sco~X-1 EXAFS peak to be due to ice, the fact that the peak for Mrk~421 is at a somewhat different position (and phase) might be either due to the interference of residual instrumental effects, or by the fact that the instrumental oxygen is bound in a different form of ice compared to the possible ice on interstellar dust grains (e.g. a crystal lattice compared to amorphous ice). Of course the Sco~X-1 EXAFS peak may represent a different mineral than ice.
The Sco~X-1 EXAFS will also contain instrumental features present. Since the thickness of the instrumental ice layer is constant with time, as checked by regular calibrations, and the Sco~X-1observations were performed in the same time frame as the Mrk~421observations, the spectra of both sources will be similarly affected by the instrumental ice layer. Assuming that the amplitude of both Sco~X-1 and Mrk~421 EXAFS peaks scale in the same way with the amount of oxygen, this means that a maximum of 40% of the Sco~X-1 EXAFS Å peak may be instrumental. If we assume the total instrumental EXAFS feature Å peak to be due to an Oxygen column density of , the interstellar component of the Sco~X-1 EXAFS, a minimum of 60% of its total peak, would amount to 1.5 times the instrumental Oxygen which is . Since the total interstellar Oxygen column density towards Sco~X-1 is about (de Vries et al., 2003), this means that the intensity of the Sco~X-1 EXAFS spectral features hints that at least 30% of the interstellar Oxygen in the galactic plane towards Sco~X-1 is bound in solids, if we assume that the peak intensity in the EXAFS Fourier plot behaves as it would do if it would represent ice. If the total EXAFS signal in Sco~X-1 can be attributed to interstellar origin, this would present an upper limit of 50% bound in solids.
This 30-50% part for solids is only a very approximate number given instrumental uncertainties and other systematics and should only be seen as an indication. However, such a number does not appear entirely unrealistic. A major part of the Oxygen will be in atomic form (given the visibility of the narrow 1s-2p line) and not be part of solids. If other atoms than oxygen are responsible for the photo-electron back scatter, as can be the case in other solids than ice, these atoms can have higher cross-sections for the back scatter process. In such cases the estimate for the amount of oxygen bound in solids will be correspondingly lower.
The EXAFS peak does fit remarkably well with amorphous ice. Problem however is that the extinction towards Sco~X-1 is likely caused by diffuse dust clouds in the general interstellar medium. Although water-ice is present in the cores of dense molecular clouds, it is hardly found in diffuse clouds (see e.g. Draine (1995)). Other, more robust minerals containing Oxygen, like silicates, are thought to form dust particles in diffuse clouds. Although water-ice, given the position found for our peak in the EXAFS plot, does fit, we need data on other minerals to see if water-ice remains the only candidate. Especially around the Oxygen edge however, such data are scarce.
4 Conclusions
In the X-ray spectrum of Sco~X-1, the Oxygen-K edge was searched for the existence of EXAFS, which indicate the presence of solids in the absorbing medium. A clear signal was found. Comparing with spectra of Mrk~421 it is found that instrumental effects may account for 40% of the signal. Assuming that EXAFS signals scale with that of water-ice we find roughly 30-50% of the absorbing oxygen is bound in solid material. Although amorphous water-ice does fit the EXAFS peaks found, this material is an unlikely candidate given the diffuse character of the absorbing medium. The data presented here can help solving the character of interstellar dust grains when appropriate laboratory data on various plausible materials become available.
Acknowledgements.
Based on observations obtained with XMM-Newton, an ESA science mission with instruments and contributions directly funded by ESA Member States and NASA. The authors want to thank J. Kaastra for reading of the manuscript.References
- Bradshaw et al. (1999) Bradshaw, C. F., Fomalont, E. B., & Geldzahler, B. J. 1999, ApJ, 512, L121
- Costantini et al. (2005) Costantini, E., Freyberg, M. J., & Predehl, P. 2005, A&A, 444, 187
- de Vries et al. (2003) de Vries, C. P., den Herder, J. W., Kaastra, J. S., et al. 2003, A&A, 404, 959
- den Herder et al. (2001) den Herder, J. W., Brinkman, A. C., Kahn, S. M., et al. 2001, A&A, 365, L7
- Draine (1995) Draine, B. T. 1995, in Astronomical Society of the Pacific Conference Series, Vol. 80, The Physics of the Interstellar Medium and Intergalactic Medium, ed. A. Ferrara, C. F. McKee, C. Heiles, & P. R. Shapiro, 133–+
- Lee et al. (2002) Lee, J. C., Reynolds, C. S., Remillard, R., et al. 2002, ApJ, 567, 1102
- Lee et al. (1981) Lee, P. A., Citrin, P. H., Eisenberger, P., & Kincaid, B. M. 1981, Reviews of Modern Physics, 53, 769
- McLaughlin & Kirby (1998) McLaughlin, B. M. & Kirby, K. P. 1998, Journal of Physics B Atomic Molecular Physics, 31, 4991
- Petric et al. (2005) Petric, A., Paerels, F., & Audard, M. 2005, in ESA Special Publication, Vol. 577, ESA Special Publication, ed. A. Wilson, 305–306
- Savage & Mathis (1979) Savage, B. D. & Mathis, J. S. 1979, ARA&A, 17, 73
- Sayers et al. (1971) Sayers, D. E., Stern, E. A., & Lytle, F. W. 1971, Physical Review Letters, 27, 1204
- Ueda et al. (2004) Ueda, Y., Murakami, H., Yamaoka, K., Dotani, T., & Ebisawa, K. 2004, ApJ, 609, 325
- Vuong et al. (2003) Vuong, M. H., Montmerle, T., Grosso, N., et al. 2003, A&A, 408, 581
- Woo (1995) Woo, J. W. 1995, ApJ, 447, L129+
- Zubavichus et al. (2004) Zubavichus, Y., Yang, Y., Zharnikov, M., et al. 2004, ChemPhysChem, 5, 509