Stellar kinematics in blue compact galaxies
Abstract
In a programme of observations of local luminous blue compact galaxies (BCGs) we are investigating kinematics by using tracers of both stars and ionised gas. Here we summarise our program and present new data on the local Lyman break galaxy analogue Haro 11. From spatially-resolved spectroscopy around the near-infrared Ca ii triplet, we find that its stars and ionised gas have similar velocity fields. Our programme so far indicates however that emission line velocities can differ locally by a few tens of km s-1 from the Ca ii values. Comparing our data to simple stellar population models, we assess which stellar population the Ca ii triplet traces and its potential beyond the local universe.
type:
Star-forming Dwarf Galaxies: Ariadne’s Thread in the Cosmic Labyrinthams:
98.56.Wm, 98.52.Sw, 98.54.Ep, 98.58.-w, 98.62.Ai, 98.62.Dm, 98.62.Lv, 98.65.Fz1 Introduction
Two central questions in galaxy evolution are how starbursts are triggered and how they are quenched, and how triggering and quenching are related to galaxy properties and environments. Starburst episodes in easily observable, nearby galaxies may be started by collisions with other galaxies and/or gas clouds, but a galaxy’s star formation rate is also likely to vary naturally during its history, simply as a result of internal motions and feedback. Kinematic studies which include both gas and stars have the potential to distinguish between triggering mechanisms.
Blue compact galaxies (BCGs) are a promising population for investigating these effects. They tend to be only moderately affected by internal reddening, allowing us a fairly unencumbered view of the star-forming region. BCGs in the local universe (100 Mpc) span the range between star-forming dwarfs and systems whose properties more closely resemble starbursting galaxies at higher redshift (e.g. Lyman break galaxies [1]; LBG) while still being close enough for spatially resolved spectroscopy. Haro 11 at =88 Mpc is one of the best local LBG analogues [2]. Its high star formation rate (20 M⊙ yr-1[4]) and lack of detected H i [3] suggests the starburst may be running out of gas.
Östlin et al[4] observed and analysed the ionised gas kinematics of a sample of BCGs using Fabry-Perot spectroscopy in H. The picture that emerged of galaxies with predominantly disturbed kinematics and absence of rotational support suggested that large-scale dynamical disturbances — mergers, for example — could have triggered their current starbursts. Nevertheless, feedback from supernova explosions and stellar winds may dominate the emission-line kinematics and compromise our ability to distinguish large-scale dynamical effects.
We are carrying out a programme of observations of blue compact galaxies with the aim of measuring and comparing kinematics in both stars and ionised gas. To trace the stars we use the near-infrared Ca ii triplet (CaT), and for the gas, [S iii] and Paschen emission lines. Our lines are close in wavelength and avoid differential interstellar extinction. Other potential stellar tracers are either contaminated by interstellar absorption (Na i D, Ca ii H, K; [5]) or too weak (Mg i 5170).
In our programme so far we have reported results for three ESO 400-G43 [6], He 2-10 [7] and ESO 338-IG04 [8]. Here we summarise the program so far, present early results for Haro 11 (ESO 350-IG38) and take a critical look at the CaT method and which stars it traces.
2 Observations and method
Our observations are presented in detail in our previous papers [6, 7, 8]. Here we introduce long-slit spectra of Haro 11 taken using FORS2 at the VLT on 2003 Aug 6-7, to be presented in Cumming et al (in preparation). The galaxy spectra were complemented by observations of six bright late-type giants and supergiants which we use as templates for cross-correlation.
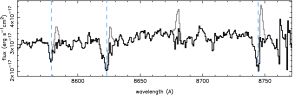
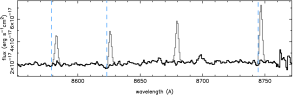
After extracting spatially-separated spectra, we modelled and subtracted the Paschen line emission which contaminates the red wing of all three Ca ii triplet lines (Fig. 2). This procedure is critical if we are to derive correct velocities. If stars and gas follow each other, for example, oversubtraction will give a spuriously high velocity, and undersubtraction a CaT line that is too blue. The Paschen line model was constructed using as templates the strongest clean Paschen lines (Pa 10+11+12), or where they are too weak, the strong [S iii] line. Success requires good signal to noise ratio both in the observed Paschen lines and in the stellar continuum.
To recover the stellar velocity and an estimate of the velocity dispersion from the subtracted spectra, we use two different methods: cross-correlation with template stars [12, 13, 14] and penalised pixel-fitting (pPXF) using a template library [15]. We have described our implementation of these procedures in detail in ref. [8].
3 Results
3.1 Star and gas velocity fields
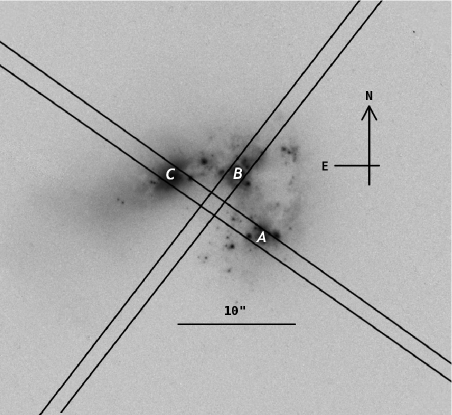
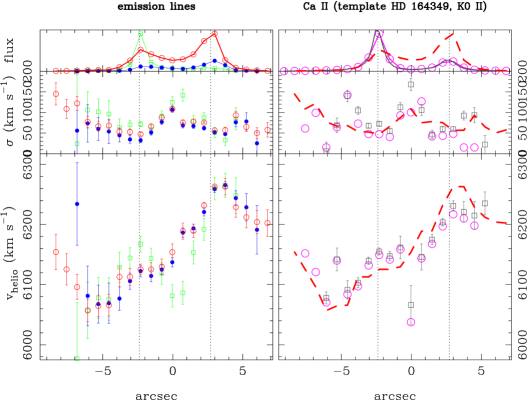
We present our spatially-resolved stellar and gas velocity measurements for Haro 11 in Figure 3. Our slit joins knots A and C (Fig. 1). The velocities measured in the gas and the stars follow one another to within the likely experimental errors. The stellar velocity dispersions are likewise similar to the velocity dispersions measured from the emission line widths.
The stellar velocity measurements are however strongly affected by imperfect Paschen-line subtraction, particularly where the contrast between the stellar lines and Paschen emission is large. Where the Paschen lines are strong and the stellar signal weak, the stellar velocities are more uncertain than the error bars indicate.
3.2 Line equivalent widths
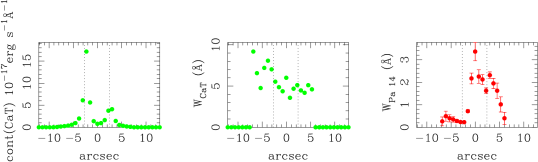
Our spectra provide some other clues to the stars whose velocities we are tracing. In Figure 4 we plot three measures of the stellar population in Haro 11: (1) the strength of the continuum close to the Ca ii triplet, which we expect to be dominated by stars [17]; (2) the equivalent width of CaT, ; and (3) (see sect. 4.2), the equivalent width of the unblended Paschen line between Ca ii and 8662 (scaling from the flux in Pa 10 to ensure suitable signal-to-noise ratio).
The scatter in is large but is noticeably larger around knot C (7 Å) than knot A (5 Å). is very low around knot C and peaks around 2 Å in the nebulosity surrounding knot A. Our other slit shows an even stronger peak in at knot B.
4 Discussion
4.1 Stars and gas follow each other, but not always
Our programme so far indicates that CaT absorption in BCGs in some cases follows the emission-line kinematics (ESO 338-IG04, Haro 11; [8]) but in others shows differences of up to a few tens of km s-1 (ESO 400-G43, He 2-10; [6, 7]). This indicates that bright emission lines are unreliable tracers of the stellar velocities in BCGs. What this tells us about the dynamics of each galaxy and feedback processes depends, however, on the stellar population whose kinematics we are measuring.
4.2 Spatial resolution and stellar populations
We have compared our equivalent width measurements (Fig. 4) with stellar population models in an attempt to understand which stars the Ca ii triplet allows us to trace, and which stars the Paschen emission lines conceal from our view.
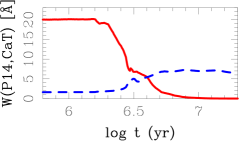
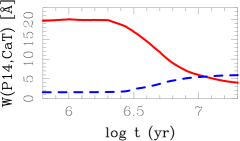
Reliable CaT velocities require low equivalent widths in the Paschen series. Our long-slit data require Å. This puts constraints both on the stellar population and, more practically, how well we can resolve the galaxy, since we need unencumbered line of sight to the population in question. We have used the Starburst99 population synthesis code [16] to see how the equivalent widths of Pa 14 and CaT can be expected to evolve in a starburst galaxy like Haro 11 (Fig. 5).
In a model with constant star formation rate (Fig. 5, right panel), it takes well over Myr for the Paschen lines to fade sufficiently. This situation is appropriate if our resolution element include local instantaneous bursts at different evolutionary stages. It seems likely that Haro 11’s star formation was spread out over time [3], so integrating the light of the whole galaxy will probably make it look like a continuous starburst. However, our spatial resolution allows us to resolve smaller regions (e.g. knots A, B and C) which may be modelled as instantaneous bursts (Fig. 5, left panel). After only 5 Myr, recombination emission from such a burst has dropped enough for CaT to be measurable. At such ages, we expect the CaT to be mostly provided by red supergiants (RSGs) [18]; in older populations, CaT absorption comes instead from low-mass red giants. Low-metallicity galaxies like Haro 11 the contribution to from RSGs is expected to be lower than in high-metallicity systems, and this accounts for the lack of an RSG peak in the evolution of .
In Haro 11, knot C and the region surrounding it provides the best measurements of CaT absorption. In knot C, while we see no evidence of significant Paschen absorption lines, the Balmer series is present in absorption and can be used as an age estimator. We have used the absorption wings of H and H8 to measure their equivalent widths, and compared with models from ref. [21] (as we did in ref. [22]), finding an age of about 20 Myr. In knots A and B, the lack of Balmer absorption and high emission equivalent widths indicate instead ages of only a few Myr. The starburst in Haro 11 appears to have been spread out over at least the last 20 Myr, and we can reliably trace the stellar velocities in CaT only where the older population is not outshone by the younger gas-rich regions. An intermediate case is where super star clusters (Adamo, these proceedings) have ejected their ionised gas and can be distinguished from the surrounding wind-blown bubble (e.g. cluster #23 in ESO 338-IG04 [22]).
CaT kinematic data like ours have the potential to separate the kinematics of stars and gas in at least nearby star-forming galaxies and distinguish between models of how they form and evolve. Simulations have indicated that mergers can account for the disturbed morphologies seen in BCGs [23, 24]. Bekki [24] in particular finds that new stars form close to the gas, presumably with similar kinematics. Our results for new stars in real BCGs are broadly consistent with this.
4.3 Implications for galaxies at higher redshift
In high-redshift galaxies, the velocity dispersion and shear in strong emission lines may be the only kinematic observables (e.g. Erb et al[25]). The relationship between emission-line widths and for example dynamical masses [26] is important to anchor in a low-redshift context with galaxies similar to those we can see at earlier epochs. Kobulnicky & Gebhardt [27] observed a sample of nearby late-type galaxies (including the BCG He 2-10) in H i, Ca ii H and K and [O ii], smearing using telescope drift to estimate each source’s total spectrum, and concluded that nebular emission lines generally agree with the other tracers.
Our data indicate that in BCGs, emission line kinematics are probably no better than a first approximation to the stellar velocity field. Moreover, while the Ca ii triplet traces the stellar population nicely, reliable results require either very high signal-to-noise ratio or resolved regions with small equivalent widths in the competing Paschen emission lines (ages 8 Myr; Fig. 5). At moderate redshifts, this problem will exacerbated by limited spatial resolution and alternative tracers of stellar velocity should be investigated.
References
References
- [1] Giavalisco, M 2002, ARAA 40 579
- [2] Grimes, J P et al 2007, ApJ 668 891
- [3] Bergvall, N, Östlin, G 2002, A&A 390 891
- [4] Östlin, G, Amram, P, Bergvall, N, Masegosa, J, Boulesteix, J, Márquez, I 2001, A&A 374 80
- [5] McKeith, D, Castles, J, Greve, A, Downes, D 1993, A&A 272 98
- [6] Östlin, G, Cumming, R J, et al 2004, A&A 419 L43
- [7] Marquart, T, Fathi, K, Östlin, G, Bergvall, N, Cumming, R J, Amram, P 2007, A&A 474 L9
- [8] Cumming, R J, Fathi, K, Marquart, T, Östlin, G, Bergvall, N, Masegosa, J, Márquez, I, Amram, P 2008, A&A 479 725
- [9] Östlin, G et al 2008, AJ, in press (arXiv:0803.1174)
- [10] Vader, J P, Frogel, J, Terndrup, D M, Heisler, C A 1993, AJ 106 1743
- [11] Cenarro, A J, Cardiel, N, Gorgas, J, Peletier, R F, Vazdekis, A, Prada, F 2001, MNRAS 326 959
- [12] Ho, L, Filippenko, A V 1996, ApJ 466 83
- [13] Ho, L, Filippenko, A V 1996, ApJ 472 600
- [14] Nelson, C H, Whittle, M 1995, ApJS 99 67
- [15] Cappellari, M, Emsellem, E 2004, PASP 116 138
- [16] Leitherer, C et al 1999, ApJS 123 3
- [17] Terlevich, E, Díaz, A, Terlevich, R 1990, MNRAS 242 271
- [18] Mayya, Y D 1997, ApJ 482 149
- [19] Díaz, A I, Terlevich, E, Terlevich, R 1989, MNRAS 239 325
- [20] Vega, L R, Asari, N V, Cid Fernandes, R, Garcia-Rissmann, A, Storchi-Bergmann, T, González Delgado, R M, Schmitt, H 2008, MNRAS, in press (arXiv:0809.3178)
- [21] González Delgado, R M, Leitherer, C 1999, ApJS 125 489
- [22] Östlin, G, Cumming, R J, Bergvall, N, 2007, A&A 461 471
- [23] Jesseit, R, Naab, T, Peletier, R F, Burkert, A 2007, MNRAS 376 997
- [24] Bekki, K 2008, ApJ 680 29
- [25] Erb, D, Steidel, C, Shapley, A E, Pettini, M, Reddy, N A, Adelberger, K 2006, ApJ 646 107
- [26] Pettini, M, et al 2001, ApJ 554 981
- [27] Kobulnicky, H A, Gebhardt, K 2000, AJ 119 1608