The GeV to TeV view of SNR IC443: predictions for Fermi
Abstract
We present a theoretical model that explains the high energy phenomenology of the neighborhood of SNR IC 443, as observed with the Major Atmospheric Gamma Imaging Cherenkov (MAGIC) telescope and the Energetic Gamma-Ray Experiment Telescope (EGRET). We also discuss how the model can be tested with observations by the Fermi Gamma-ray Large Area Space Telescope. We interpret MAGIC J0616+225 as delayed TeV emission of cosmic-rays diffusing from IC 443 and interacting with a known cloud located at a distance of about 20 pc in the foreground of the remnant. This scenario naturally explains the displacement between EGRET and MAGIC sources, their fluxes, and their spectra. Finally, we predict how this context can be observed by Fermi.
Keywords:
SNR (individual IC 443), -rays: observations, -rays: theory:
98.38.Mz,95.55.Ka1 Introduction
Recently, MAGIC presented the results of observations towards SNR IC 443, yielding to the detection of a new source of -rays, J0616+225 (Albert et al. 2007). This source is located at (RA,DEC)=(06h16m43s, +22∘31’48”), with a statistical positional error of 1.5’, and a systematic error of 1’. A simple power law was fitted to the measured spectral points: with quoted errors being statistical. No variability was found along the observation time (over one year). No significant tails nor extended structure was found at the MAGIC angular resolution.
MAGIC J0616+225 is displaced with respect to the position of the non-variable (Torres et al. 2001) EGRET source 3EG J0617+2238 (Hartman et al. 1999). Indeed, the EGRET central position is located directly towards the SNR, whereas the MAGIC source is south of it, close to the 95% CL contour of the EGRET detection. As Albert et al. (2007) showed, the MAGIC source is located at the position of a giant cloud in front of the SNR, it would not be surprising if they are related, which we explore here. The EGRET flux is (51.43.5) ph cm-2 s-1, with a photon spectral index of 2.010.06. Extrapolating the spectrum of the EGRET source into the VHE regime, we would obtain a higher flux and a harder spectrum than which was observed for MAGIC J0616+225, supporting the view that a direct extrapolation of this and other EGRET measurements into the VHE range is not valid (Funk et al. 2008).
Here we present a theoretical model (see Aharonian & Atoyan 1996, also Gabici & Aharonian 2007) explaining the high energy phenomenology of IC 443, making focus in the displacement between EGRET and MAGIC sources. Our interpretation of MAGIC J0616+225 is that it is delayed TeV emission of cosmic-rays (CRs) diffusing from the SNR. Finally, we discuss how the model can be tested with observations with the Fermi Gamma-ray Large Area Telescope.
2 The SNR IC 443 in context of the model
IC 443 is one of the most studied SNR region at all frequencies. It is an asymmetric shell-type SNR with a diameter of 45 arc minutes (e.g., Fesen & Kirshner 1980). Two half shells appear in optical and radio images (e.g, Braun & Strom 1986, Leahy 2004, Lasker et al. 1990). The interaction region, with evidence for multiple dense clumps, is also seen in 2MASS images (e.g. Rho et al. 2001). In radio, IC 443 has a spectral index of 0.36, and a flux density of 160 Jy at 1 GHz (Green 2004). Claussen et al. (1997) reported the presence of maser emission at 1720 MHz at . Recently, Hewitt et al. (2006) confirmed Claussen’s et al. measurements and discovered weaker maser sources in the region of interaction. IC 443 is a prominent X-ray source, observed with Rosat (Asaoka & Aschenbach 1994), ASCA (Keohane 1997), XMM (Bocchino & Bykov 2000, 2001, 2003, Bykov et al. 2005, Troja et al. 2006), and Chandra (Olbert et al. 2001, Gaensler et al. 2006). The works by Troja et al (2006) and Bykov et al. (2008) summarize these observations. In what follows we present some additional features of IC 443, relevant for our model.
Age: IC 443 is agreed to have a middle-age of about yrs. This age has been initially advocated by Lozinkaya (1981) and was later consistently obtained as a result of the SNR evolution model (Chevalier 1999).
Distance: Kinematical distances from optical systemic velocities span from 0.7 to 1.5 kpc (e.g., Lozinskaya 1981). The assumption that the SNR is associated with a nearby HII region, S249, implies a distance of kpc. Several authors claimed that the photometric distance is more reliable (e.g, Rosado et al. 2007), and concurrently with all other works on IC 443, we adopt its distance as 1.5 kpc (thus, 1 arcmin corresponds to 0.44 pc).
Energy of the explosion: There is no clear indicator for , the energy of the explosion in units of erg. Lacking a strong reason for other numerical assumption, we will assume that , although to be conservative, we will subsequently assume that only 5% of this energy is converted into relativistic CRs. Reasonable differences in our assumed value of are not expected to have any impact on this model.
The molecular environment: Cornett et al. (1977) and DeNoyer (1979) were among the first to present detailed observations of molecular lines towards IC 443. Subsequently, Dickman et al. (1992), Seta et al. (1998), Butt et al. (2003) and Torres et al. (2003) among others, presented further analysis. These works conform the current picture for the environment of IC 443: a total mass of M⊙ mainly located in a quiescent cloud in front of the remnant (with linear scales of a few parsecs and densities of a few hundred particles cm-3) that is absorbing optical and X-ray radiation (e.g., Lasker 1990, Troja et al. 2006), a scenario already put forward by Cornett et al. (1977). Dickman et al. (1992) estimated that 500-2000 M⊙ are directly perturbed by the shock in the northern region of interaction, near the SNR itself. Huang et al. (1986) found several clumps of molecular material along this interacting shell, with subparsec linear scales. Rosado et al. (2007) found inhomogeneities down to 0.007 pc. As it is usual, we will neglect these latter inhomogeneities when considering the propagation of CRs in the ISM, i.e. we thus assume an homogeneous medium of typical ISM density where CRs diffuse. Then, the molecular mass scenario is a main giant cloud in front of the SNR containing most of the quiescent molecular material found in the region, and smaller cloud(s) totalizing the remaining mass located closer to the SNR.
3 Diffusion of CRs from IC 443
The spectrum of -rays generated through -decay at a source of proton density is where and Here, is the differential cross-section for the production of -mesons of energy by a proton of energy in a collision. For an study of different parameterizations of this cross section see Domingo-Santamaria & Torres (2005) and Kelner et al. (2006). The limits of integration in the last expression are obtained by kinematic considerations (see e.g., Torres 2004). In these expressions we have implicitly neglected any possible gradient of cosmic-ray density in the cloud as well as in the cloud’s gas number density.
The CR spectrum is given by where is the distribution function of protons at an instant and distance from the source. The distribution function satisfies the radial-temporal-energy dependent diffusion equation (Ginzburg & Syrovatskii 1964): where is the energy loss rate of the particles, is the source function, and is the diffusion coefficient, for which we assume here that it depends only on the particle’s energy. The energy loss rate are due to ionization and nuclear interactions, with the latter dominating over the former for energies larger than 1 GeV. The nuclear loss rate is , with being the timescale for the corresponding nuclear loss, being the inelasticity of the interaction, and being the cross section (Gaisser 1990). Aharonian & Atoyan (1996) presented a solution for the diffusion equation for an arbitrary energy loss term, diffusion coefficient, and impulsive injection spectrum , such that . For the particular case in which and , the general solution is where stands for the radius of the sphere up to which the particles of energy have time to propagate after their injection. In case of continuous injection of accelerated particles, given by , the previous solution needs to be convolved with the function in the time interval . If the source is described by a Heavside function, Atoyan et al. (1995) have found a general solution for the diffusion equation with arbitrary injection spectrum, which with the listed assumptions and for times less than the energy loss time, leads to: We will assume that and make use of these solutions in what follows.
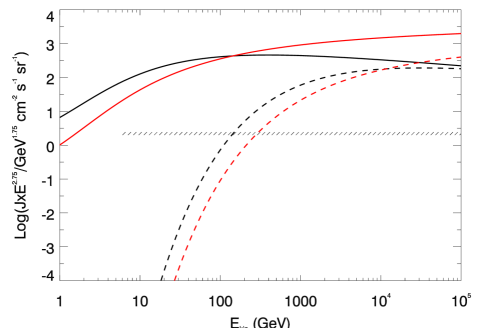
Fig. 1 shows the current CR spectrum generated by IC 443 at two different distances from the accelerator, 10 (solid) and 30 (dashed) pc. The SNR is considered both as a continuous accelerator with a relativistic proton power of erg s-1 (the proton luminosity is such that the energy injected into relativistic CRs through the SNR age is erg), and an impulsive injector with the same total power (injection of high energy particles occur in a much shorter time than the SNR age). The horizontal line in Fig. 1 marks the CR spectrum near Earth, so that the excess of CRs in the SNR environment can be seen. For this example, the diffusion coefficient at 10 GeV, , was chosen as 1026 cm2 s-1, with . CRs propagate through the ISM, assumed to have a typical density. In the scale of Fig. 1, curves for and 10 cm-3 would be superimposed, so that becomes an irrelevant parameter in this range (this stems from the fact that the timescale for nuclear loss obtained with the densities considered for the interestellar medium, , is orders of magnitude larger than the age of the accelerator). Differences between the different kind of accelerators assumed are also minimal for the SNR parameters.
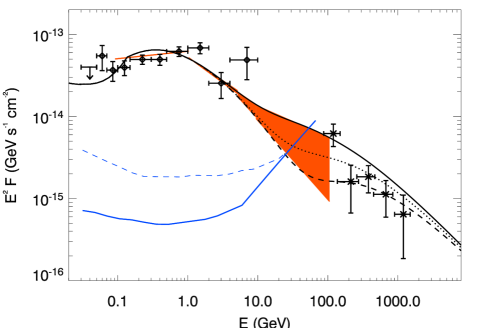
Fig. 2 shows the result for the -ray emission coming from the cloud located at the position of the MAGIC source, when we assume it lies at different distances in front of IC 443. The giant cloud mass is assumed (consistently with observations) as 8000 M⊙. The accelerator properties and power of IC 443 are as in Fig. 1, in each case. Fluxes are given for an ISM propagation in a medium of cm-3, although again we have checked this is not a relevant parameter as discussed above. We find that clouds located from 20 to 30 pc produce an acceptable match to MAGIC data. In the case of a more impulsive accelerator, the VHE predicted spectra is slightly steeper than that produced in the continuous case at the same distance, so that it provides a correspondingly better fit to the MAGIC spectrum. Fig. 2 also shows, apart from MAGIC data, EGRET measurements of the neighborhood of IC 443. We recall that these two sources are not located at the same place, what we emphasize using different symbols. Fig. 2 shows that there is plenty of room for a cloud the size of that detected in front of IC 443 to generate the MAGIC source and not a co-spatial EGRET detection. In the case of Fermi, measurement of this region will allow us to constrain the separation between the SNR and the cloud, since for some distances a Fermi detection is also predicted. The existence of a VHE source without counterpart at lower energies is the result of diffusion of the high-energy CRs from the SNR shock, which is an energy dependent process leading to an increasing deficit of low energy protons the farther is the distance from the accelerator.
To clarify our previous assertion, and since our solution to the diffusion-loss equation is a function of time, we show the evolution of the flux along the age of the SNR. In Fig. 3 we show the integrated photon flux coming from the position of the giant cloud as a function of time above 100 MeV and 100 GeV in the impulsive case. Different qualities of the accelerator (impulsive or continuous) produce a rather comparable picture. At the age of the SNR (the time at which we observe) Fermi should see a source only for the closest separations. On the contrary, the integrated photon fluxes above 100 GeV present minimal deviations, and a MAGIC source is always expected.
![[Uncaptioned image]](/html/0901.2615/assets/x2.png)
![[Uncaptioned image]](/html/0901.2615/assets/x3.png)
MAGIC and EGRET measurement of the neighborhood of IC 443 (stars and squares, respectively) as compared with model predictions. The top (bottom) panel shows the results for an impulsive (continuous) case. At the MAGIC energy range, the top panel curves show the predictions for a cloud of 8000 M⊙ located at 20 (1), 25 (2), and 30 (3) pc, whereas they correspond to 15 (1), 20 (2), 25 (3), and 30 (4) pc in the bottom panel. At the EGRET energy range, the curve shows the prediction for a few hundred M⊙ located at 3–4 pc. The EGRET sensitivity curves (in red) are shown for the whole lifetime of the mission for the Galactic anti-centre (solid), which received the largest exposure time and has a lower level of diffuse -ray emission, and for a typical position in the Inner Galaxy (dashed), more dominated by diffuse -ray background. The Fermi sensitivity curves (in blue) (taken from http://www-glast.slac.stanford.edu/software/IS/glast_latperformance.html) show the 1-year sky-survey sensitivity for the Galactic North pole, again a position with low diffuse emission (solid), and for a typical position in the Inner Galaxy (dashed).
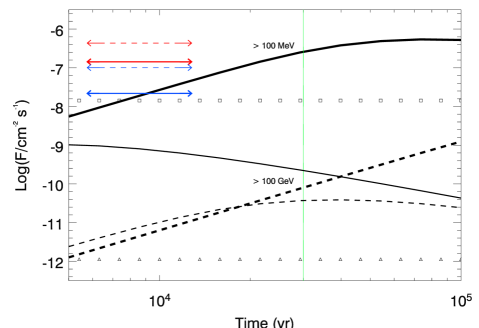
Fig. 2 also presents the results of our theoretical model focusing in the energy range of EGRET. There, the CR spectrum interacting with a local-to-the-SNR cloud is obtained assuming an average distance of interaction of 3–4 pc. A few hundred M⊙ located at this distance (700 M⊙ for the case of an impulsive, and 300 M⊙ for a continuous case) produce an excellent match to the EGRET data, without generating a co-spatial MAGIC source. Concurrently with, e.g., Gaiser et al. (1999), we find that the lowest energy data points in the EGRET range are produced by bremsstrahlung of accelerated electrons, curves that for simplicity we do not show in Fig. 2.
As spinoff of the constraints provided by the observed phenomenology (e.g., the molecular environment and the position of the -ray sources) in the setting of this model, we find that should be low, of the order of 1026 cm2 s-1. By varying the diffusion coefficient and studying its influence in our results, we obtain that if the separation between the giant cloud and the SNR is 10 pc, an slower diffusion would not allow sufficient high energy particles to reach the target material; thus, the MAGIC source would not be there. On the other hand, if the separation between the main cloud and the SNR is 10 pc, we would have detected an EGRET source at the position of the cloud, which is not the case. We then grasp the value of at 1.5 kpc from Earth, combining MAGIC and EGRET observations. Such values of are expected in dense regions of ISM such as the one we study (Ormes et al. 1988, Gabici & Aharonian 2007).
4 Predictions for Fermi
The sensitivity of Fermi allows the observation of the previous scenario, but this observation also depends on the spatial resolution of the different clouds. Fig. 4 shows the predicted energy spectrum for the two cloud systems when Fermi is not able to resolve them independently. The final spectrum is the result of the addition of the two spectra in Fig. 3. The figure also depicts the best fit of the model to a power law. Table 1. shows the different spectral index for the different energy bands.
At high energies, we should see a morphological and a spectral change from the position of the cloud (i.e. the center of MAGIC J0616+225) towards the center of IC 443. At a morphological level, the lower the energy, the more coincident with the SNR the radiation will be detected. At a spectral level: sufficient statistics should show that the lower the -ray energy the harder the spectrum is. Fermi observations may also be sensitive enough to detect the same cloud that shines at higher energy, which ultimately will allow to determine its separation from the remnant, if the diffusion coefficient is assumed –as we showed–, or viceversa.
| E 1 | E 5 | E 10 | E 100 | |
| Spectral index | -1.91 0.01 | -2.60 0.03 | -2.77 0.18 | -2.66 0.29 |
5 Concluding remarks
Here we have shown that MAGIC J0616+225 is consistent with the interpretation of CR interactions with a giant molecular cloud lying in front of the remnant, producing no counterpart at lower energies. We have also shown that the nearby EGRET source can be produced by the same accelerator, and that in this case, a co-spatial MAGIC source is not expected. In our model, the displacement between EGRET and MAGIC sources has a physical origin. It is generated by the different properties of the proton spectrum at different locations, in turn produced by the diffusion of CRs from the accelerator (IC 443) to the target. Specific predictions for future observations can be made as a result of this model as we have shown for the Fermi case.
References
- (1) Aharonian F. A., & Atoyan A.M. 1996, A&A 309, 91
- (2) Albert J. et al. 2007, ApJ 664, L87
- (3) Atoyan A. M., Aharonian F. A., & Völk H. J. 1995, Phys. Rev. D52, 3265
- (4) Asaoka I. & Aschenbach B., 1994, A&A 284, 573
- (5) Bocchino F. & Bykov A. M. 2000, A&A 362, L29
- (6) Bocchino F. & Bykov, A. M. 2001, A&A 376, 248
- (7) Bocchino F. & Bykov, A. M. 2003, A&A 400, 203
- (8) Braun R. & Strom R. J. 1986, A&A, 164, 193
- (9) Butt Y. M. et al. 2003, XXII Moriond Astro. Mtg, p. 323, astro-ph/0206132
- (10) Bykov A. M., Bocchino F. & Pavlov G. G. 2005, ApJ 624, L41
- (11) Bykov A. M. et al. 2008, to appear in ApJ, arXiv:0801.1255
- (12) Chevalier R. A. 1999, ApJ 511, 798
- (13) Claussen M. J. et al. 1997, ApJ 489, 143
- (14) Cornett R. H., Chin G. & Knapp G. R., 1977, A&A 54, 889
- (15) DeNoyer L.K. 1979, ApJ 232, L165
- (16) Dickman R. L., Snell R. L., Ziurys L. M., & Huang Y.-L. 1992, ApJ 400, 203
- (17) Domingo-Santamaría E. & Torres D. F. 2005, A&A 444, 403
- (18) Fesen R. A. & Kirshner R. P. 1980, ApJ 242, 1023
- (19) Funk S., Reimer O., Torres D. F. & Hinton J. A. 2008, to appear in ApJ, arXiv:0710.1584
- (20) Gabici S. & Aharonian F. A. 2007, ApJ 665, L131
- (21) Gaensler B. M. et al. 2006, ApJ, 648, 1037
- (22) Gaisser T. K. 1990, Cosmic Rays and Particle Physics, Cambridge University Press, Cambridge, UK
- (23) Ginzburg V. L., Syrovatskii S. I. 1964, “The Origin of Cosmic Rays”, Pergamon Press, London
- (24) Green D. A. 2004, BASI, 32, 335G
- (25) Hartman R. C. et al. 1999, ApJS, 123, 79
- (26) Hewitt J. W. et al. 2006, ApJ, 652, 1288
- (27) Huang Y.-L., Dickman R. L., & Snell R. L. 1986, ApJ 302, L63
- (28) Kelner S. R., Aharonian F. A. & Bugayov V. V. 2006, Phys. Rev. D74, 034018
- (29) Keohane J. W. et al, 1997, ApJ 484, 350
- (30) Lasker B. M. et al. 1990, AJ, 99, 2019
- (31) Leahy D. A. 2004, AJ 127, 2277
- (32) Lozinskaya T. A. 1981, Soviet Astron. Lett., 7, 17
- (33) Olbert Ch. M. et al. 2001, ApJ 554, L205
- (34) Ormes J. F., Ozel M. E. & Morris D. J. 1988, ApJ 334, 722
- (35) Rho J., Jarrett T. H., Cutri R. M. & Reach W. T. 2001, ApJ 547, 885
- (36) Rosado M., Arias L. & Ambrocio-Cruz P. 2007, ApJ 133, 89
- (37) Seta M., et al. 1998, ApJ, 505, 286
- (38) Torres D. F., Pessah M. E. & Romero G. E. 2001, Astron. Nachr. 322, 223
- (39) Torres D. F. et al. 2003, Phys. Rept., 382, 303.
- (40) Torres D. F. 2004, ApJ 617, 966
- (41) Troja E., Bocchino F. & Reale F., 2006, ApJ, 649, 258