Stellar mass dependent disk dispersal
Abstract
We use published optical spectral and IR excess data from nine young clusters and associations to study the stellar mass dependent dispersal of circumstellar disks. All clusters older than 3 Myr show a decrease in disk fraction with increasing stellar mass for Solar to higher mass stars. This result is significant at about the 1 level in each cluster. For the complete set of clusters we reject the null hypothesis—that Solar and intermediate-mass stars lose their disks at the same rate—with 95–99.9% confidence. To interpret this behaviour, we investigate the impact of grain growth, binary companions, and photoevaporation on the evolution of disk signatures. Changes in grain growth timescales at fixed disk temperature may explain why early-type stars with IR excesses appear to evolve faster than their later-type counterparts. Little evidence that binary companions affect disk evolution suggests that photoevaporation is the more likely mechanism for disk dispersal. A simple photoevaporation model provides a good fit to the observed disk fractions for Solar and intermediate-mass stars. Although the current mass-dependent disk dispersal signal is not strong, larger and more complete samples of clusters with ages of 3–5 Myr can improve the significance and provide better tests of theoretical models. In addition, the orbits of extra-Solar planets can constrain models of disk dispersal and migration. We suggest that the signature of stellar mass dependent disk dispersal due to photoevaporation may be present in the orbits of observed extra Solar planets. Planets orbiting hosts more massive than 1.6 may have larger orbits because the disks in which they formed were dispersed before they could migrate.
Subject headings:
stars: pre-main sequence—stars: formation—planetary systems: formation—planetary systems: protoplanetary disks1. Introduction
Most known extra-Solar planets orbit roughly Solar-mass stars; the result of observational biases towards these stars in planet hunting surveys. Recently, planets orbiting both low and intermediate mass stars have been discovered (e.g. Rivera et al., 2005; Johnson et al., 2007b), thus increasing the diversity of planet host stars. In parallel, there have been various models proposed that attempt to explain and predict the frequency and properties of these planets as a function of stellar mass (Ida & Lin, 2005; Kornet et al., 2006; Burkert & Ida, 2007; Kennedy & Kenyon, 2008b).
These models need observational constraints, which are provided in two ways. The observed properties of the planets yields one set of constraints, setting the final distributions that models must reproduce. These distributions contain trends such as an increasing planet frequency with increasing stellar metallicity (Fischer & Valenti, 2005). However, because planets are observed around main-sequence stars, these constraints provide no direct information about the circumstellar environment during the 1-100 Myr epoch of planet formation.
Planets form in circumstellar disks, and observations of these disks yield another set of constraints. These constraints are used as model parameters. For example, disks are made up of gas and dust and in many cases have enough material to form planetary systems with planets as massive as those in our Solar System (e.g. Natta et al., 2000; Andrews & Williams, 2005). Of these constraints, the strongest is the observed disk lifetime. The disk dispersal timescale sets the time taken for dust to grow into Earth-mass objects and accrete gas to form giant planets.
The timescale for disk dispersal is inferred from dust and/or gas signatures. The fraction of stars with disks in clusters of roughly coeval young stars decreases with increasing age, yielding the typical lifetime of circumstellar disks. The disk lifetime is usually derived from the dust signature (e.g. Haisch et al., 2001), with the assumption that the gaseous component follows the same evolution. This assumption is probably well founded, based on a general agreement between dust and accretion signatures (e.g. Kenyon & Hartmann, 1995; Lada et al., 2006).
For gas giant formation, the disk lifetime is the strongest observational constraint. Therefore, any stellar mass dependence on disk lifetime should be included in planet formation models. Burkert & Ida (2007) show this dependence is important, using it to reproduce a “valley” in the period distribution of planets orbiting stars 1.2 .
With new discoveries of planets orbiting M-dwarfs and K-(sub)giants, further trends with stellar mass are emerging. The frequency of giant planets appears to increase with stellar mass (Butler et al., 2006; Johnson et al., 2007a). Also, all planets around stars with masses 1.6 have larger (1 AU) orbits than Solar-mass stars (Johnson et al., 2007b; Sato et al., 2008a, b). As with the valley described by Burkert & Ida (2007), the larger orbits may be caused by changing disk dispersal timescale with stellar mass.
Recent Spitzer surveys of young clusters have started to reveal observational evidence of stellar mass dependent disk dispersal: stars with spectral types earlier than about mid-K appear to lose dust signatures earlier than their lower mass counterparts (Carpenter et al., 2006; Currie et al., 2007; Hernández et al., 2007; Dahm & Hillenbrand, 2007). This effect has also recently been demonstrated with higher mass Herbig Ae/Be objects in a number of OB associations (Hernández et al., 2005) after its initial discovery in 1993 (Hillenbrand et al., 1993). Thus, there may be observational evidence for the stellar mass dependent disk dispersal used in the Burkert & Ida (2007) models.
In this paper, we look for evidence of mass dependent disk dispersal and its evolution using H equivalent widths (EW[H]) and infra-red (IR) excesses in nine 1–10 Myr old clusters and regions. We also compare the disk lifetime inferred from the two signatures, which probe the different components of circumstellar disks. We find that disks around higher mass stars tend to disperse earlier than those around Solar mass stars for all clusters older than 3 Myr. Using all cluster data, we reject the null hypothesis—that disk dispersal is independent of stellar mass—with 95–99.9% confidence. The statistical significance of any mass dependence for individual clusters is not strong, at around the 1 level. Using a photoevaporation model, we show why the signal may be intrinsically weak. We suggest where future observations can make the most progress towards making our result more significant. Finally, we return to our motivation and study some possible effects that stellar mass dependent disk dispersal may have on giant planet formation. We suggest that mass dependent disk dispersal may have an observational signature in the semi-major axes of discovered planets.
2. Background
Nearly all stars begin their lives with circumstellar disks of gas and dust (e.g. Lada et al., 2000). The disks have typical radii of 10-1000 AU (e.g. McCaughrean & O’dell, 1996) and masses 0.01–0.1 (e.g. Natta et al., 2000; Andrews & Williams, 2005). Assuming the typical interstellar gas/solids ratio of 100, many disks have material sufficient to build planetary systems like our Solar System.
Observational probes of disk structure are very sensitive to physical conditions within the disk (e.g. Najita et al., 2007). The disk temperature decreases with distance from the central star, ranging from to K close to the star, to 10–50 K at larger distances.
At large (10-100 AU) distances, beyond where planets form, cool gas and dust can be detected through IR and mm observations. Direct detection of the main gaseous component, H2, is difficult, so gas disks are inferred from molecular components such as CO. At all radii, dust is generally inferred from thermal emission, where detection at longer wavelengths corresponds to cooler dust at greater distances. For outer disks, the relevant wavelength for dust emission is in (sub)mm bands.
For inner disks (10 AU), where planets probably form, temperatures and densities are much higher. Direct detection of H2 is still difficult. Gas is usually inferred from evidence of accretion onto the central star. The most commonly used (and easiest to measure) accretion signatures are greater than expected UV flux or EW[H]. These signatures are caused by shocking/heating of the gas as it accretes onto the star (e.g. Calvet & Gullbring, 1998; Muzerolle et al., 2001).
The dusty component of the inner disk is detected by an excess of IR emission above the expected photospheric level at wavelengths beyond 2-3 m. The IR excess is commonly characterised by colour-colour diagrams, where disks are inferred for objects with redder than photospheric colours. Alternatively, the shapes of spectral energy distributions (SEDs) may be used, where disks are inferred for objects with greater than photospheric SEDs.
Generally, dust and gas signatures agree for young stars; the presence (absence) of one usually predicts the presence (absence) of the other. Models suggest that although grains may settle and grow beyond visible sizes, turbulence and fragmentation ensure the presence of small grains that remain well mixed with the gas (Dullemond & Dominik, 2005; Johansen et al., 2008). Therefore, though disk lifetimes are commonly inferred from dust signatures, there is observational and theoretical evidence that this method is valid.
There are, however, examples of objects where gas and dust signatures disagree. Many main-sequence stars show weak mid and far-IR excesses, but no sign of circumstellar gas. These “debris disks” are a separate class of objects, thought to arise from collisions in remaining planetesimal belts (e.g. Kenyon & Bromley, 2004). Around 10% of stars in young clusters have little or no excess in the near-IR, but retain large excesses in mid-IR bands (e.g. Sicilia-Aguilar et al., 2006b; Lada et al., 2006). These objects, which also have weak or non-existent accretion signatures, are though to be currently in “transition” between the primordial and debris disk states, with an inner hole as the disk starts to clear.
Early studies of disk populations in young clusters found a disk dispersal timescale of 4–5 Myr (Haisch et al., 2001; Mamajek et al., 2004). These studies find somewhat longer disk lifetimes at longer wavelengths (i.e. greater distances). This result is unsurprising in the context of grain growth, because the growth timescale is proportional to the orbital period. Recent Spitzer surveys have confirmed these timescales with larger stellar samples.
Increased sample numbers have also allowed the study of how disk lifetime depends on stellar mass. Studies generally find that the fraction of stars with disks at a given age changes with the mass of the host star (Hernández et al., 2005; Carpenter et al., 2006; Lada et al., 2006; Hernández et al., 2007; Dahm & Hillenbrand, 2007; Luhman et al., 2008). While nearly all studies find evidence that higher mass stars lose their disks earlier than Solar mass stars, these results are not statistically compelling. In addition, Carpenter et al. (2006) and Currie (2008) find that of objects with IR excesses, earlier-type stars appear to be in a more evolved state, with smaller IR excesses relative to the stellar photosphere.
Differences in disk evolution with stellar mass are theoretically expected. For different stars, observations at fixed wavelength probe different parts of a circumstellar disk. Because the disk temperature decreases with distance from the star, thermal emission at longer wavelengths probes greater distances. For higher stellar luminosities, regions of fixed temperature (and wavelength) are at greater distances. Evolutionary timescales such as grain growth depend on properties such as orbital frequency and gas density, which decrease with radial distance from the star. Thus, the same wavelength will not necessarily find a disk in the same evolutionary state for different stars.
Aside from regions probed by wavebands, more obvious processes exist that may change the rate of disk evolution with stellar mass. Disks may experience accelerated photoevaporation due to massive stars in the local environment (e.g. Scally & Clarke, 2001; Adams et al., 2004; Balog et al., 2006) or the increased high energy flux of higher mass host stars (Burkert & Ida, 2007). The effects of the local environment are most important for low-mass stars. Adams et al. (2004) find that disks around these stars may be evaporated down to the AU scales where planets form, particularly in OB associations. The conditions for external photoevaporation are different for every star in every cluster and thus may make the presence of global trends for low-mass stars less likely. In the case of photoevaporation by the host star, the expected evolution should result in higher mass stars dispersing their disks earlier, leading to differences in disk fractions for different mass stars at fixed age. Transition objects can also be understood in terms of a photoevaporation model, where viscous evolution and ionising photons from the central star combine to remove the disk in an inside–out manner (e.g. Clarke et al., 2001).
To study how disk dispersal depends on stellar mass, we compile a sample of clusters from the literature in §3. To derive disk fractions, we use IR excesses and EW[H]. Though these signatures generally agree, we use both to look for any systematic changes with cluster age. We first compare the results for overall cluster fractions, comment on possible effects of stellar multiplicity in §3.1 and study the stellar mass and spectral type dependence in §3.2. Comparing Solar and intermediate-mass stars, we find evidence for a stellar mass dependence; at about the 2 level overall and about 1 for individual clusters.
In §4, we consider different physical mechanisms that may cause the mass dependence. We first consider grain growth in different wavebands. Then, using a simple photoevaporation model we suggest why the mass dependence has low statistical significance. We argue that an alternative hypothesis, the increasing multiplicity fraction with stellar mass, is an unlikely cause for mass dependent disk dispersal.
Finally, we return to the initial motivation for studying disk evolution and consider some consequences of our results for giant planet formation in §5. We suggest that there may be a signature of stellar mass dependent disk dispersal in the observed orbits of extra-Solar planets. If the disk dispersal timescale decreases with increasing stellar mass and the migration timescale is constant or increases, then above some stellar mass planets will not have time to migrate before the disk disperses. This effect may cause the observed outward step in giant planet orbits to 1 AU above 1.6 .
3. Cluster data
We select nine well studied clusters and regions from the literature. To cover a range of disk fractions, our aim is to have clusters with EW[H] from optical spectra, 3.6–8 m photometry from the Spitzer Infra-Red Array Camera (IRAC), and ages spaced in log time between 1–10 Myr. Because we want a reasonable number of stars over a wide stellar mass range, many of our clusters are part of OB associations.
The clusters are: Taurus (Luhman et al., 2006; Furlan et al., 2006), Chamaeleon I (Luhman, 2004; Luhman et al., 2008), IC 348 (Luhman et al., 2003; Lada et al., 2006), Tr 37 (Sicilia-Aguilar et al., 2004, 2005, 2006a, 2006a), Upper Scorpius (Preibisch et al., 1998; Preibisch & Zinnecker, 1999; Preibisch et al., 2002; Walter et al., 1994; Carpenter et al., 2006), NGC 2362 (Dahm & Hillenbrand, 2007), Orion OB1bc, and OB1a/25Ori (OB1b and OB1c members combined, and OB1a including 25 Ori objects, Briceño et al., 2005; Hernández et al., 2005; Briceño et al., 2007; Hernández et al., 2007), and NGC 7160 (Sicilia-Aguilar et al., 2004, 2005, 2006b). These clusters populate the 1–10 Myr age range fairly well when viewed logarithmically. There is a gap between 2–4 Myr, which is nicely occupied by NGC 2264 (Rebull et al., 2002) and NGC 6611. Though some data are available (Young et al., 2006), the bulk of Spitzer IRAC photometry for NGC 2264 are unpublished. With a similar age, the more distant (1800 pc) cluster NGC 6611 shows an increasing disk fraction with decreasing stellar mass based on near-IR observations (Hillenbrand et al., 1993; Oliveira et al., 2005).
These surveys are largely unbiased in terms of disk charateristics, and/or complete for the range of stars we consider. The lack of bias mainly results from the requirement that objects have spectral types to be included in our analysis. The Taurus sample is largely based on that compiled by Kenyon & Hartmann (1995), using IR and spectroscopic data with no known biases (Kenyon et al., 1998; Luhman et al., 2006). The current Cha I sample is thought to be complete to 0.01 (Luhman, 2007), well below masses we consider. However, objects with measured EW[H] may be biased due to the wide range of techniques used to classify objects known when the EW[H] measurements were made (Luhman, 2004). The IC 348 sample is thought to be 100% complete to 0.03 (Luhman et al., 2003). The Orion, Tr 37, and NGC 7160 samples are based on variability and thus unbiased in terms of disk signatures (Briceño et al., 2001). The Upper Sco sample has been compiled to ensure an unbiased sample (Preibisch et al., 2001). The NGC 2362 is the only questionable cluster we use, thought to be complete to 0.5 . The sample has been compiled using a number of methods, including an H survey (Dahm, 2005), which may bias the results in favour of stars with disks for the lowest-mass stars. Any bias is probably minimal, as disk fractions from both accretion and dust signatures are found to be similar to the other 5 Myr old regions, Upper Sco and Orion OB1bc (Dahm & Hillenbrand, 2007, this paper).

To distinguish between stars with and without disks, we use two standard measures: EW[H] and IR excesses. When high resolution data are available, we use the spectral type independent criterion of 10% H width km s-1 to distinguish accreting (CTTS) and non-accreting (WTTS) stars. For the more common low resolution spectra, we use the spectral-type dependent accretion criterion of White & Basri (2003), which accounts for different chromospheric levels of H for different spectral types. Sicilia-Aguilar et al. (2006b) find good agreement between EW[H] derived from high and low resolution spectra with Tr 37, but note that low resolution spectra may become less reliable for older clusters as accretion rates drop. We add a lower threshold of EW[H] for early-type stars G9 (theirs is EW[H] for all stars K6), an approximate effective temperature where main-sequence dwarfs start to show H in absorption (e.g. Castelli & Kurucz, 2003; Hernández et al., 2005). The few early-type accreting objects tend to have relatively large EW[H] so our results are not sensitive to the criterion for G9 stars. We refer to objects with excess EW[H] as accretors. The disk fraction thus derived is the “accretion fraction.”
To provide a measure of the IR excess from a dust disk, we use the slope of the SED, defined by (e.g. Adams et al., 1987; Lada et al., 2006). Most young stars have relatively shallow or flat SEDs () that are easily distinguished from the steep SEDs of the typical stellar photosphere (). Thus, the slope of the SED is a simple way to distinguish stars from disks. To take advantage of the large spatial coverage of most Spitzer surveys, we use IRAC data to derive for stars with data in all four bands ([3.6], [4.5], [5.8], and [8]). Magnitudes are dereddened using the relation derived by Indebetouw et al. (2005). For Upper Sco, we use the slope between [4.5] and [8] from Carpenter et al. (2006), which generally agrees with their 8 m disk classification. For intermediate-mass HIP objects in Orion OB1bc, we use the JHK disk classification from Hernández et al. (2005).

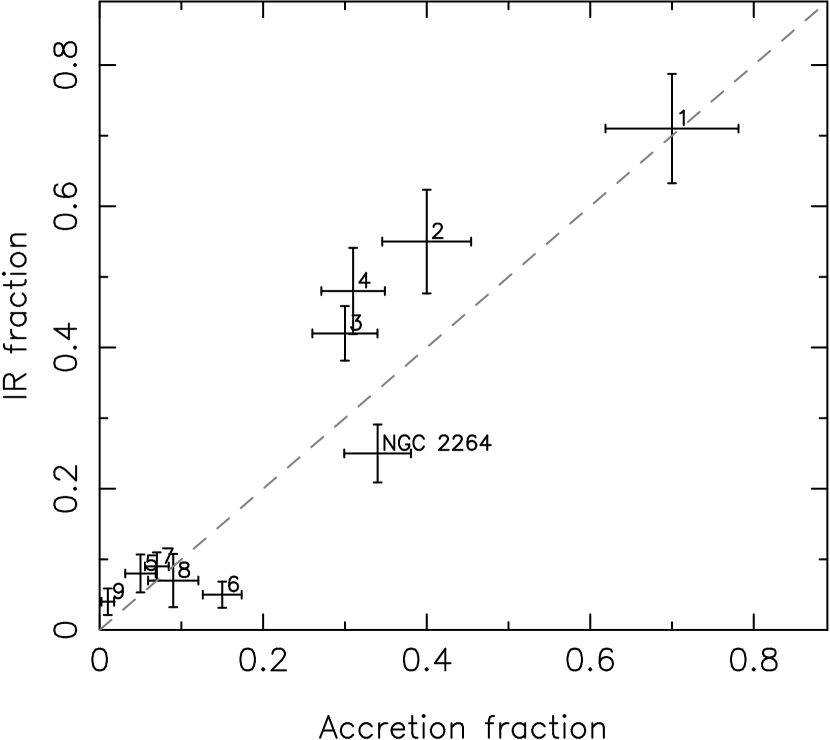
Figure 1 shows dereddened IRAC SED slopes for our cluster sample. There is a clear divide between objects with and without disks for the youngest clusters, Taurus and Cha I. The separation between objects with and without disks is least clear for IC 348: the IR fraction varies between 30% for , to 57% for . This variation results from a decreasing median SED slope with cluster age and/or the presence of transition objects (see below), which make the divide less clear for older clusters (e.g. Hernández et al., 2007). For a brief discussion of the limitations of using the SED slope, see Dahm & Hillenbrand (2007).
Based on Figure 1, we choose to distinguish between stars with and without disks. Our results do not vary significantly for reasonable range (). We do not distinguish between stars with “weak” or “anemic” disks (e.g. Lada et al., 2006) and those with photospheric SED slopes. The disk fractions thus derived are termed “IR fractions.”
Requiring a star to have both accretion and dust indicators ensures a robust classification of objects with primordial disks. However, this constraint precludes any check on whether the dusty and gaseous components evolve together and reduces our sample numbers considerably. Thus, we consider accretion and IR indicators individually and compare the results to those for disks with both signatures.
Before analysing the cluster data in detail, we first consider overall disk fractions for each cluster. To provide data at 3 Myr, we include results from NGC 2264 for this figure only. The IR fraction for this cluster is derived from the I-K colour (Rebull et al., 2002). Though the I-K disk indicator is at shorter wavelengths, it gives a rough estimate of the disk fraction that we expect from Spitzer IRAC data.
Figure 2 shows disk fractions derived from the overall cluster data. Disk fractions decay from 70% at 1 Myr to 5–10% by 5–10 Myr. Tr 37 has a relatively high IR fraction (50%) for its age; however, this fraction is not unreasonably high given the scatter observed for other clusters. Though the systematic uncertainty in ages is a few Myr, ranking the clusters by their disk fractions yields nearly the same order as ranking the clusters by their ages. Clusters lose most of their disks in 5 Myr, with a small fraction or stars retaining disks to 10 Myr. Disk fractions from IR excesses and EW[H] generally agree (right panel of Fig. 2), showing that decay timescales for the gaseous and dusty components are similar.
3.1. Binary and Multiple Systems
The disks of stars in binary systems evolve differently from those around single stars. A companion star truncates the circumstellar disk, shortening the disk lifetime. The extent to which the disk is truncated depends on the separation and mass ratio (e.g. Papaloizou & Pringle, 1977; Armitage et al., 1999). Circumbinary disks may also be present. Therefore, the extent to which a binary companion dominates disk evolution is set by the parameters of each individual system.
Given the natural range of mass ratios and separations, disk dispersal in binary systems is complex. As a further complication, the occurrence of binaries is a function of the mass of the primary (e.g. Lada, 2006). Thus, for some fixed separation distribution, disks may disperse earlier on average for higher mass stars, depending on the prevalence of circumbinary disks for the closest systems. If enough systems have close orbits and the change in binary fraction with stellar mass is strong enough, this process may cause an observable difference in disk fractions over a range of stellar masses.
To look at the effects of companions, we construct two subsamples of objects with “known” multiplicity. The first consists of the Furlan et al. (2006) Taurus sample, for which we compare multiple systems with the balance of objects. Multiplicity in Upper Sco has also been well studied (e.g. Levato et al., 1987; Shatsky & Tokovinin, 2002; Kouwenhoven et al., 2005, 2007a). We collect binary and multiple objects observed and compiled by Kouwenhoven et al. (2007b), objects flagged as X, O, or G in the Hipparcos catalogue (see Kouwenhoven et al., 2007b), and objects from the Catalog of Components of Double & Multiple stars (CCDM) (Dommanget & Nys, 2002).111Vizier catalogs: Hipparcos I/239/hip_main; CCDM I/274/ccdm We then compare the disk fraction of systems to all other Upper Sco objects with Hipparcos identifiers. Due to the aforementioned bias, the real multiplicity fraction in both associations is almost certainly larger than observed. For higher mass stars, such as the BA-type Hipparcos stars in Upper Sco, the multiplicity fraction may be near unity (Kouwenhoven et al., 2007b). There are too few objects to make any useful comparison of the effect of different companion separations.
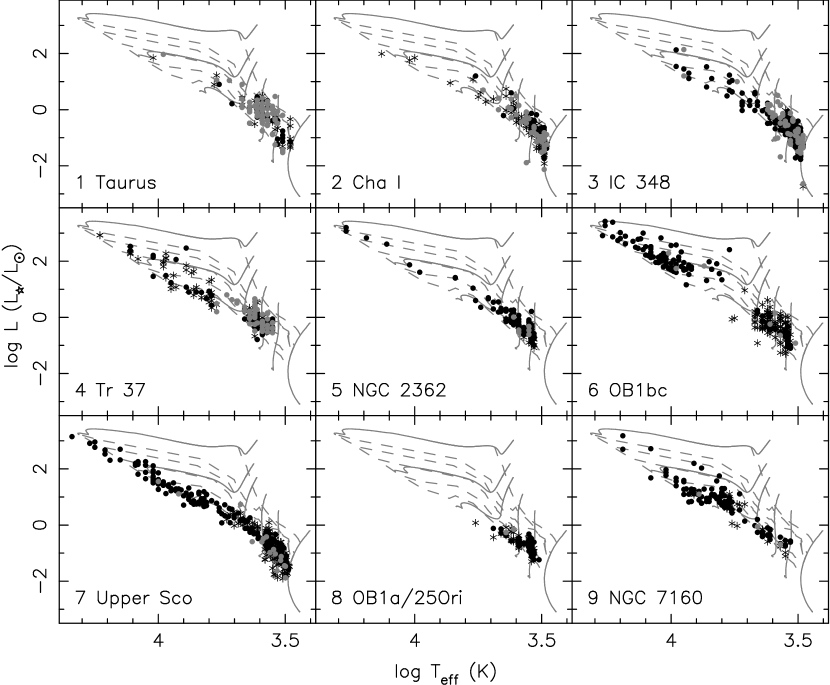
Table 1 shows the disk fractions of single and binary objects for our two samples. For both Taurus and Upper Sco there is no apparent difference in disk fractions between single and multiple stars. In other samples, binaries with separations 20 AU appear to have little impact on disk lifetime and evolution (e.g. Monin et al., 2007; Pascucci et al., 2008). Thus, we conclude that binaries do not impact our derived disk fractions.
Exploring the possible impact of multiplicity on disk evolution merits further study. Samples with a large range in separation and primary mass are needed to study the possible implications for stellar mass dependent disk dispersal. However, based on the results of Table 1 and other observational studies (Furlan et al., 2006; Monin et al., 2007; Pascucci et al., 2008), we do not exclude known multiple systems from our sample.
3.2. Stellar mass dependence
We now use our clusters to look for stellar mass dependent disk dispersal. In each cluster we split stars into bins defined by spectral type and stellar mass and examine the resulting disk fractions. We first qualitatively study the data and find that some stellar mass dependence appears for Solar and intermediate-mass stars. We then focus on these stars and quantify the significance of the dependence in several independent ways.
To obtain the additional information required to analyse each object in our database, we obtain spectral types and extra photometry from Simbad222http://simbad.u-strasbg.fr/simbad/ and Vizier.333http://webviz.u-strasbg.fr/viz-bin/VizieR Where needed, we calculate extinction using the dwarf colours of Kenyon & Hartmann (1995) and conversions from Bessell & Brett (1988) and Cardelli et al. (1989). We exclude objects with no spectral type. For all possible stars, we derive effective temperatures from the spectral type (Kenyon & Hartmann, 1995) and luminosity using dereddened J or I magnitudes.
We begin by showing HR diagrams for the stars in our clusters in Figure 3. For most clusters, stars appear reasonably evenly distributed in mass. Orion OB1bc is a notable exception: the CIDA variability study of Orion (Briceño et al., 2005) was limited to lower mass stars, apparently due to CCD saturation for brighter objects. There is a marked gap between these objects and the higher mass Hipparcos objects studied by Hernández et al. (2005). Many of the higher mass stars in the Dahm & Hillenbrand (2007) NGC 2362 sample lack spectral types. Some deficiency of G-type objects is also expected due to stellar evolution, when Solar-mass stars develop a radiative core and move to the main-sequence at roughly constant luminosity.
Figure 3 also identifies stars with IR excesses (grey dots). The decline in overall disk fraction with cluster age can be seen in the change from mostly grey to nearly all black (no disk) data points. For the youngest clusters, stars with and without disks appear evenly distributed. For older clusters, however, stars with disks have a marked spatial dependence on where stars lose their disk. Although many low mass stars in Tr 37 have disks, there are no stars with (or ) with disks. Other clusters have a similar, but less obvious, lack of disk signatures among more massive stars.
To quantify how the disk fraction changes with stellar mass or spectral type, we bin the data. Some previous studies bin objects by their spectral type (e.g. Carpenter et al., 2006; Hernández et al., 2007). However, for the wide range of stellar masses we consider, pre–main-sequence (PMS) tracks have different loci in the HR diagram. Convective low mass stars follow vertical Hayashi tracks at constant . As they develop a radiative core, intermediate mass stars increase in at nearly constant luminosity. Thus, binning by spectral type is roughly a mass bin for low mass stars and an age bin for intermediate mass stars. The opposite is true for binning by luminosity. If a cluster contains stars with an apparent range of ages, earlier spectral types contain systematically older stars for a given stellar mass. This bias may result in an artificially high difference in disk fractions between bins.
3.2.1 Binned Data: Qualitative results
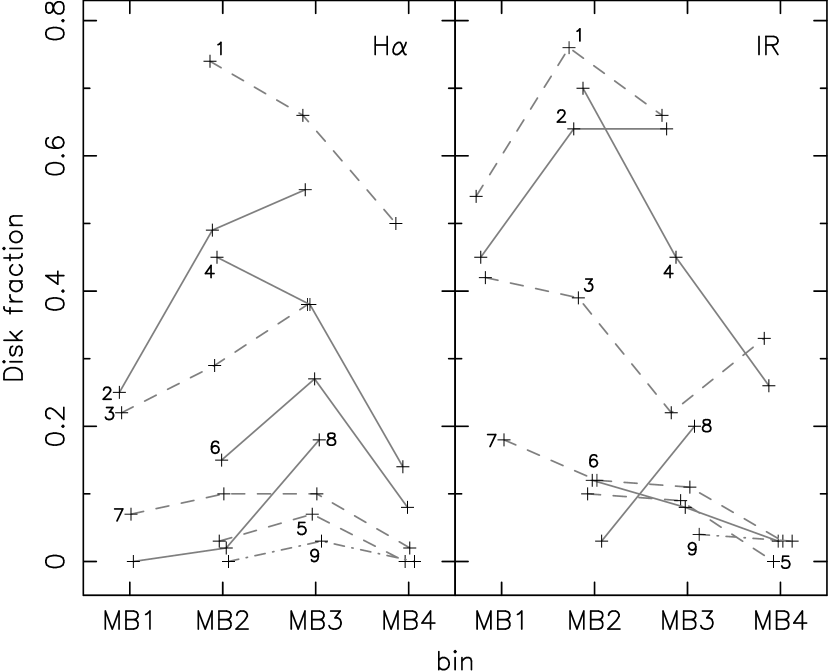
We bin our clusters by spectral type (M, K, FG, and BA) and by mass (0.1–0.3, 0.3–0.6, 0.6–1.5, and 1.5–7 ) using the Siess et al. (2000) PMS tracks. We name the mass bins MB1, MB2, MB3, and MB4 respectively. Objects lying slightly below the main sequence are included in the nearest mass bins by eye (e.g. Upper Sco intermediate mass stars). Bins MB1 and MB2 correspond well to M-type stars of all ages. As noted above, stellar evolution means that the correspondence for MB3 and MB4 changes with age. For young clusters, MB3 corresponds to K-type stars and MB4 to BAFG-types. By 10 Myr, MB3 contains GK-types and MB4 BAF-types.
The results of binning stars by mass and spectral type are summarised in Tables 2 and 3. Also shown are assumed ages and distances. Percentages next to each mass bin label in Table 3 show the fraction of stars expected for a standard IMF (Kroupa, 2001). The lowest mass and spectral type bins are incompletely covered for some clusters (Fig. 3), though this should not affect disk fractions. Though different PMS models differ significantly, our results do not differ much with other tracks (e.g. Palla & Stahler, 1999), because they have the same general form (i.e. stellar mass increases with and/or and we are free to choose any mass binning).
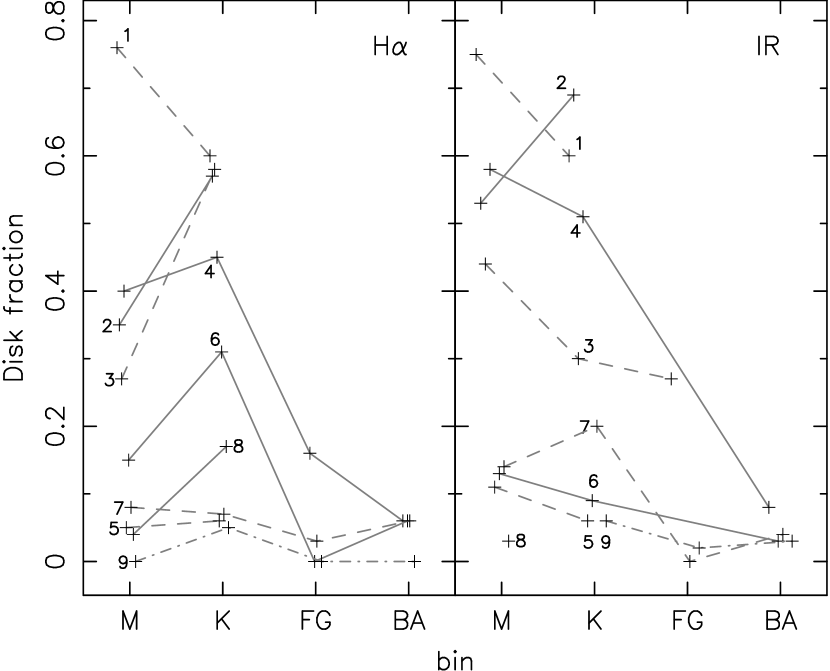
Figure 4 shows accretion and IR fractions for our chosen bins. The binned data show a systematic decrease in disk fraction with increasing stellar mass and spectral type. Both accretion and IR fractions decrease from the K/MB3 to FG-BA/MB4 bins, for all clusters older than 2 Myr old IC 348.
If the decrease in disk fraction with increasing stellar mass were only present in EW[H] measurements, it might be attributed to a detection bias against early-type stars, where excess H is harder to detect in low resolution spectra. However, it is present in both the accretion and IR fractions, and based on the general agreement between the two signatures is probably real.
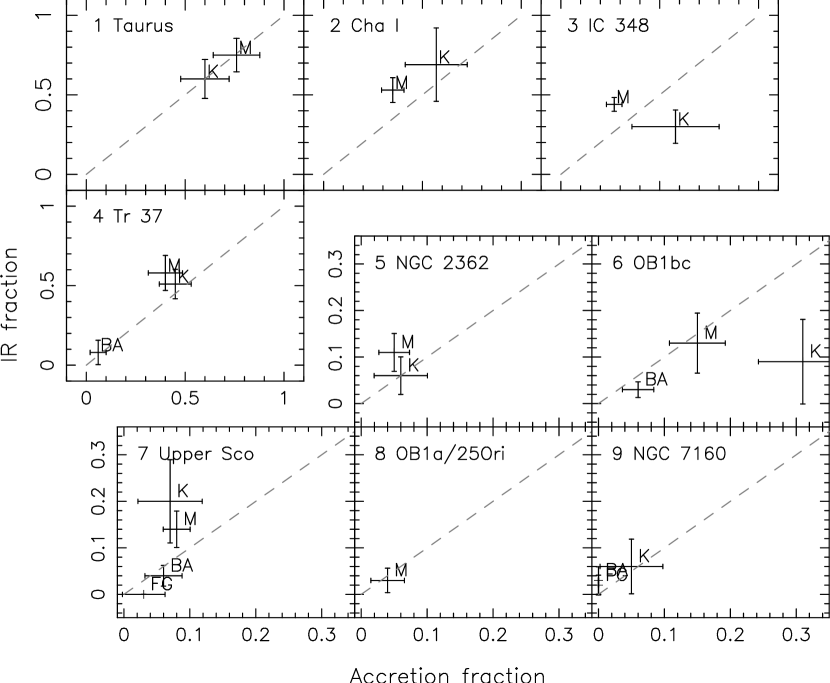
We observe, and expect, less stellar mass dependence on disk fraction for the youngest clusters. If stars of all spectral types have disks at early stages, then a difference in disk fractions between bins has had little time to develop for the youngest clusters. The results for these clusters will be somewhat influenced by the small numbers of intermediate-mass stars. The disk fraction in Cha I increases with increasing stellar mass (Luhman et al., 2008), which may be the result of initial variations in disk fraction with stellar mass. Only a few intermediate mass stars in the IC 348 sample of Luhman et al. (2003) have EW[H] measurements, so the high accretion fraction for these objects may simply be due to the small sample size. It is not clear why the IR fraction of IC 348 increases from MB3 to MB4. Given that the disk fraction is lower than for Tr 37, we expect it to show a similar trend. The difference may be a result of its younger age and perhaps an initially lower disk fraction.
Compared to Solar and intermediate-mass stars, any trends for low-mass and late spectral type stars are less clear. There appears to be a consistent decrease in accretion fraction to the lowest mass/spectral type bins, but this trend does not appear in the IR-fractions as we bin them. Finer binning shows some clusters do decrease their IR-fractions toward low mass stars, though the uncertainties are large (e.g. Dahm & Hillenbrand, 2007; Hernández et al., 2007).
External photoevaporation may affect low mass stars (e.g. Scally & Clarke, 2001; Adams et al., 2004), particularly because many of our clusters are part of OB associations. Given that external photoevaporation depends on the cluster environment and is therefore different for each star in each cluster it may contribute to the lack of a clear trend.
Looking more closely at the objects with disagreement between their IR and accretion signatures yields information about objects that are likely transition disks. This comparison applies to individual objects with both IR and EW[H] measurements. Of the objects with disagreeing signatures, 43 are accretors without IR excesses, and 109 have IR excesses but are not accretors (i.e. may be transition disks). The former group are spread over spectral type bins roughly in proportion to the overall sample, and may be due to near-threshold/erroneous values of EW[H] or SED slope. However the latter group, the transition disks, are nearly all K and M-type stars. About 80% (87/109) of these transition objects are M stars (vs. 50% (650/1253) of the overall sample), and 16% (18/109) are K stars. Thus, the apparent discrepancy between disk fractions for lower-mass stars may be partly accounted for by nearly all transition disks being lower-mass stars.444A similar finding for stars with “anemic” disks—those with near-photospheric SED slopes—in IC 348 was made by Lada et al. (2006), and interpreted as being due to faster disk evolution for later-type stars. However, Currie (2008) finds the converse for this sample, suggesting that anemic disks around early-type stars are in fact debris disks and further evolved than the transition disks around the late-type stars.
Given the lack of any clear trend when comparing low and Solar-mass stars, we now focus on trends for Solar and intermediate-mass stars.
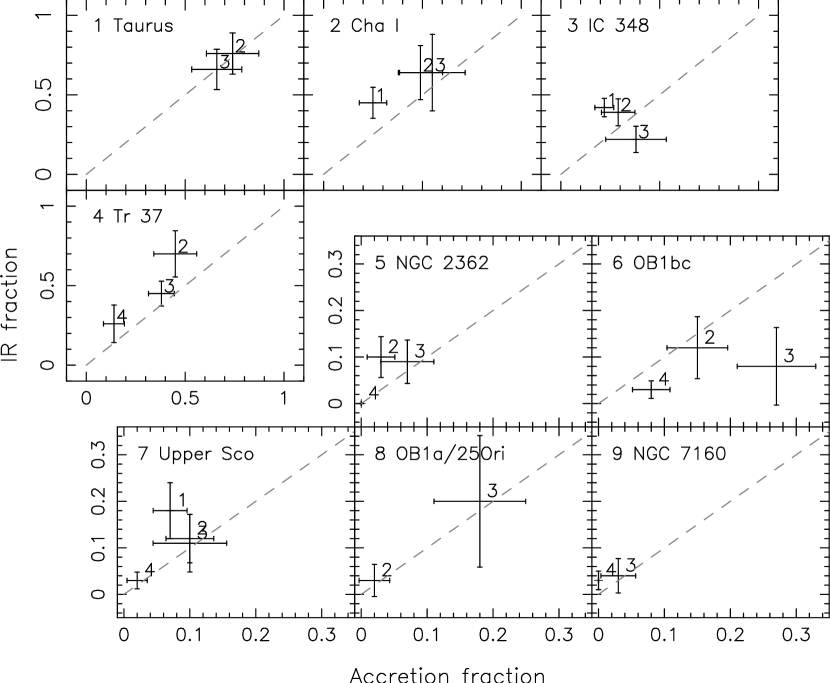
Figure 5 again shows the binned results, this time comparing accretion and IR fractions. The error bars provide a measure of the significance of the differences seen in Figure 4 and show no major differences between IR and accretion fractions. The three young clusters Taurus, Cha I, and IC 348 have disk fractions that are largely consistent with one another. Of the older clusters, Tr 37, Orion OB1bc, and Upper Sco have somewhat significant differences between the K/MB3 and BA-FG/MB4 bins. Though the individual significance is not consistently high, of the older clusters with intermediate-mass stars, all five have lower disk fractions in their highest mass and spectral type bins.

To try a more robust primordial disk classification, we require a star to have both accretion and IR signatures to be classed as having a disk, because objects with only one disk signature may be some form of transition object. Figure 6 shows these “common” disk fractions. There are fewer objects overall, but the primary result is the same: the decrease in disk fraction for higher mass/later spectral type bins remains.


There are some differences between the results for binning by spectral type and mass. For mass binning, general trends are conserved, but the magnitude of the differences is similar or smaller. The difference in disk fraction between K and BA-stars in Tr 37 is 40%, but only 20% for the roughly comparable MB3 and MB4 stars. Carpenter et al. (2006) find that the disk fraction of KM stars in Upper Sco is higher than FG and BA stars at 99.2% and 92% confidence respectively. For MB3 and MB4 stars, we find a similar result of 87–90% confidence (see Table 4 and discussion below). Because it has a physical basis, we proceed using the mass binned results.
3.2.2 Quantifying results for Solar and intermediate-mass stars
We now put the differences in disk fractions on a more quantitative footing. There are two aspects of the results we can quantify: the significance of differences between bins on a cluster by cluster basis and the significance yielded by our sample of nine clusters.
Figure 7 shows a direct comparison of the MB3 and MB4 bin fractions (where both bins have 10 stars). The errors are calculated from a binomial distribution and represent 1 limits on the intrinsic disk fraction, given the observed fraction (Burgasser et al., 2003). The most obvious result is that all clusters, with the exception of IC 348, have lower disk fractions in the higher mass bin (Cha I is also an exception, but has only 3 (6) MB4 stars with IR (accretion) measures. OB1a also has insufficient MB4 stars to feature on this plot). These data may suggest that only older clusters tend to show lower disk fractions in MB4 than MB3. Perhaps primordial variations in disk fraction with stellar mass are too large for clusters to show consistent results until most of the disks have been dispersed.
To test the significance of the trend for our clusters, we compute the value for the null hypothesis that MB3 and MB4 have equal disk fractions—that disk dispersal is independent of stellar mass. Using the 12 data points (Fig. 7) with 10 stars and errors added in quadrature, we find for perpendicular deviations. We therefore reject the null hypothesis at 95% confidence. This relatively low confidence reflects the errors associated with each cluster.
Though the measurements of accretion and IR signatures are independent, they are correlated because stars with one signature tend to show the other. Thus there are fewer than the 11 degrees of freedom used above. If we combine the accretion and IR fractions of the clusters, by taking the average number of disks and stars for the two signatures, we find for 7 data points (Cha I and OB1a still have less than 10 stars in MB4). We reject the null hypothesis with 99.9% confidence. Though the differences to the null hypothesis are similar, the rejection is much stronger because the errors for each point are smaller. Therefore we conclude that there is some evidence of stellar mass dependent disk dispersal with 95–99.9% confidence. We return to the question of whether the data can be better explained by a model in §4.2.
On an individual level, these plots make the differences between disk fractions clear. Within their errors, Taurus, IC 348, and NGC 7160 are all consistent with having equal disk fractions in MB3 and MB4. We expect this result, because at early and late times, all or no stars have disks. Tr 37 appears to have the most significant deviations from equal disk fractions, with both accretion and IR fractions well below the dashed line in Figure 7. Looking at clusters with low overall disk fractions (right panel), NGC 2362, Orion OB1bc, and Upper Sco also have somewhat significant deviations from equal fractions.
We test the significance of individual differences between MB3 and MB4 with Fisher’s Exact Test (right-sided). This test finds the likelihood that a more extreme separation in disk fractions between the two bins should exist. In the right sided case, “more extreme separations” means a more positive difference in disk fractions . This test shows the significance of the difference in each cluster and highlights where future observations can make the most progress.
Table 4 shows the results of this test for accretion, IR, and common fractions, for objects in MB3 and MB4. The numbers in parentheses show the lower of the total number of stars in MB3 or MB4 for each cluster, as a measure of the minimum sample size each test result is based on. Thus, 0.19%(50) for Tr 37 is derived from comparing 34/89 (MB3) with 7/50 (MB4).
The accretion fractions of Tr 37 and OB1bc are by far the most significant, with less than 0.2% likelihood that a greater difference in disk fractions between MB3 and MB4 should occur. These clusters have the most significant results because of the large number of intermediate-mass stars with EW[H] measurements. By eye, this test agrees with the separations suggested by the errors in Figure 7. As noted above, we find a similar significance to Carpenter et al. (2006) for Upper Sco. Thus, this test shows that the significance of differences in MB3 and MB4 disk fractions for the 4–5 Myr old clusters vary between 60–99%. It is this large range in significance that limits the confidence with which we reject the null hypothesis.
As can be intuitively seen in Figure 7, Fisher’s Exact Test shows where the most progress can be made by future observations. The Spitzer observations of Orion OB1a/25 Ori and OB1bc (Hernández et al., 2007) focus on low-mass stars Briceño et al. (2005). Many intermediate-mass stars have yet to be characterised, particularly in the Spitzer IRAC wavelength range we use here. NGC 2362 has a large population of intermediate-mass stars lacking published spectral types, which would increase the significance of the result for this cluster.
3.3. Summary
We find evidence of stellar mass dependent disk dispersal. All intermediate-mass stars in clusters older than 3 Myr have lower disk fractions than Solar-mass stars. Individually, the 4–5 Myr clusters Tr 37, NGC 2362, Orion OB1bc, and Upper Sco all have marginal significance, at around the 1 level. The most significant results are for the accretion fraction of Tr 37 and Orion OB1bc. These results are generally in agreement with the results of the Fisher’s Exact Test. We reject the null hypothesis—that the disk fractions in bins MB3 and MB4 are the same—at 95–99.9% confidence. This confidence is limited by the number of stars in each cluster.
4. Theoretical mechanisms
The results in Figure 7 and Table 4 suggest that mass dependent disk dispersal is real. Though intermediate-mass stars in all clusters older than 3 Myr have lower disk fractions than Solar-mass stars, the results of Fisher’s Exact Test show that most clusters have marginal (1) individual significance. If the 4–5 Myr clusters represent the maximum possible difference, it may be hard to achieve 3 significance for a single cluster with 100 stars in the MB3 and MB4 bins. To consider how large we expect these differences to be, we look at disk evolution from a theoretical perspective.
To make an initial exploration of predictions for stellar mass dependent disk dispersal, we consider two plausible disk evolution models. To evaluate the observational signature of the evolution of solid material in the disk, we first consider the possibility that dust in the regions probed by the IRAC wavebands evolves more rapidly for more massive stars. To illustrate observational diagnostics derived from the global evolution of the disk, we then examine a photoevaporation model, where a larger ionising flux causes disks around more massive stars to disperse earlier. Although we do not attempt to model the observational results in detail, we show that a simple photoevaporation model reproduces the evolution of MB3 and MB4 disk fractions much better than our null hypothesis.
4.1. Grain growth
Dust signatures decline due to removal of small grains. These grains may be physically removed, or grow to unobservable sizes. Here, we take grain growth to be that sufficient to remove any IR excess. The timescale for growth depends on the orbital period. With the simplifying assumption that a waveband traces dust at a single temperature and radial distance, observations at fixed wavelength probe different radial distances for different stellar luminosities. Therefore, dust around different stars will be in an earlier or later stage of growth. That is, for some stars there will have been little growth and the dust is still observable and for others it may have grown to invisible sizes.
To show how different stars observed with the same instrument can have different grain growth timescales, we consider how the orbital period changes with stellar mass at fixed disk temperature. The distance from a star of luminosity to remain at a fixed temperature is , where . For PMS stars , so (i.e. a waveband probes greater distances around lower mass stars). Because the period and in the inner, less flared part of the disk (e.g. Adams et al., 1987; Kenyon & Hartmann, 1987), the relation for period with stellar mass is
| (1) |
That is, the greater luminosity of higher mass stars means the period at fixed temperature increases with stellar mass.
However, the growth timescale also depends on the surface density, which is generally thought to increase with stellar mass (based on mm observations, e.g. Natta et al., 2000; Andrews & Williams, 2005). Thus,
| (2) |
indicates a decreasing growth timescale with increasing stellar mass: dust may disappear around higher mass stars more rapidly due to fast grain growth timescales. This theory provides a qualitative explanation for the much lower IR excesses found for early-type stars that have disks.
While faster growth may provide some of the observed differential evolution in disk fractions, it does not offer any explanation of why the accretion signature also drops earlier for higher mass stars. Indeed, if the presence of gas allows repeated fragmentation and hinders growth (Johansen et al., 2008), then removal of the gas may be more important in setting observational signatures of both gas and dust. The leading theory for dispersal of the gaseous disk is photoevaporation, to which we now turn.
4.2. Photoevaporation


Viscous evolution and photoevaporation work together to provide a likely mechanism for removing the gaseous disks around young stars (e.g. Clarke et al., 2001). As the disk evolves and angular momentum moves outward, gas moves inward and is accreted onto the central star. At the same time, a wind of gas ionised by stellar radiation removes material from the outer disk, beyond the “critical radius” where the sound speed in the ionised gas is larger than the orbital velocity (e.g. Hollenbach et al., 2000). When the accretion rate through the inner disk onto the star drops below the wind loss rate, the inner disk becomes depleted and is rapidly accreted onto the star. With the inner disk removed, stellar radiation rapidly photoevaporates the remaining gas (Alexander et al., 2006).
4.2.1 A simple model
To explore how this process impacts the time variation of disk fractions in young clusters, we use a simple photoevaporation model. This model captures the important aspects of the process described above, with a prescription for the time evolution of the accretion rate. When the accretion rate drops below the (fixed) wind loss rate, the disk is considered dispersed (Alexander & Armitage, 2006).
For a viscous disk, the time dependent accretion rate is
| (3) |
where is the initial disk mass and is a dimensionless time. The viscous timescale is defined at the scale radius by , where the viscosity is . Initially, 1/ of the disk mass lies outside (e.g. Lynden-Bell & Pringle, 1974; Hartmann et al., 1998; Alexander et al., 2006; Alexander & Armitage, 2006). Here we assume .
The disk rapidly disperses when the accretion rate drops below the wind mass loss rate
| (4) |
where is the number of ionising photons per second and is in units of (Hollenbach et al., 1994; Font et al., 2004).
Applying this model to a range of stellar masses requires specifying disk properties as a function of stellar mass. Specifically, this variation needs to be defined for the viscous timescale and wind loss rate. Assuming , a typical disk temperature profile and , Alexander & Armitage (2006) suggest to match an apparent correlation of accretion with stellar mass (e.g. Muzerolle et al., 2005; Natta et al., 2006). Physically, their model implies that the disk scale radius decreases with increasing stellar mass. For the ionising flux, the Alexander & Armitage (2006) model uses . Though they did not consider it significant, their model predicts a stellar mass dependent disk lifetime (their Fig. 2). Higher mass stars drive more powerful winds and have shorter accretion timescales; thus, photoevaporation shuts off accretion earlier for more massive stars.
Alternatively, Alexander et al. (2006) considered a linearly increasing scale radius with increasing stellar mass, but fixed (thus ). They fixed to scale with the orbital timescale at the disk scale radius and therefore . In this case the disk lifetimes increase nearly linearly with stellar mass.
Thus, there is little constraint on how the viscous timescale changes with stellar mass. Choosing based on the apparently strong positive correlation between accretion and stellar mass may be unfounded. Accretion measurements suffer a stellar mass dependent bias (Clarke & Pringle, 2006) and a linear relation () may be a better choice ( independent of ). Another parameter that has an impact is the disk scale radius. If the initial disk radius increases with stellar mass, then the viscous timescale increases with stellar mass. Observationally, how disk radius varies with stellar mass is poorly constrained. To explore the possibilities of the model, we adopt yr (: viscous power-law index).
Some constraints on how the wind loss rate changes with stellar mass exist. If the ionising flux scales with the bolometric stellar luminosity and for PMS stars, then . A better indication of how the high energy flux varies comes from the X-ray flux, which varies as (Güdel et al., 2007), yielding . In our model, we allow for variation of the wind loss rate by adopting (: wind power-law index).
The two cases outlined above then have and (Alexander & Armitage, 2006) and and (Alexander et al., 2006). For a typical disk mass, we follow Alexander & Armitage (2006) and set (e.g. Natta et al., 2000; Andrews & Williams, 2005).
Figure 8 shows the two examples of disk evolution for a range of stellar masses using Equation (3). The disk is dispersed at the point where the accretion rate drops below the wind rate (where lines of the same type meet and terminate). The left panel shows the model with and ; the disk lifetime decreases with increasing stellar mass. The right panel shows the other model, with and ; the disk lifetime increases with stellar mass.
Of these two models, the left panel qualitatively explains the trend observed in our cluster data. The fact that all 5 clusters older than 3 Myr show a decreased disk fraction for higher mass stars argues that higher mass stars lose their disks earlier and that the model that reproduces this behaviour is more realistic. This qualitative agreement suggests that either the viscous timescale does not increase with stellar mass, or the wind loss rate increases relatively strongly with stellar mass.
To understand how the two models produce opposite trends in disk lifetime with stellar mass, we look at how the wind rate and viscous timescale change with stellar mass in more detail. Simplifying Equation (3) by assuming , setting and solving for (i.e. the epoch of disk dispersal) yields
| (5) |
This relation shows how disk lifetime varies with the viscous timescale and wind loss rate. Thus, the disk lifetime decreases with increasing stellar mass whenever . The two models in Figure 8 thus have and .
For our purposes, Equation (5) shows that the difference between the scaling of viscous timescale and wind loss rate with stellar mass sets how the disk dispersal time varies with stellar mass. Though there are many uncertainties associated with the many model parameters, we proceed with two of our own “example” models to illustrate the implications of this model. These models also yield estimates to compare with our observational results.
The first model has and (, ). The disk lifetime is therefore , the same as the left panel of Figure 8. Other solutions to yield the same results, provided the disk lifetime is longer than the viscous timescale (true for the stellar mass bins MB3 and MB4). The second model has and (, the same as other solutions to ). This weaker dependence illustrates how strongly the results depend on changes to and .
4.2.2 Application to cluster disk fractions
To extend the model to a cluster of stars, we assume that a range of disk lifetimes at fixed stellar mass arises from the natural dispersion in initial disk masses within a cluster (e.g. Natta et al., 2000; Andrews & Williams, 2005). For fixed stellar mass (and ), more massive disks last longer than less massive ones due to higher accretion rates. We assume disk masses are normally distributed in log space about (used by Alexander & Armitage, 2006). A factor of 10 change in disk mass represents a 3 variation. Therefore, at a given time, a fraction of disks have yet to be dispersed, which is the observable quantity we compare the model with.
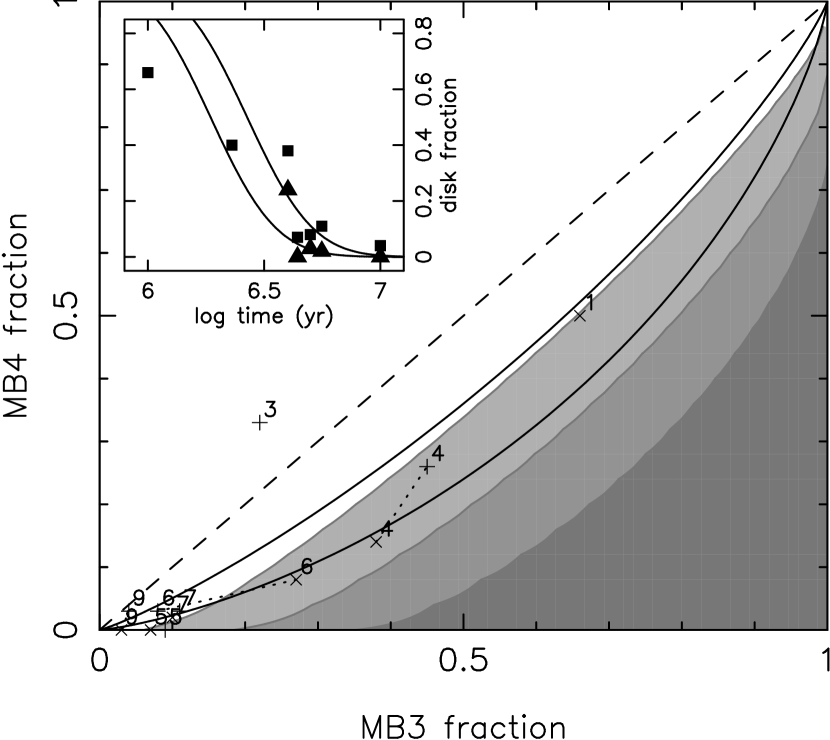
Figure 9 shows the evolution of disk fraction for our two cases of and , with stellar masses of 1 and 3 . The model stellar masses represent the MB3 and MB4 mass bins in our cluster sample. The disk fraction loci start at the top right of the figure, when all stars have disks. They then move down and away from the line of equal disk fractions, as higher mass stars lose their disks at a faster rate than lower mass ones. Finally, the lines reach the lower left of the figure, when all stars have lost their disks.
Though we do not attempt to fit a model, it is clear that is consistent with our observed fractions. We compare the model and data in MB3 vs. MB4 space because as shown by the Figure 2 and the Figure 9 inset, individual bin fractions vary widely. Attempting to fit the time evolution of MB3 and MB4 would not yield useful or informative parameters. We thus consider the relative difference between MB3 and MB4 as disk fraction decreases, which appears to be a general property of the 3 Myr clusters in our sample.
If our model is representative of the physical conditions in a photoevaporating circumstellar disk, the relatively small differences in observed disk fractions between mass bins may not be because there is no signal (i.e. disk fraction is actually independent of stellar mass). It is because the signal is naturally weak and most clusters have insufficient members for a significant result. Clusters that fall in the times where the bulk of disks are being dispersed, such as Tr 37, provide the best constraint how varies with . Though the 5 Myr clusters have differences as significant as Tr 37, the model disk fractions change little with and at these low disk fractions.
Calculating the perpendicular square residuals between the model and our data yields an extremely good fit of –2.1 (with the method as described for testing our null hypothesis, §3.2.2). This result is much smaller than for the null hypothesis and than expected given the estimated errors. However, this comparison shows that a plausible model reproduces the data much better than the null hypothesis.
To quantify the improvement in , we use the Bayesian Information Criterion (Schwarz, 1978), where . While a model fit to points can always be improved by adding parameters (), the BIC tests whether extra parameters lower the enough to be useful. Lower BIC values are preferred; a difference of 2 between models indicates positive evidence against the higher BIC value, a difference of 6 indicates strong evidence, and differences greater than 10 very strong evidence.
For the two calculations of our null hypothesis (, , , and , , ), we find and 22. For the two calculations of our model (, , , and , , ), we find and 16. Thus, our model is significantly better at explaining the differences in disk fractions in MB3 and MB4 than the null hypothesis.
Given the degeneracy between the viscous timescale and wind loss rate, we cannot put strong constraints on any parameters aside from . The data do not support models with higher wind loss rates than observations of X-ray luminosity suggest, or stronger than inverse dependence of the viscous timescale on stellar mass.
To estimate the significance of the observed and model disk fractions in a more general way, we again use the binomial distribution. For every point in MB3 and MB4 space where (i.e. below the dashed line in Figure 9), we estimate the likelihood of observing those fractions when the intrinsic fraction is a single value somewhere in between. This calculation is slightly different than for finding individual errors. Instead of finding the upper and lower intrinsic fractions that the observed fraction is 1 away from, we find the single intrinsic fraction with the highest chance of observing the fractions in MB3 and MB4 (which are different). Specifically, we use
| (6) |
and solve for . is the probability distribution for intrinsic fraction , with sample size and observed number of disks (see Burgasser et al., 2003). The integrated area gives the likelihood of measuring MB3 and MB4 from sampling stars with an intrinsic disk fraction .
To make this significance estimate, we need to choose properties of a “typical” cluster. A standard IMF (e.g. Kroupa, 2001) suggests there should be roughly three times as many MB3 stars as MB4 stars. Table 3 shows a wide range in relative and overall numbers. Therefore we choose the expected IMF ratio and use 100 stars (75 lower mass, 25 higher mass) over the two mass bins. This “typical” cluster therefore has 1000 stars between 0.1–7 . With the caveat that only one of our cluster samples resembles this typical cluster by number and IMF in MB3 and MB4 (the IR fraction for Tr 37), this model allows us to roughly map out the entire disk fraction space MB3 and MB4 may occupy.
The contours in Figure 9 show the estimated significance of differences in the two bins. The regions are 1, 2, and 3 from light to dark. Comparing the model to the contours, the model suggests nearly 1 confidence is typical for samples with 100 stars in the MB3 and MB4 bins. For , the difference in disk fractions generally sits within the 1 region. Thus, the model is 1–2 significant for this assumed typical cluster.
4.2.3 Future observations
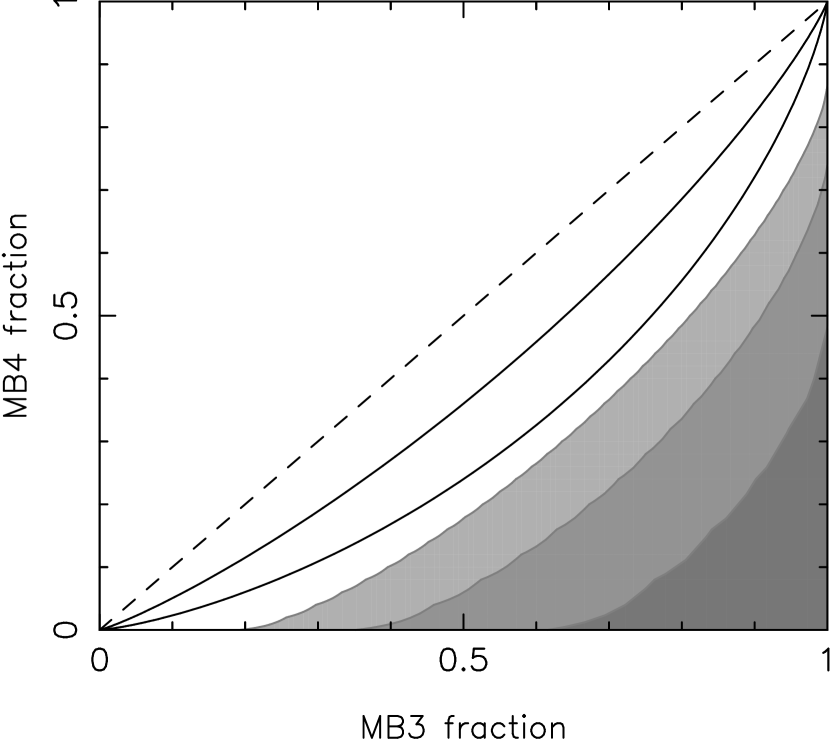
To illustrate how the significance contours in Figure 9 change with cluster size, we repeat the calculation for one larger, and one smaller cluster. Figure 10 shows the number of stars needed for a 3 result over the possible range of disk fractions, with 48, 100, and 200 stars in MB3 and MB4. Overplotted are evolutionary lines from the model. The Figure shows that 200 stars are needed in the MB3 and MB4 bins for a 3 result if and clusters show similar results to the data and our model. For clusters following a typical IMF, this requirement means a total of 2000 stars between 0.1 and 7 . However, it is important to remember that this is a general estimate based on a typical IMF. The accretion fraction of Tr 37 shows that doubling the number of stars in MB4, with a similar number in MB3 strongly increases the significance of the difference (Tables 3 and 4).
Though few young clusters with thousands of stars have been studied to date, multi-object spectrographs such as Hectospec on the Multiple Mirror Telescope (MMT) and 2df/AAOmega on the Anglo-Australian Telescope (AAT), make spectroscopy of this many objects possible. Clusters such as the Orion Nebula Cluster and h and Persei show that the desired numbers are obtainable. Despite being 13 Myr old, h and Persei shows evidence for stellar mass dependent disk dispersal (Currie et al., 2007). A particularly promising cluster is NGC 2264, which may have as many as 1000 stars, and at 3 Myr old is in a favourable age range for stellar mass dependent disk dispersal. For other regions, such as NGC 2362 and Orion OB1bc, additional work to obtain samples complete over the widest possible range of spectral types will be beneficial.
A complementary way forward is to increase the number of clusters studied. Here, we find higher mass stars in 5/5 clusters older than 3 Myr lose their disks faster than lower mass stars. If additional clusters continue to show the same behaviour, the increased numbers will strengthen this result. However, the significance of individual clusters needs to be 1 for the level at which we reject the null hypothesis to increase. Otherwise the value will increase by about the same amount as is required by the extra degree of freedom for fixed confidence.
Thus, to show more strongly that stellar mass dependent disk dispersal is a general result of disk evolution, obtaining the most complete cluster samples possible is needed. Because most clusters will not reach more than 2 significance, using larger samples of clusters will also be important. The clusters most useful for constraining disk dispersal models will be 3–5 Myr old.
5. Effects on planet formation
Our results in §3 and §4 suggest that the observed and predicted signals for stellar mass dependent disk dispersal are real. While additional clusters and larger samples of stars in 4–5 Myr old clusters may yield more significant results, there may be other observable signatures of stellar mass dependent disk dispersal.
The orbits of giant planets provide a plausible test of this theory. Gas giants require a substantial gas disk to form. Observations of giant planets close to their parent stars suggest that planets migrate inward after they form (e.g. Lin et al., 1996). Because tidal torques between the planet and the disk are the most likely migration mechanism, the masses and orbits of gas giants are plausibly linked to the mass and lifetime of the disk. If these correlate with stellar mass (§4), the mass and orbits of gas giant planets may correlate with the stellar mass.

Observations of gas giants are starting to provide the data to guide models. Figure 11 shows the semi-major axes of known RV-discovered exoplanets as a function of stellar mass.555From http://exoplanet.eu , where and known. To put these planets on an even footing, we only show planets with an RV signal greater than 30 m s-1. This signal is about that expected from a 2 planet at 1 AU from a 2 star and typical of planets orbiting Solar-mass stars. Because the closest orbits are easiest to detect, the innermost orbits at each stellar mass are probably close to the real limits—interior planets of the same mass are easier to discover by RV. These data suggest a small increase in the minimum separation from 0.3 ( AU) to 1.6 ( AU) followed by a large jump to AU at 1.4 (see also Johnson et al., 2007b; Sato et al., 2008a, b; Niedzielski et al., 2008). The trend in with stellar mass is probably not a selection effect.
Post-main sequence stellar evolution probably does not cause the observed trend in with stellar mass. Current radial velocity techniques are unable to achieve high accuracy for main sequence A-type stars. Thus, to discover planets around intermediate mass stars, radial surveys observe cooler, evolved objects. These stars have larger radii than on the main-sequence, 5 for a 2 subgiant. If larger subgiant stars engulf close planets or if tidal interactions cause close planets to spiral into the star, massive subgiants would have many fewer close-in giant planets (e.g. Rasio et al., 1996; Johnson et al., 2007b). However, Johnson et al. (2007b) suggest that (i) only post–helium-flash clump giants may have lost planets due to increased radii and (ii) engulfing very close planets is not solely responsible for the lack of short period planets around subgiants and K giants. This conclusion is supported by numerical simulations (Sato et al., 2008a).
If the step in at 1.6 is not due to post–main-sequence stellar evolution, then it is probably a signature of the planet formation process. Here, we consider two ways to link the orbits of gas giant planets with mechanisms of disk dispersal. In the photoevaporation model, more rapid disk dispersal for intermediate mass stars leads to a shorter time for gas giants to migrate closer to their host stars. Thus, gas giants around more massive stars may have larger orbits. In any model of disk dispersal, intermediate (low) mass stars reach the main sequence before (after) the disk disperses. Thus, the radius of a PMS star at the epoch of disk dispersal may set the closest orbit for a gas giant planet.
5.1. Migration
To explore links between migration and disk dispersal, we consider their relative timescales (see also Ida & Lin, 2004; Burkert & Ida, 2007). Our analysis of the cluster data shows that the disk dispersal timescale may decrease weakly with stellar mass. For the photoevaporation model, . If the migration timescale increases with (or is independent of) stellar mass, then the migration timescale will exceed the disk dispersal timescale at some stellar mass. For stars more massive than this limit, planets will remain on orbits near where they formed.
Planets undergoing type II migration are locked to the disk and move inward on the viscous timescale. A typical estimate of the migration timescale is
| (7) |
where is a scaling parameter, is the disk aspect ratio, and the orbital frequency (D’Angelo et al., 2002).666Equation (7) applies when the planet mass is less than the local disk mass (e.g. Syer & Clarke, 1995). The migration rate decreases as the planet begins to dominate. We reserve this detail for a more thorough model of formation and migration. If the distance where planets originate varies linearly with stellar mass (e.g. Kennedy & Kenyon, 2008a; Kretke et al., 2008) and if and are constant, the migration timescale is yr.
Setting yields . Thus, with our adopted disk dispersal and migration timescales, planets around stars greater than 2 should have their migration halted by disk dispersal. Though this estimate is similar to the observed transition mass between close and more distant orbits, it is highly uncertain. For example, because type II migration is linked to the viscous evolution of the disk, how migration changes with stellar mass is uncertain (as discussed in §4.2). Exploring this picture in detail requires a detailed model that considers concurrent migration and disk dispersal as a giant planet grows.
This picture has two other implications for giant planet formation. In the core accretion model for gas giant planet formation, protoplanets grow more slowly at larger distances from their host star. Thus, the disk lifetime effectively sets an outer limit to where gas giants form (e.g. Kennedy & Kenyon, 2008b). If the disk lifetime depends on stellar mass, this outer limit is closer than predicted by models with a fixed disk lifetime (e.g. Ida & Lin, 2005; Kennedy & Kenyon, 2008b).
Differential disk dispersal rates may also affect giant planet frequency. Current observations suggest an increasing frequency of gas giants around more massive stars (Butler et al., 2006; Johnson et al., 2007a). In planet formation theory, this frequency is set by two competing effects: (i) shorter disk lifetimes for more massive stars reduce the likelihood of forming giant planets and (ii) higher disk masses for more massive mass stars increase the probability of gas giant planet formation. As for the implications for migration, understanding how these effects affect gas giant formation requires more detailed models that are beyond the scope of this paper.
5.2. Pre–main-sequence contraction
To conclude this section, we consider whether PMS stellar evolution can affect the orbits of close in giant planets. As young stars approach the main sequence, they contract. The PMS contraction, which is ongoing during giant planet formation and disk dispersal, may therefore affect the innermost orbits that migrating planets may reach.
The inner edge of a circumstellar disk (the truncation radius) is a function of the stellar radius (e.g. Bouvier et al., 2007). If planets cannot migrate interior to this edge (e.g. Lin et al., 1996), then the stellar radius at the epoch of disk dispersal sets the innermost possible orbit (aside from later movement due to tidal evolution, which also depends on stellar parameters e.g. Rasio et al., 1996; Jackson et al., 2008). The larger radii of more massive stars and their shorter disk dispersal timescales, prevent planets from reaching closer orbits during their PMS phase.
Because the radius of a PMS star changes with time, we can use our disk dispersal timescale to estimate the stellar radius when the disk is removed. Observationally, 5–10 stellar radii represents roughly the closest orbit a planet can reach by migration, which must occur while the disk is still present. The dashed line in Figure 11 shows how the stellar radius at yr varies with stellar mass using the Siess et al. (2000) PMS tracks. The PMS stellar radii shows a weak trend with stellar mass, similar to the innermost orbits. Thus, the innermost orbits of exoplanets may be set by the radius of their PMS host star, through the stars influence on the inner edge of the circumstellar disk.
This suggestion is uncertain for many reasons. For example, the disk inner radius may not be a linear function of the stellar radius and orbits evolve through tidal interaction with the host star after reaching close orbits. Future discoveries of exoplanets orbiting low-mass stars will fill in the left side of Figure 11, giving a better idea of how the innermost orbit changes with stellar mass.
5.3. Alternatives and future work
The diversity of planet formation models means there are alternative theories that may explain the observed orbits of intermediate mass stars. These theories suggest the trend is either a formation signature, or a result of later stellar evolution. These theories make testable predictions, that will be judged based on future observations.
Kretke et al. (2008) suggest that the larger orbits may be a signature of the “dead zone” in a layered disk accretion model (Gammie, 1996). The inner edge of the dead zone (whose distance varies roughly linearly with stellar mass in their model) acts as a “trap” for both planets (e.g. Masset et al., 2006) and their building blocks. However, if giant planet orbits were purely a result of the dead zone distance, one might expect a roughly linear dependence of planet semi-major axes on the mass of their hosts, rather than the step that appears in Figure 11.
One first step toward understanding the origin of the larger orbits for intermediate mass stars is to verify that the trend is real. Though difficult, if close-in planets can be found orbiting intermediate mass stars before they leave the main-sequence, then the engulfment scenario may be ruled out. Further work using planet formation models (e.g. Burkert & Ida, 2007; Kennedy & Kenyon, 2008b) can study how changes in disk evolution affect the observable outcomes of planet formation. The continued discovery of planets around low and intermediate-mass stars will provide further constraints on the final outcomes these models must produce.
As we have shown, planet formation models provide a link between disk evolution and observed exoplanet distributions. Thus, the inclusion of differential disk lifetimes in these models can attempt to understand both how planets form and how the disks they form in evolve.
6. Summary
Our results suggest a stellar mass dependent timescale for the dispersal of circumstellar disks around young stars. Intermediate-mass stars tend to lose their disks earlier than Solar-mass stars. All clusters in our study older than 3 Myr show this tend. We reject the null hypothesis—that Solar and intermediate-mass stars lose their disks at the same rate—with 95–99.9% confidence. For each cluster, higher mass stars lose their disks earlier than their Solar mass counterparts with a significance of roughly 1 . For low mass stars, there is a clear disagreement in disk dispersal timescales derived from accretion and dust signatures. This discrepancy may be partly due to an increased occurrence of transition disks among lower-mass stars.
By considering how the timescale for grain growth varies with stellar mass for a fixed disk temperature, we show that the dust around higher mass stars may appear to be more evolved than lower mass stars. This model provides a possible explanation for the lower IR excesses observed for early-type stars with disks, as compared to later-type stars.
Our analysis of a reasonable photoevaporation model demonstrates that the predicted signature of stellar mass dependent disk dispersal is subtle. In this model, the largest differences in disk fractions are expected when the bulk of cluster stars are dispersing their disks. Observations suggest that this dispersal occurs between 4–5 Myr. At earlier (later) times, we expect small differences because most (no) stars of all masses have disks.
Though it is hard to rule out the increasing multiplicity fraction with stellar mass as an alternative mechanism, the lack of any observed differences in disk evolution in multiple systems argues for photoevaporation as the likely mechanism. As noted in 3.1, the effects of binary companions are complex and largely unknown. Given that around half of stellar systems may be binaries or multiples in the primary mass range where planets are routinely discovered (e.g. Duquennoy & Mayor, 1991), and that planets are known to exist in binary systems (e.g. Hatzes et al., 2003), the effects of binaries merit further study. To make progress in this area requires larger samples of objects with known multiplicity. The most useful samples will contain objects with 10 AU separations, where the effects on disk evolution as observed by accretion and hot-dust signatures are thought to be strongest. Obtaining samples with a wide range of primary masses will be essential to understand the effects (if any) on stellar mass dependent disk dispersal.
Stellar mass dependent disk dispersal may have consequences for extra-Solar planets observed around main-sequence and older stars. Current observations find a step in planet semi-major axes for stars more massive than 1.6 . This feature may be caused by a shorter disk dispersal timescale for more massive stars. Giant planets forming around these stars have less time to migrate and remain on orbits near where they form. More planet detections over a range of stellar masses will test the reality of the apparent step in at 1.6 and allow better tests of models for migration and disk dispersal. Studying tidal decay in more detail will also indicate the level at which stellar evolution affects these orbits.
The causes and effects of stellar mass dependent disk dispersal are many-fold and complex and progress can be made in several directions. For young stars, high resolution spectroscopy and direct detection of the H2 component of circumstellar disks will yield better knowledge of how the gaseous component evolves. For low-mass stars, consideration of the local environment may show that disk dispersal depends on proximity to luminous O stars. A greater knowledge of multiplicity on an individual level will allow further studies of how companions may affect disk evolution.
Testing our main result in more detail requires larger samples. To reject the null hypothesis with greater confidence requires both more clusters and a high level of completeness for new and known clusters. Because the error drops roughly as , large increases in significance for well studied clusters will be difficult. However, clusters such as NGC 2362 and Orion OB1bc and OB1a have many more Solar and intermediate-mass stars that need their circumstellar environments characterised, so will benefit from further study.
Additional clusters are also needed. Clusters with ages of 4–5 Myr—when most stars lose their disks—provide the most sensitive measure of the dispersal time as a function of stellar mass. With many intermediate-mass stars and at 3 Myr, NGC 2264 is probably the best example of a rich cluster with unpublished Spitzer IRAC data. It will be interesting to see whether this cluster shows results similar to the slightly older Tr 37, or the slightly younger IC 348. Obtaining spectroscopy of many objects in rich clusters and associations is made possible with multi-object spectrographs such as Hectospec and 2df/AAOmega.
Because there will be only a few clusters with the several thousand stars required for high significance, progress will come from increases in both cluster numbers and the best possible level of completeness for all clusters.
References
- Adams et al. (2004) Adams, F. C., Hollenbach, D., Laughlin, G., & Gorti, U. 2004, ApJ, 611, 360 [ADS]
- Adams et al. (1987) Adams, F. C., Lada, C. J., & Shu, F. H. 1987, ApJ, 312, 788 [ADS]
- Alexander & Armitage (2006) Alexander, R. D. & Armitage, P. J. 2006, ApJ, 639, L83 [ADS]
- Alexander et al. (2006) Alexander, R. D., Clarke, C. J., & Pringle, J. E. 2006, MNRAS, 369, 229 [ADS]
- Andrews & Williams (2005) Andrews, S. M. & Williams, J. P. 2005, ApJ, 631, 1134 [ADS]
- Armitage et al. (1999) Armitage, P. J., Clarke, C. J., & Tout, C. A. 1999, MNRAS, 304, 425 [ADS]
- Balog et al. (2006) Balog, Z., Rieke, G. H., Su, K. Y. L., Muzerolle, J., & Young, E. T. 2006, ApJ, 650, L83 [ADS]
- Bessell & Brett (1988) Bessell, M. S. & Brett, J. M. 1988, PASP, 100, 1134 [ADS]
- Bouvier et al. (2007) Bouvier, J., Alencar, S. H. P., Harries, T. J., Johns-Krull, C. M., & Romanova, M. M. Protostars and Planets V, ed. , B. ReipurthD. Jewitt & K. Keil, 479–494 [ADS]
- Briceño et al. (2005) Briceño, C., Calvet, N., Hernández, J., Vivas, A. K., Hartmann, L., Downes, J. J., & Berlind, P. 2005, AJ, 129, 907 [ADS]
- Briceño et al. (2007) Briceño, C., Hartmann, L., Hernández, J., Calvet, N., Vivas, A. K., Furesz, G., & Szentgyorgyi, A. 2007, ApJ, 661, 1119 [ADS]
- Briceño et al. (2001) Briceño, C., Vivas, A. K., Calvet, N., Hartmann, L., Pacheco, R., Herrera, D., Romero, L., Berlind, P., Sánchez, G., Snyder, J. A., & Andrews, P. 2001, Science, 291, 93 [ADS]
- Burgasser et al. (2003) Burgasser, A. J., Kirkpatrick, J. D., Reid, I. N., Brown, M. E., Miskey, C. L., & Gizis, J. E. 2003, ApJ, 586, 512 [ADS]
- Burkert & Ida (2007) Burkert, A. & Ida, S. 2007, ApJ, 660, 845 [ADS]
- Butler et al. (2006) Butler, R. P., Johnson, J. A., Marcy, G. W., Wright, J. T., Vogt, S. S., & Fischer, D. A. 2006, PASP, 118, 1685 [ADS]
- Calvet & Gullbring (1998) Calvet, N. & Gullbring, E. 1998, ApJ, 509, 802 [ADS]
- Cardelli et al. (1989) Cardelli, J. A., Clayton, G. C., & Mathis, J. S. 1989, ApJ, 345, 245 [ADS]
- Carpenter et al. (2006) Carpenter, J. M., Mamajek, E. E., Hillenbrand, L. A., & Meyer, M. R. 2006, ApJ, 651, L49 [ADS]
- Castelli & Kurucz (2003) Castelli, F. & Kurucz, R. L. IAU Symposium, Vol. 210, , Modelling of Stellar Atmospheres, ed. N. PiskunovW. W. Weiss & D. F. Gray, 20P–+ [ADS]
- Clarke et al. (2001) Clarke, C. J., Gendrin, A., & Sotomayor, M. 2001, MNRAS, 328, 485 [ADS]
- Clarke & Pringle (2006) Clarke, C. J. & Pringle, J. E. 2006, MNRAS, 370, L10 [ADS]
- Currie (2008) Currie, T. 2008, ArXiv e-prints, (0801.1116) [ADS]
- Currie et al. (2007) Currie, T., Balog, Z., Kenyon, S. J., Rieke, G., Prato, L., Young, E. T., Muzerolle, J., Clemens, D. P., Buie, M., Sarcia, D., Grabu, A., Tollestrup, E. V., Taylor, B., Dunham, E., & Mace, G. 2007, ApJ, 659, 599 [ADS]
- Dahm (2005) Dahm, S. E. 2005, AJ, 130, 1805 [ADS]
- Dahm & Hillenbrand (2007) Dahm, S. E. & Hillenbrand, L. A. 2007, AJ, 133, 2072 [ADS]
- D’Angelo et al. (2002) D’Angelo, G., Henning, T., & Kley, W. 2002, A&A, 385, 647 [ADS]
- Dommanget & Nys (2002) Dommanget, J. & Nys, O. 2002, VizieR Online Data Catalog, 1274, 0 [ADS]
- Dullemond & Dominik (2005) Dullemond, C. P. & Dominik, C. 2005, A&A, 434, 971 [ADS]
- Duquennoy & Mayor (1991) Duquennoy, A. & Mayor, M. 1991, A&A, 248, 485 [ADS]
- Fischer & Valenti (2005) Fischer, D. A. & Valenti, J. 2005, ApJ, 622, 1102 [ADS]
- Font et al. (2004) Font, A. S., McCarthy, I. G., Johnstone, D., & Ballantyne, D. R. 2004, ApJ, 607, 890 [ADS]
- Furlan et al. (2006) Furlan, E., Hartmann, L., Calvet, N., D’Alessio, P., Franco-Hernández, R., Forrest, W. J., Watson, D. M., Uchida, K. I., Sargent, B., Green, J. D., Keller, L. D., & Herter, T. L. 2006, ApJS, 165, 568 [ADS]
- Gammie (1996) Gammie, C. F. 1996, ApJ, 457, 355 [ADS]
- Güdel et al. (2007) Güdel, M., Briggs, K. R., Arzner, K., Audard, M., Bouvier, J., Feigelson, E. D., Franciosini, E., Glauser, A., Grosso, N., Micela, G., Monin, J.-L., Montmerle, T., Padgett, D. L., Palla, F., Pillitteri, I., Rebull, L., Scelsi, L., Silva, B., Skinner, S. L., Stelzer, B., & Telleschi, A. 2007, A&A, 468, 353 [ADS]
- Haisch et al. (2001) Haisch, Jr., K. E., Lada, E. A., & Lada, C. J. 2001, ApJ, 553, L153 [ADS]
- Hartmann et al. (1998) Hartmann, L., Calvet, N., Gullbring, E., & D’Alessio, P. 1998, ApJ, 495, 385 [ADS]
- Hatzes et al. (2003) Hatzes, A. P., Cochran, W. D., Endl, M., McArthur, B., Paulson, D. B., Walker, G. A. H., Campbell, B., & Yang, S. 2003, ApJ, 599, 1383 [ADS]
- Hernández et al. (2007) Hernández, J., Calvet, N., Briceño, C., Hartmann, L., Vivas, A. K., Muzerolle, J., Downes, J., Allen, L., & Gutermuth, R. 2007, ApJ, 671, 1784 [ADS]
- Hernández et al. (2005) Hernández, J., Calvet, N., Hartmann, L., Briceño, C., Sicilia-Aguilar, A., & Berlind, P. 2005, AJ, 129, 856 [ADS]
- Hillenbrand et al. (1993) Hillenbrand, L. A., Massey, P., Strom, S. E., & Merrill, K. M. 1993, AJ, 106, 1906 [ADS]
- Hollenbach et al. (1994) Hollenbach, D., Johnstone, D., Lizano, S., & Shu, F. 1994, ApJ, 428, 654 [ADS]
- Hollenbach et al. (2000) Hollenbach, D. J., Yorke, H. W., & Johnstone, D. 2000, Protostars and Planets IV, 401 [ADS]
- Ida & Lin (2004) Ida, S. & Lin, D. N. C. 2004, ApJ, 616, 567 [ADS]
- Ida & Lin (2005) —. 2005, ApJ, 626, 1045 [ADS]
- Indebetouw et al. (2005) Indebetouw, R., Mathis, J. S., Babler, B. L., Meade, M. R., Watson, C., Whitney, B. A., Wolff, M. J., Wolfire, M. G., Cohen, M., Bania, T. M., Benjamin, R. A., Clemens, D. P., Dickey, J. M., Jackson, J. M., Kobulnicky, H. A., Marston, A. P., Mercer, E. P., Stauffer, J. R., Stolovy, S. R., & Churchwell, E. 2005, ApJ, 619, 931 [ADS]
- Jackson et al. (2008) Jackson, B., Greenberg, R., & Barnes, R. 2008, ArXiv e-prints, (0801.0716) [ADS]
- Johansen et al. (2008) Johansen, A., Brauer, F., Dullemond, C., Klahr, H., & Henning, T. 2008, A&A, 486, 597 [ADS]
- Johnson et al. (2007a) Johnson, J. A., Butler, R. P., Marcy, G. W., Fischer, D. A., Vogt, S. S., Wright, J. T., & Peek, K. M. G. 2007a, ApJ, 670, 833 [ADS]
- Johnson et al. (2007b) Johnson, J. A., Fischer, D. A., Marcy, G. W., Wright, J. T., Driscoll, P., Butler, R. P., Hekker, S., Reffert, S., & Vogt, S. S. 2007b, ApJ, 665, 785 [ADS]
- Kennedy & Kenyon (2008a) Kennedy, G. M. & Kenyon, S. J. 2008a, ApJ, 682, 1264 [ADS]
- Kennedy & Kenyon (2008b) —. 2008b, ApJ, 673, 502 [ADS]
- Kenyon & Bromley (2004) Kenyon, S. J. & Bromley, B. C. 2004, AJ, 127, 513 [ADS]
- Kenyon et al. (1998) Kenyon, S. J., Brown, D. I., Tout, C. A., & Berlind, P. 1998, AJ, 115, 2491 [ADS]
- Kenyon & Hartmann (1987) Kenyon, S. J. & Hartmann, L. 1987, ApJ, 323, 714 [ADS]
- Kenyon & Hartmann (1995) —. 1995, ApJS, 101, 117 [ADS]
- Kornet et al. (2006) Kornet, K., Wolf, S., & Różyczka, M. 2006, A&A, 458, 661 [ADS]
- Kouwenhoven et al. (2007a) Kouwenhoven, M. B. N., Brown, A. G. A., & Kaper, L. 2007a, A&A, 464, 581 [ADS]
- Kouwenhoven et al. (2007b) Kouwenhoven, M. B. N., Brown, A. G. A., Portegies Zwart, S. F., & Kaper, L. 2007b, A&A, 474, 77 [ADS]
- Kouwenhoven et al. (2005) Kouwenhoven, M. B. N., Brown, A. G. A., Zinnecker, H., Kaper, L., & Portegies Zwart, S. F. 2005, A&A, 430, 137 [ADS]
- Kretke et al. (2008) Kretke, K. A., Lin, D. N. C., Garaud, P., & Turner, N. J. 2008, ArXiv e-prints, (0806.1521) [ADS]
- Kroupa (2001) Kroupa, P. 2001, MNRAS, 322, 231 [ADS]
- Lada (2006) Lada, C. J. 2006, ApJ, 640, L63 [ADS]
- Lada et al. (2000) Lada, C. J., Muench, A. A., Haisch, Jr., K. E., Lada, E. A., Alves, J. F., Tollestrup, E. V., & Willner, S. P. 2000, AJ, 120, 3162 [ADS]
- Lada et al. (2006) Lada, C. J., Muench, A. A., Luhman, K. L., Allen, L., Hartmann, L., Megeath, T., Myers, P., Fazio, G., Wood, K., Muzerolle, J., Rieke, G., Siegler, N., & Young, E. 2006, AJ, 131, 1574 [ADS]
- Levato et al. (1987) Levato, H., Malaroda, S., Morrell, N., & Solivella, G. 1987, ApJS, 64, 487 [ADS]
- Lin et al. (1996) Lin, D. N. C., Bodenheimer, P., & Richardson, D. C. 1996, Nature, 380, 606 [ADS]
- Luhman (2004) Luhman, K. L. 2004, ApJ, 602, 816 [ADS]
- Luhman (2007) —. 2007, ApJS, 173, 104 [ADS]
- Luhman et al. (2008) Luhman, K. L., Allen, L. E., Allen, P. R., Gutermuth, R. A., Hartmann, L., Mamajek, E. E., Megeath, S. T., Myers, P. C., & Fazio, G. G. 2008, ApJ, 675, 1375 [ADS]
- Luhman et al. (2003) Luhman, K. L., Stauffer, J. R., Muench, A. A., Rieke, G. H., Lada, E. A., Bouvier, J., & Lada, C. J. 2003, ApJ, 593, 1093 [ADS]
- Luhman et al. (2006) Luhman, K. L., Whitney, B. A., Meade, M. R., Babler, B. L., Indebetouw, R., Bracker, S., & Churchwell, E. B. 2006, ApJ, 647, 1180 [ADS]
- Lynden-Bell & Pringle (1974) Lynden-Bell, D. & Pringle, J. E. 1974, MNRAS, 168, 603 [ADS]
- Mamajek et al. (2004) Mamajek, E. E., Meyer, M. R., Hinz, P. M., Hoffmann, W. F., Cohen, M., & Hora, J. L. 2004, ApJ, 612, 496 [ADS]
- Masset et al. (2006) Masset, F. S., Morbidelli, A., Crida, A., & Ferreira, J. 2006, ApJ, 642, 478 [ADS]
- McCaughrean & O’dell (1996) McCaughrean, M. J. & O’dell, C. R. 1996, AJ, 111, 1977 [ADS]
- Monin et al. (2007) Monin, J.-L., Clarke, C. J., Prato, L., & McCabe, C. Protostars and Planets V, ed. , B. ReipurthD. Jewitt & K. Keil, 395–409 [ADS]
- Muzerolle et al. (2001) Muzerolle, J., Calvet, N., & Hartmann, L. 2001, ApJ, 550, 944 [ADS]
- Muzerolle et al. (2005) Muzerolle, J., Luhman, K. L., Briceño, C., Hartmann, L., & Calvet, N. 2005, ApJ, 625, 906 [ADS]
- Najita et al. (2007) Najita, J. R., Carr, J. S., Glassgold, A. E., & Valenti, J. A. Protostars and Planets V, ed. , B. ReipurthD. Jewitt & K. Keil, 507–522 [ADS]
- Natta et al. (2000) Natta, A., Grinin, V., & Mannings, V. 2000, Protostars and Planets IV, 559 [ADS]
- Natta et al. (2006) Natta, A., Testi, L., & Randich, S. 2006, A&A, 452, 245 [ADS]
- Niedzielski et al. (2008) Niedzielski, A., Go’ zdziewski, K., Wolszczan, A., Konacki, M., Nowak, G., & Zieliński, P. 2008, ArXiv e-prints, (0810.1710) [ADS]
- Oliveira et al. (2005) Oliveira, J. M., Jeffries, R. D., van Loon, J. T., Littlefair, S. P., & Naylor, T. 2005, MNRAS, 358, L21 [ADS]
- Palla & Stahler (1999) Palla, F. & Stahler, S. W. 1999, ApJ, 525, 772 [ADS]
- Papaloizou & Pringle (1977) Papaloizou, J. & Pringle, J. E. 1977, MNRAS, 181, 441 [ADS]
- Pascucci et al. (2008) Pascucci, I., Apai, D., Hardegree-Ullman, E. E., Kim, J. S., Meyer, M. R., & Bouwman, J. 2008, ApJ, 673, 477 [ADS]
- Preibisch et al. (2002) Preibisch, T., Brown, A. G. A., Bridges, T., Guenther, E., & Zinnecker, H. 2002, AJ, 124, 404 [ADS]
- Preibisch et al. (2001) Preibisch, T., Guenther, E., & Zinnecker, H. 2001, AJ, 121, 1040 [ADS]
- Preibisch et al. (1998) Preibisch, T., Guenther, E., Zinnecker, H., Sterzik, M., Frink, S., & Roeser, S. 1998, A&A, 333, 619 [ADS]
- Preibisch & Zinnecker (1999) Preibisch, T. & Zinnecker, H. 1999, AJ, 117, 2381 [ADS]
- Rasio et al. (1996) Rasio, F. A., Tout, C. A., Lubow, S. H., & Livio, M. 1996, ApJ, 470, 1187 [ADS]
- Rebull et al. (2002) Rebull, L. M., Makidon, R. B., Strom, S. E., Hillenbrand, L. A., Birmingham, A., Patten, B. M., Jones, B. F., Yagi, H., & Adams, M. T. 2002, AJ, 123, 1528 [ADS]
- Rivera et al. (2005) Rivera, E. J., Lissauer, J. J., Butler, R. P., Marcy, G. W., Vogt, S. S., Fischer, D. A., Brown, T. M., Laughlin, G., & Henry, G. W. 2005, ApJ, 634, 625 [ADS]
- Sato et al. (2008a) Sato, B., Izumiura, H., Toyota, E., Kambe, E., Ikoma, M., Omiya, M., Masuda, S., Takeda, Y., Murata, D., Itoh, Y., Ando, H., Yoshida, M., Kokubo, E., & Ida, S. 2008a, PASJ, 60, 539 [ADS]
- Sato et al. (2008b) Sato, B., Toyota, E., Omiya, M., Izumiura, H., Kambe, E., Masuda, S., Takeda, Y., Itoh, Y., Ando, H., Yoshida, M., Kokubo, E., & Ida, S. 2008b, ArXiv e-prints, (0807.0268) [ADS]
- Scally & Clarke (2001) Scally, A. & Clarke, C. 2001, MNRAS, 325, 449 [ADS]
- Schwarz (1978) Schwarz, G. 1978, The Annals of Statistics, 6, 461 [LINK]
- Shatsky & Tokovinin (2002) Shatsky, N. & Tokovinin, A. 2002, A&A, 382, 92 [ADS]
- Sicilia-Aguilar et al. (2006a) Sicilia-Aguilar, A., Hartmann, L., Calvet, N., Megeath, S. T., Muzerolle, J., Allen, L., D’Alessio, P., Merín, B., Stauffer, J., Young, E., & Lada, C. 2006a, ApJ, 638, 897 [ADS]
- Sicilia-Aguilar et al. (2004) Sicilia-Aguilar, A., Hartmann, L. W., Briceño, C., Muzerolle, J., & Calvet, N. 2004, AJ, 128, 805 [ADS]
- Sicilia-Aguilar et al. (2006b) Sicilia-Aguilar, A., Hartmann, L. W., Fürész, G., Henning, T., Dullemond, C., & Brandner, W. 2006b, AJ, 132, 2135 [ADS]
- Sicilia-Aguilar et al. (2005) Sicilia-Aguilar, A., Hartmann, L. W., Hernández, J., Briceño, C., & Calvet, N. 2005, AJ, 130, 188 [ADS]
- Siess et al. (2000) Siess, L., Dufour, E., & Forestini, M. 2000, A&A, 358, 593 [ADS]
- Syer & Clarke (1995) Syer, D. & Clarke, C. J. 1995, MNRAS, 277, 758 [ADS]
- Walter et al. (1994) Walter, F. M., Vrba, F. J., Mathieu, R. D., Brown, A., & Myers, P. C. 1994, AJ, 107, 692 [ADS]
- White & Basri (2003) White, R. J. & Basri, G. 2003, ApJ, 582, 1109 [ADS]
- Young et al. (2006) Young, E. T., Teixeira, P. S., Lada, C. J., Muzerolle, J., Persson, S. E., Murphy, D. C., Siegler, N., Marengo, M., Krause, O., & Mainzer, A. K. 2006, ApJ, 642, 972 [ADS]
| Single | Binaries | |||
|---|---|---|---|---|
| Name | EW[H] | IR | EW[H] | IR |
| Taurus | 40/55=72% | 42/55=76% | 33/50=66% | 37/50=74% |
| Upper Sco | 2/49= 4% | 2/53= 3% | 2/37= 5% | 1/42= 2% |
| Age | M | K | FG | BA | |||||
|---|---|---|---|---|---|---|---|---|---|
| Name | (Myr) | EW[H] | IR | EW[H] | IR | EW[H] | IR | EW[H] | IR |
| 1 Taurus | 1 | 42/55=76% | 50/67=75% | 24/40=60% | 24/40=60% | 2/4=50% | 1/2=50% | 2/3=67% | 2/2=100% |
| 2 Cha I | 2 | 37/107=35% | 46/87=53% | 13/23=57% | 9/13=69% | 2/2=100% | 1/2=50% | 1/2=50% | … |
| 3 IC 348 | 2.3 | 46/173=27% | 102/233=44% | 7/12=58% | 8/27=30% | 3/3=100% | 3/11=27% | … | 2/7=29% |
| 4 Tr 37 | 4 | 21/53=40% | 28/48=58% | 31/69=45% | 30/59=51% | 4/25=16% | 3/9=33% | 2/35=6% | 1/13=8% |
| 5 NGC 2362 | 5 | 4/86=5% | 7/65=11% | 2/35=6% | 2/35=6% | 0/4=0% | 0/5=0% | 0/7=0% | 0/7=0% |
| 6 OB1bc | 5 | 13/85=15% | 4/31=13% | 21/68=31% | 1/11=9% | 0/10=0% | 0/8=0% | 6/103=6% | 3/103=3% |
| 7 Upper Sco | 5 | 14/183=8% | 13/92=14% | 2/29=7% | 5/25=20% | 1/31=3% | 0/35=0% | 4/71=6% | 3/78=4% |
| 8 OB1a/25Ori | 8 | 3/68=4% | 1/38=3% | 4/23=17% | 2/8=25% | 1/1=100% | … | … | … |
| 9 NGC 7160 | 10 | 0/12=0% | 1/8=12% | 1/21=5% | 1/17=6% | 0/62=0% | 1/47=2% | 0/35=0% | 1/34=3% |
| Dist | MB1 (68%) | MB2 (20%) | MB3 (9%) | MB4 (3%) | |||||
|---|---|---|---|---|---|---|---|---|---|
| Name | (pc) | EW[H] | IR | EW[H] | IR | EW[H] | IR | EW[H] | IR |
| 1 Taurus | 140 | 3/4=75% | 7/13=54% | 31/42=74% | 34/45=76% | 27/41=66% | 27/41=66% | 5/10=50% | 5/7=71% |
| 2 Cha I | 165 | 13/52=25% | 21/47=45% | 19/39=49% | 14/22=64% | 11/20=55% | 7/11=64% | 4/6=67% | 2/3=67% |
| 3 IC 348 | 320 | 21/96=22% | 52/125=42% | 12/41=29% | 21/54=39% | 6/16=38% | 7/32=22% | 4/4=100% | 6/18=33% |
| 4 Tr 37 | 900 | … | … | 17/38=45% | 23/33=70% | 34/89=38% | 34/75=45% | 7/50=14% | 5/19=26% |
| 5 NGC 2362 | 1500 | 1/7=14% | 0/3=0% | 2/67=3% | 5/51=10% | 3/43=7% | 4/43=9% | 0/14=0% | 0/14=0% |
| 6 OB1bc | 440 | 0/4=0% | 1/3=33% | 11/72=15% | 3/26=12% | 21/77=27% | 1/12=8% | 7/93=8% | 3/92=3% |
| 7 Upper Sco | 145 | 7/103=7% | 9/50=18% | 7/73=10% | 5/43=12% | 3/31=10% | 3/28=11% | 2/92=2% | 3/96=3% |
| 8 OB1a/25Ori | 322 | 0/11=0% | 0/7=0% | 1/43=2% | 1/29=3% | 7/38=18% | 2/10=20% | … | … |
| 9 NGC 7160 | 900 | … | … | 0/12=0% | 1/8=12% | 1/38=3% | 1/27=4% | 0/80=0% | 2/71=3% |
| Name | EW[H] | IR | Common |
|---|---|---|---|
| 1 Taurus | 28.23 (10) | 75.74 (7) | 68.04 (6) |
| 2 Cha I | 83.48 (6) | 76.92 (3) | 100.00 (1) |
| 3 IC 348 | 100.00 (4) | 88.83 (18) | 100.00 (3) |
| 4 Tr 37 | 0.19 (50) | 10.58 (19) | 20.50 (17) |
| 5 NGC 2362 | 42.18 (14) | 31.24 (14) | 39.83 (14) |
| 6 OB1bc | 0.05 (77) | 39.23 (12) | 40.20 (12) |
| 7 Upper Sco | 10.13 (31) | 12.79 (28) | 14.41 (19) |
| 8 OB1a/25Ori | …(0) | …(0) | …(0) |
| 9 NGC 7160 | 32.20 (38) | 62.42 (27) | 28.13 (27) |