Asymmetric noise probed with a Josephson junction
Abstract
Fluctuations of the current through a tunnel junction are measured using a Josephson junction. The current noise adds to the bias current of the Josephson junction and affects its switching out of the supercurrent branch. The experiment is carried out in a regime where switching is determined by thermal activation. The variance of the noise results in an elevated effective temperature, whereas the third cumulant, related to its asymmetric character, leads to a difference in the switching rates observed for opposite signs of the current through the tunnel junction. Measurements are compared quantitatively with recent theoretical predictions.
pacs:
72.70.+m, 85.25.Cp, 73.23.-b, 74.50.+rThe current through voltage-biased electrical conductors exhibits fluctuations, which, in contrast to equilibrium Johnson-Nyquist noise, are not symmetric with respect to the average current. This translates into finite odd cumulants in the distribution of the number of electrons transfered through the conductor in a given time. Whereas the full counting statistics of this number can be calculated for arbitrary conductors Levitov ; Nazarov , up to now high order cumulants have been measured in very few experiments. The third cumulant has been successfully accessed by signal processing the time-dependent current Reulet ; Bomse ; Gershon , but with set-ups that are restricted either to low impedance samples, which leads to large environmental effects Reulet , or to low frequencies Bomse ; Gershon . Another strategy, put forward by Tobiska and Nazarov Tobiska , consists in using a Josephson junction (JJ) as a large bandwidth on-chip noise detector Timofeev ; Peltonen ; Huard . It has a high intrinsic sensitivity, and can be coupled to noise sources over a large range of impedances. The detection principle relies on the exponential current sensitivity of the switching of a JJ from a metastable zero-voltage branch to a dissipative one. When biased at a current slightly below its critical current the rate of switching is therefore very sensitive to noise in the current. The first detection of asymmetric noise with a JJ was reported in Refs. Timofeev ; Peltonen . However, the detector JJ, which was placed in an inductive environment, had a very large plasma frequency, and the dynamics of the junction changed regime as the noise intensity increased, from macroscopic quantum tunneling (MQT) to retrapping Melnikov through thermal activation. The measured asymmetry in the escape rates could only be compared to an adiabatic model Comparison , using empirical parameters. For a detector to be of practical use it must have a well characterized and a simple enough response, so that information on the noise can be reliably extracted. As quantitative theories have been developed for a JJ in the thermal regime placed in a resistive environment Ankerhold ; Sukhorukov ; Grabert , we designed an experiment in this framework, allowing for a detailed, quantitative comparison with theory.
The principle of our experiment is to add the current noise from a noise source to the DC bias current of a JJ (see Fig. 1). The dynamics of a JJ placed in a resistive environment are described by the celebrated RCSJ model Barone , with the voltage related to the average velocity of a fictitious particle placed in a tilted washboard potential. The tilt of the potential is determined by the reduced parameter . At the potential presents local minima where the particle can be trapped. The voltage is then zero: this corresponds to the supercurrent branch. The frequency of small oscillations is called the plasma frequency Johnson-Nyquist current noise related to the finite temperature of the environment of the junction is modeled as a fluctuating force on the particle, which triggers escape from the local minimum (“switching”). When the switching rate is given by Kramer’s formula bookAnkerhold with for moderate quality factors , the plasma frequency in the tilted potential, the bare plasma frequency determined by the capacitance and critical current of the junction, with , and
| (1) |
Recently, this result was extended to the situation in which an additional delta-correlated noise , characterized by a finite third cumulant defined by and a second cumulant adds to current through the JJ Ankerhold ; Sukhorukov ; Grabert . The effect of higher order cumulants is assumed to be weak. The corresponding fluctuating force leads to a modification of the rate: The second cumulant yields an increased effective temperature given by
| (2) |
Here, is the parallel combination of all the resistances which produce Johnson-Nyquist noise across the junction. The resistance characterizes the friction acting on the fictitious particle and is, in a simple model, given by the total resistance across the junction, including both and the resistance of the noise source. This expression indicates that the second cumulant of noise from the noise source simply adds to the Johnson-Nyquist noise of the rest of the circuit. The third cumulant gives rise to the additional term
| (3) |
with a function of the tilt that depends on the quality factor Grabert . When reversing the sign of the average current through the noise source, remains unchanged whereas changes sign. Therefore, the departure from of the rate ratio
| (4) |
is a measure of non-symmetric noise
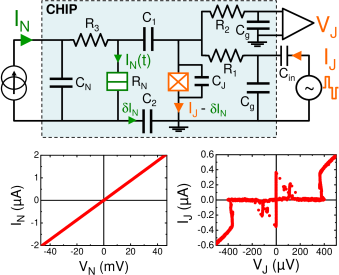
The experimental setup is shown schematically in Fig. 1. As it is well established that current noise through a tunnel junction is Poissonian ( and , with the electron charge), we use such a device (green double box) as a benchmark noise source. The detector JJ (orange crossed box) is coupled to it through capacitors and The finite frequency part of the current through the tunnel junction flows through the detector JJ, owing to the high-pass filter formed by and (dB point at MHz). The switching of the JJ current-biased at is signaled by the appearance of a voltage across it. The low plasma frequency of 1.5 GHz guarantees even at the lowest temperature of our experiment (20 mK) BW . In the relevant range of frequencies slightly below , numerical simulations of the actual circuit indicate that the quality factor of the Josephson oscillations is close to insuring an underdamped dynamics, and no effect of retrapping Melnikov ; Timofeev as long as
The sample was fabricated on a thermally oxidized high resistivity (103 to 10) Si wafer. All on-chip resistors are nm-thick Cr layers, with sheet resistance at 4 K, placed between mm-size pads. Capacitors were obtained from parallel aluminum films separated by 29 nm-thick sputtered silicon nitride as an insulator notesurHuard . The tunnel junction and the detector JJ were fabricated at the same time by shadow evaporation of 20 nm and 80 nm-thick aluminum films. Their current-voltage characteristics are shown in Fig. 1. The tunnel junction has an area of m2 and a tunnel resistance k It was biased at voltages larger than twice the superconducting gap mV (which corresponds to A), so that it behaves as a normal metal junction, with Poissonian noise. The detector JJ, with area m has a supercurrent A. It was biased in series with a resistor through a 50 coaxial line equipped with attenuators. When switching occurs at a supercurrent the voltage across the junction jumps to so that the current through it drops to zero and no quasiparticles are generated. Moreover, gold electrodes in good contact with the Al films were fabricated a few m away from the junctions in order to act as traps for spurious quasiparticles traps that could be excited by the high frequency noise. Apart from the Cr resistors and the Au traps, all conductors on the chip are superconducting aluminum films.
The sample was thermally anchored to the mixing chamber of a dilution refrigerator. The tunnel junction was biased by a floating voltage supply through two M resistors. The on-chip capacitance pF on the bias line is large enough to maintain the voltage across the tunnel junction at for all relevant frequencies. Escape rates of the JJ were measured using current pulses of duration with alternatively positive () and negative () amplitude, separated by 9 s. They were fed through a non-polarized capacitor F placed at room temperature, which prevents DC thermoelectric currents from unbalancing the pulses. The switching rates and for the two signs of were deduced from the switching probability measured as the fraction of the current pulses which led to a voltage pulse.
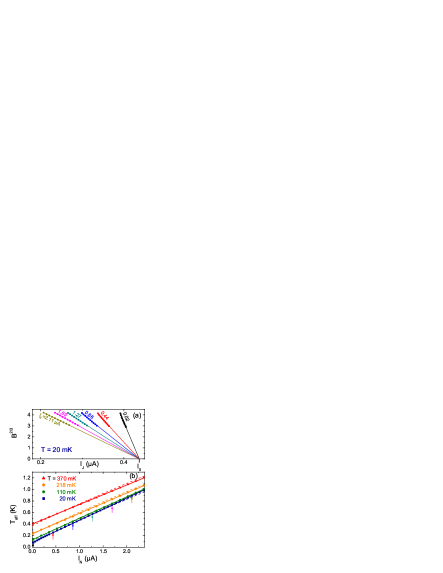
We first demonstrate that the switching of the detector junction is well described by the model of thermal activation whatever the current in the noise source. Figure 2(a) shows, for various currents the dependence of Data fall on straight lines that extrapolate to for , as expected from Eq. (1). This allows us to extract an effective temperature whose dependence on is shown in Fig. 2(b), with data taken at four different base temperatures We do find a linear dependance with correct extrapolations at (values slightly above are attributed to imperfect filtering), as expected from Eq. (2) with . Understanding the slope quantitatively requires an accurate model of the actual circuit at microwave frequencies: the RCSJ model assumes that the JJ is simply connected to a capacitor, a resistance and a current source, in parallel. In the limit which describes friction, has to be replaced with with the total admittance of the circuit across the JJ. Microwave simulations indicate that varies almost linearly from 63 at 1 GHz to 36 at 1.5 GHz, and that a current through the tunnel junction leads to a current through the detector JJ, with a transfer function varying from 1.1 at 1 GHz to 1.27 at 1.5 GHz. Since escape is determined essentially by the noise at we replace by . Altogether, the prediction is in agreement with the data (see dashed lines in Fig. 2; to fit the 20 mK-data, we used mK), apart from the slight change in slope when varying which could be attributed to variations in the kinetic inductance of the superconducting electrodes.
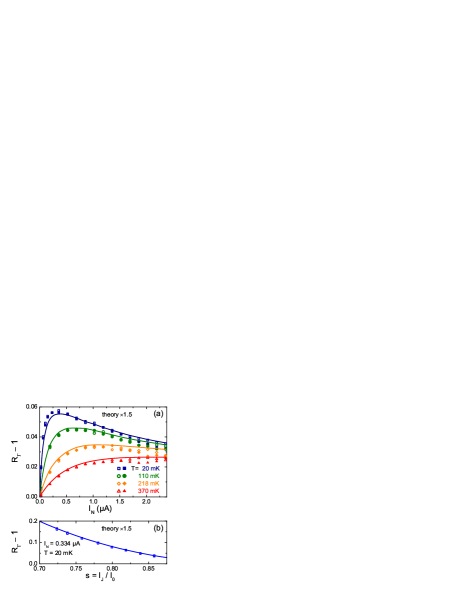
We now discuss the effect of noise asymmetry. The plots for opposite signs of the current through the noise source are undistinguishable within the symbol size, demonstrating that the effect of the second cumulant is dominant. In the limit , theory predicts that the effect of is to shift the curves by , which is difficult to measure reliably notesurP . In our experiment, we measured directly the asymmetry ratio defined by Eq. (4), which varies by several % (see Fig. 3). We first set the amplitude of the current pulses at a value corresponding to a switching probability for which the statistical precision on the rates is good correctionSQRT2 . We then measured times and , with alternatively and through the noise source. This allows for two independent measurements of and sign . In Fig. 3(a), we show with full and open symbols the corresponding measurements. The rate ratio differs from a signature of asymmetric noise, as soon as . The statistical uncertainty on is smaller than the symbols. Small differences between and , in particular around A, are not understood. As for the comparison with theory, a difficulty arises because of the frequency dependence of the transfer function , which results in a colored third cumulant at the detector In the following, and in the absence of indication as to which frequencies are important, we compare however with the only existing theory, which assumes white noise (). The corresponding predictions, Eqs. (3,4) with notegamma , are shown as solid lines in Fig. 3(a), scaled by an arbitrary factor 1.5. exhibits a maximum as a function of due to the opposite variations of and with For we used interpolations between the measured values shown in Fig. 2. When scaled up by 1.5, which might be due to frequency dependent transmission (), theory accounts well for the experimental data. Feedback corrections due to the detector, described in Sukhorukov , are neglected since Grabert . Note that there is no feedback associated to the series resistance like in Ref. Reulet because the current noise associated to does not flow through the noise source, but through the detector JJ. In Fig. 3(b), we also compare with theory the dependence of . In order to perform this measurement, we used pulses of various durations (0.53 to 21 s), which allows to obtain the switching rates at different values of For the longest pulses, the rate asymmetry is as large as 16%. Here also, theory scaled by 1.5 accounts precisely for the data.
Qualitative agreement between experiment and theory gives confidence for the use of the JJ as a measuring device for even if the application to a wider range of systems requires some theory for colored noise. A limitation concerns situations with strong non-linearities in the voltage dependence of the cumulants, where feedback effects could become sizeable gap ; Urban . For quantitative measurements of on other systems, it is not only important to tune the plasma frequency of the junction in the GHz range as done in this work, but also to improve the microwave design, in particular with more compact electrodes, so as to avoid frequency dependent factors in the analysis. Proposals to access the full counting statistics with a JJ embedded in more complex circuits Tobiska remain to be investigated.
Acknowledgements.
We acknowledge technical support from Pascal Senat and Pief Orfila, and discussions with B. Huard, H. Grabert, B. Reulet, J. Ankerhold, and within the Quantronics group. Work supported by ANR contracts Electromeso and Chenanom, and Region Ile-de-France for the nanofabrication facility at SPEC. N.O.B. acknowledges support by NSF grant DMR-0705213.References
- (1) L. Levitov and G. Lesovik, JETP Lett. 55, 555 (1992).
- (2) Y. Nazarov, Ann. Phys. (Leipzig) 16, 720 (2007).
- (3) B. Reulet, J. Senzier and D.E. Prober, Phys. Rev. Lett. 91, 196601 (2003).
- (4) Yu. Bomze et al., Phys. Rev. Lett. 95, 176601 (2005).
- (5) G. Gershon et al., Phys. Rev. Lett. 101, 016803 (2008).
- (6) J. Tobiska and Yu.V. Nazarov, Phys. Rev. Lett. 93, 106801 (2004).
- (7) A.V. Timofeev et al., Phys. Rev. Lett. 98, 207001 (2007).
- (8) J.T. Peltonen et al., Physica E 40, 111 (2007).
- (9) B. Huard et al., Ann. Phys. (Leipzig) 16, 736 (2007).
- (10) V.I. Mel’nikov, Phys. Rep. 209, 1 (1991).
- (11) In the regime of thermal activation, the predictions of this adiabatic model disagree by a factor 6 with those of the complete theories of Ref. Ankerhold ; Sukhorukov ; Grabert .
- (12) J. Ankerhold, Phys. Rev. Lett. 98, 036601 (2007); ibid., 99, 139901 (2007).
- (13) E.V. Sukhorukov and A.N. Jordan, Phys. Rev. Lett. 98, 136803 (2007).
- (14) H. Grabert, Phys. Rev. B 77, 205315 (2008). We corrected for a minus sign missing in Eqs. (78,92).
- (15) A. Barone and G. Paterno, Physics and Applications of the Josephson Effect (Wiley, New York, 1982).
- (16) For a review, see J. Ankerhold, Quantum Tunneling in Complex Systems (Springer, Berlin, 2007).
- (17) The asymmetry signal increases with the detection bandwidth determined by However, it becomes more difficult to achieve a frequency-independent coupling.
- (18) The results of the experiment described in Ref. Huard were presumably dominated by a leakage in capacitors.
- (19) P. Joyez et al., Phys. Rev. Lett. 72, 2458 (1994).
- (20) In Ref. Timofeev , the effect of was detected as the shift . According to theory and using the parameters given by the authors, the expected shift would have been much larger than observed, had the thermal activation regime been achieved.
- (21) The expression for the uncertainty on in Ref. Huard should be divided by
- (22) The signs in front of account for the fact that in our setup, the noise current subtracts from the bias current.
- (23) This analytical expression interpolates between the results of numerical calculations of performed for 5 and in the working interval along the lines of Ref. Grabert (H. Grabert, private communication).
- (24) In measurements with the noise source biased near where the characteristic is very non-linear, we found strong asymmetries in the switching rates.
- (25) D.F. Urban and H. Grabert, arXiv:0810.2938.