Heavy Ion-Beam Driven Isentropic Compression Experiments
Abstract
A new design for heavy-ion beam driven isentropic compression experiments is suggested and analysed. The proposed setup utilises the long stopping ranges and the variable focal spot geometry of the high-energy uranium beams delivered at the GSI Helmholtzzentrum für Schwerionenforschung and Facility for Antiproton and Ion Research accelerator centers in Darmstadt, Germany, to produce a planar ramp loading of various samples. In such experiments, the predicted high pressure amplitudes (up to 10 Mbar) and short timescales of compression (below 10 ns) will allow to test the time dependent material deformation phenomena at unprecedented extreme conditions.
pacs:
62.50.-p, 64.60.A-, 52.50.GjResearch carried out in astrophysics, planetary and material sciences seek a thorough understanding of the behavior of matter at high pressures. For example, the equation of state (EOS) of iron under pressures of 1–4 Mbar is crucial in order to determine the state of the Earth’s core Laio et al. (2000); Belonoshko et al. (2003); Boehler (2000). EOS data around 0.1 Mbar is required to establish the state and the composition in Earth’s lower mantle Boehler (2000); Zhang and Weidner (1999), while the dynamics of the processes in the mantle is considered to be dependent on the structural phase transformation kinetics Solomatov and Stevenson (1994). The pursuit after materials for technological applications McMillan (2002) also entails a detailed understanding of the kinetics of the high-pressure phase transitions. Modelling the physical processes during the projectile impact relevant to meteoroid protection and crater formation O’Keefe and Ahrens (1999) requires the dynamical response of solids at ultrahigh strain rates. Hydrogen EOS at high pressures are especially important for understanding the structure and evolution of the hydrogen-bearing astrophysical objects such as the giant planets like Saturn and Jupiter Guillot (1999); Sauman et al. (2000) as well as for the inertial fusion energy research Atzeni and Meyer-ter Vehn (2004); Lindl et al. (2004).
The technique of isentropic compression using ramp wave loading (RWL) Reisman et al. (2000); Hayes (2001); Reisman et al. (2002); Hayes et al. (2004); Rothman et al. (2005); Davis (2006); Chhabildas and Barker (1986); Barnes et al. (1974); Lorenz et al. (2004, 2005); Swift and Johnson (2005); Smith et al. (2007) allows one to sample EOS data along an isentrope up to several Mbar pressures, located on the phase diagram between the parameter regions accessible in diamond anvil cell Weir et al. (1959); Jayarama (1986) and shock wave McQueen et al. (1984); Neal (1976) experiments. Unlike a shock wave experiment where a single point on a shock adiabat is obtained, in isentropic compression experiments a continuous set of data points is recorded and the solid state of a sample is ensured up to high pressures. RWL technique was also shown to be a more sensitive tool for studying the dynamics of ultrafast structural phase transformations than the shock-wave based Smith et al. (2008); Bastea et al. (2005); Dolan et al. (2007) methods.
| [GeV/u] | [ns] | D | d | |||
|---|---|---|---|---|---|---|
| (a) | 2.7 | 50 | 0.2 | 0.1 | ||
| (b) | 2.7 | 100 | 0.5 | 0.1 | ||
| (c) | 0.2 | 100 | 0.5 | 0.2 | ||
| (d) | 0.35 | 100 | 0.2 | 0.2 | ||
| (e) | 2.7 | 50 | 0.2 | 0.1 | ||
| (f) | 2.7 | 50 | 0.2 | 0.05 | ||
| (g) | 2.7 | 100 | 0.5 | 0.1 | ||
| (h) | 0.2 | 50 | 0.5 | 0.075 |
RWL has been demonstrated with different drivers, such as magnetic pulse loading using high-current pulsed power generators Reisman et al. (2000); Hayes (2001); Reisman et al. (2002); Hayes et al. (2004); Rothman et al. (2005); Davis (2006), high-power lasers Lorenz et al. (2004, 2005); Swift and Johnson (2005); Smith et al. (2007), and gas guns Chhabildas and Barker (1986) or high explosives Barnes et al. (1974) using graded density impactors. The typical loading times with these drivers are 10 ns, 100 ns and 1 s, respectively. In this Letter, a new scheme for planar isentropic compression experiments using an intense heavy ion beam as a driver is proposed and analysed. The long absorption range and the variable focal spot size and shape of energetic ion beams allows one to design isentropic compression experiments with fairly planar geometry. The beam parameters needed to generate pressures of up to 4 Mbar in aluminium and 7 Mbar in iron are well within the reach of the uranium beams that will be delivered at the new Facility for Antiproton and Ion Research (FAIR) which is being built in Darmstadt. The beam intensities needed to generate pressures approaching 1 Mbar shall become available with the completion of the high-current upgrade of the SIS-18 heavy ion synchrotron of the GSI Helmholtzzentrum für Schwerionenforschung in Darmstadt Spiller et al. (2006) in the year 2009. In RWL experiments with intense ion beams, the typical compression times from zero to the maximum pressure are about 20 ns for the aluminium and about 10 ns for the iron samples considered here, which is comparable with the dissipative relaxation times of aluminium and iron Swegle and Grady (1985); Boettger and Wallace (1997). Resent laser-driven experiments Smith et al. (2007) have demonstrated that at such short time scales there exists a stiffer response than had been expected from previous slower ramp compression experiments and from models based on either static or shock-wave experiments.
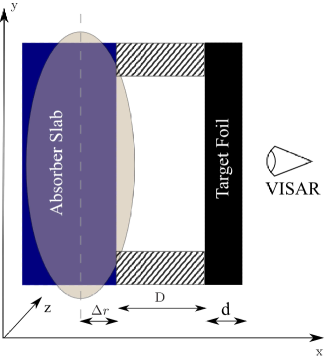
The layout of the experiment is shown in Fig. 1. The ion beam with an elliptical focal spot and Gaussian transverse intensity distribution heats an absorber slab along its surface. Lead is chosen as the absorber material. Since the stopping ranges of energetic 238U ions in lead absorber are much larger than the length of the absorber slab, the latter is heated uniformly along the axis. The focal spot size and its aspect ratio can be varied, what allows for generation of a quasi-planar ramp wave. In the similar manner as in the laser-driven ramp compression or shock wave experiments Smith et al. (2007), a stepped target with rather wide steps along direction can be used.
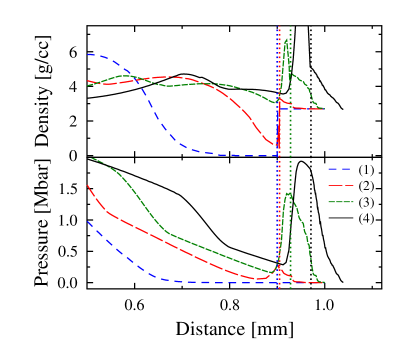
Similarly to laser-driven RWL experiments Lorenz et al. (2004), the process of the ion beam driven RWL consists of three distinct phases. First, the ion beam evaporates the absorber material off its surface or unloads the material due to a shock wave generated inside the absorber, depending on the beam intensity, focal spot size and the distance between the beam’s axis and the absorber surface. At the next stage, the absorber’s material expands into the vacuum gap. The adjustable displacement of the beam axis relative to the absorber surface allows for some degree of control over the plasma expansion regime. In the last stage, the absorber’s plasma piles up against the target foil thus producing a smoothly increasing pressure load in the sample. The evolution of the compression wave launched into the sample is shown in Fig. 2. One can see that the compression wave gradually steepens with the distance traveled before it breaks into a shock wave. This distance determines the maximal allowed thickness of the target foil.
Provided the compression wave launched into the sample does not break into a shock wave, the pressure and density history at the front surface of the sample can be reconstructed using the bootstrap back integration method Hayes (2001). The method uses the rear surface velocity history as an initial condition for a Riemann solver.
The major benefit of the proposed experimental design as compared to other approaches for EOS measurement with heavy ion beams Arnold et al. (1982); Hoffmann et al. (2002) is twofold. Firstly, the EOS along a compression adiabat can be determined by measuring only one parameter — the rear surface velocity employing a line-imaging VISAR as the principal diagnostics. Secondly, this design does not rely on detailed knowledge of the beam-matter interaction processes like the stopping power, since the beam energy is not deposited into the sample directly Grinenko et al. (2008) but is converted to the kinetic energy of the absorber material. In order to interpret and use the results of the experiment one therefore does not have to precisely measure the transverse distribution of the beam intensity at the focal plane, which can be problematic for intense focused heavy ion beams Varentsov et al. (2008). Moreover, the presented design has also an important advantage that the target is not being preheated by energetic secondary particles and projectile fragments produced during the interaction of the beam with the absorber material. Furthermore, this approach requires neither high accuracy of the beam-target alignment, nor good short-to-shot reproducibility of the beam parameters.
Parameters of the beam and the target geometries considered in this work are summarised in Table 1. The cases (a),(e) and (b),(f) in the table correspond to the beam parameters of the SIS-100 synchrotron to be available at FAIR H. H. Gutbrod (2006) (ed.), the cases (c),(g) correspond to the beams that will be available after completion of the SIS-18 upgrade Spiller et al. (2006), and the cases (d),(h) correspond to the present SIS-18 beam available for high energy density physics experiments Varentsov et al. (2008, 2006). A lead absorber slab of 400 m thickness was considered for all the analysed cases. The geometric parameters of the target have been adjusted to guarantee the planarity of the ramp compression wave propagating in the direction for at least m, and to ensure a shockless compression of the target. The planarity of the designed experiment justifies a one dimensional analysis using the 1D hydrodynamic simulation code Grinenko (2009).
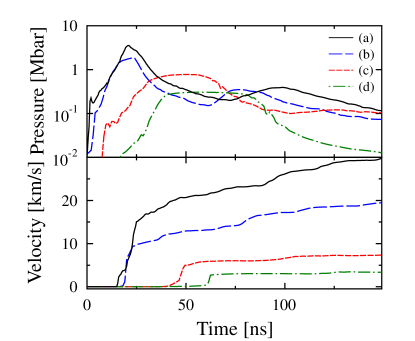
The calculated histories of the pressure at the front and the velocity at the rear surfaces of the aluminium samples are shown in Fig. 3. The planarity of the compression wave can be adjusted by varying the ion beam extension in the direction. However, this also affects the level of specific energy density deposited by the beam in the absorber. Two possible beam cross sections are compared: in the case (a) the FWHM height of the beam spot is 0.5 mm, whereas in the case (b) — 1 mm. Increasing the height of the beam spot allows one to increase the vacuum gap which enhances the smoothness of the loading without loosing in the planarity. The curves corresponding to these two cases indicate that the enhancement of the smoothness of the loading compromises the amplitude of the compression: the maximum pressure corresponding to case (a) is about 3.5 Mbar, whereas in case (b) it is only about 2 Mbar. The maximum pressure that one can obtain using upgraded SIS-18 beam (c) is about 1 Mbar and the currently available SIS-18 beam (d) can isentropically load aluminium up to 500 kbar.
The strain rate is approximately at the peak pressure of about 2 Mbar in the examined case (b) (see Table 1). The corresponding time to the maximum compression is approximately 20 ns, which is comparable to the rise time of low-stress steady shock Swegle and Grady (1985). The laser RWL experiments by Smith et al. Smith et al. (2007) at similar compression times and strain rates have demonstrated a stiffening of the stress-strain response. Using ion beams, the adjustable ion pulse duration, focal spot size and the depth of the ion beam in the absorber allow a degree of control over the compression time, amplitude and strain rate. This provides a unique tool to carry out parametric studies of the stress-strain response.
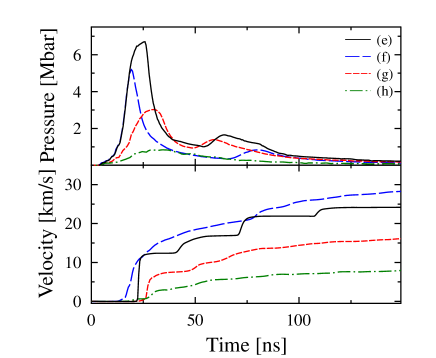
A similar analysis has been carried out for iron samples (Table 1). The corresponding histories of the front face pressure and rear face velocity are shown in Fig. 4. One can see that a Mbar pressure loading is within the rich of the existing SIS-18 beam, whereas the upgrade of the machine can provide the compression data of up to about 3 Mbar in the nearest future. Up to 6 Mbar pressures will be generated in the corresponding experiments at FAIR with extremely high strain rates of the order of
The curves (e) and (f) in Fig. 4 demonstrate the differences between the velocity traces in case of shock and adiabatic compression, respectively. In order to ensure shockless loading, the sample’s thickness had to be reduced from 100 m as in the case (e) to 50 m as in the case (f). Obviously, decreasing the sample’s thickness causes the motion of the sample’s rear surface to start earlier. This motion acts to release the pressure of the absorber’s material piling up at the front surface of the sample and to reduce the pressure amplitude in the target. Therefore, a compromise should be devised to ensure the adiabatic character of the compression on one side, and to obtain the highest possible pressure on the other.
The capabilities of the high-energy heavy ion beam accelerators available at GSI and later at FAIR to drive planar isentropic compression of solids were analysed. It was shown that the time scales of the loading are comparable with the fastest laser drives Lorenz et al. (2004); Smith et al. (2007), and the amplitudes of pressure surpass those obtained using the high-power magnetic drives Davis (2006). These features allow to investigate the dynamical response of solids in the regime of previously unattainable parameters and possibly the dynamics of the pressure-induced structural phase transformations Smith et al. (2008); Bastea et al. (2005); Dolan et al. (2007). Moreover, ramp loading with pressures higher than 0.1 Mbar can be obtained in multy-layer targets Dolan et al. (2007) using the currently existing SIS-18 ring for the purpose of studying the pressure induced phase transformations in water.
Support from EPSRC and INTAS is gratefully acknowledged.
References
- Laio et al. (2000) A. Laio, S. Bernard, G. L. Chiarotti, et al., Science 287, 1027 (2000).
- Belonoshko et al. (2003) A. B. Belonoshko, R. Ahuja, and B. Johansson, Nature 424, 1032 (2003).
- Boehler (2000) R. Boehler, Rev. of Geophys. 38, 221 (2000).
- Zhang and Weidner (1999) J. Zhang and D. J. Weidner, Science 284, 782 (1999).
- Solomatov and Stevenson (1994) V. S. Solomatov and D. J. Stevenson, Earth Planet. Sci. Lett. 125, 267 (1994).
- McMillan (2002) P. F. McMillan, Nature Materials 1, 19 (2002).
- O’Keefe and Ahrens (1999) J. D. O’Keefe and T. J. Ahrens, J. Geophys. Res. 104, 27091 (1999).
- Guillot (1999) T. Guillot, Science 286, 72 (1999).
- Sauman et al. (2000) D. Sauman, G. Chabrier, D. J. Wagner, et al., High Press. Res. 16, 331 (2000).
- Atzeni and Meyer-ter Vehn (2004) S. Atzeni and J. Meyer-ter Vehn, The Physics of Inertial Fusion (Clarendon Press, Oxford, 2004).
- Lindl et al. (2004) J. D. Lindl, P. A. Richard, L. Berger, et al., Phys. Plasmas 11, 339 (2004).
- Reisman et al. (2000) D. B. Reisman, A. Toor, R. C. Cauble, et al., J. Appl. Phys. 89, 1625 (2000).
- Hayes (2001) D. Hayes, Sandia Report SND2001-1440 (2001).
- Reisman et al. (2002) R. C. D. B. Reisman, J. R. Asay, C. A. Hall, et al., J. Phys.: Condens. Matter 14, 10821 (2002).
- Hayes et al. (2004) D. B. Hayes, C. A. Hall, J. R. Asay, et al., J. Appl. Phys. 96, 5520 (2004).
- Rothman et al. (2005) S. D. Rothman, J. P. Davis, J. Maw, et al., J. Phys. D: Appl. Phys. 38, 733 (2005).
- Davis (2006) J. P. Davis, J. Appl. Phys. 99, 103512 (2006).
- Chhabildas and Barker (1986) L. C. Chhabildas and L. M. Barker, Sandia Report SAND86-1888 (1986).
- Barnes et al. (1974) J. F. Barnes, P. J. Blewett, R. G. McQueen, et al., J. Appl. Phys. 45, 727 (1974).
- Lorenz et al. (2004) J. E. K. T. Lorenz, B. A. Remington, S. Pollaine, et al., Phys. Rev. Lett. 92, 075002 (2004).
- Lorenz et al. (2005) K. T. Lorenz, M. J. Edwards, S. G. Glendinning, et al., Phys. Plasmas 12, 056309 (2005).
- Swift and Johnson (2005) D. C. Swift and R. P. Johnson, Phys. Rev. E 71, 066401 (2005).
- Smith et al. (2007) R. F. Smith, J. H. Eggert, A. Jankowski, et al., Phys. Rev. Lett. 98, 065701 (2007).
- Weir et al. (1959) C. E. Weir, E. R. Lippincott, A. V. Valkenburg, et al., J. Res. Natl. Bur. Stand. 63A, 55 (1959).
- Jayarama (1986) A. Jayarama, Rev. Sci. Instrum. 57, 1013 (1986).
- McQueen et al. (1984) R. G. McQueen, J. N. Fritz, and C. E. Morris, in Shock Waves in Condensed Matter, edited by J. R. Asay, R. A. Graham, and G. K. Straub (Elsevier, Amsterdam, 1984), pp. 95–98.
- Neal (1976) T. Neal, Phys. Rev. B 14, 5172 (1976).
- Smith et al. (2008) R. F. Smith, J. H. Eggert, M. D. Saculla, et al., Phys. Rev. Lett. 101, 065701 (2008).
- Bastea et al. (2005) M. Bastea, S. Bastea, J. A. Emig, et al., Phys. Rev. B 71, 180101 (2005).
- Dolan et al. (2007) D. H. Dolan, M. D. Knudson, C. A. Hall, et al., Nature Physics 3, 339 (2007).
- Spiller et al. (2006) P. J. Spiller, W. Barth, L. Dahl, et al., in Proc. of European Part. Accel. Conf. EPAC (Edinburgh, Scotland, 2006), p. 24.
- Swegle and Grady (1985) J. W. Swegle and D. E. Grady, J. Appl. Phys. 58, 692 (1985).
- Boettger and Wallace (1997) J. C. Boettger and D. C. Wallace, Phys Rev. B. 55, 2840 (1997).
- Arnold et al. (1982) R. Arnold, E. Colton, S. Fenster, et al., Nucl. Instr. and Meth. 199, 557 (1982).
- Hoffmann et al. (2002) D. H. H. Hoffmann, V. E. Fortov, I. V. Lomonosov, et al., Phys. Plasmas 9, 3651 (2002).
- Grinenko et al. (2008) A. Grinenko, D. O. Gericke, S. H. Glenzer, et al., Phys. Rev. Lett. 101, 194801 (2008).
- Varentsov et al. (2008) D. Varentsov, A. D. Fertman, V. I. Turtikov, et al., Contrib. Plasma Phys. 48, 586 (2008).
- H. H. Gutbrod (2006) (ed.) H. H. Gutbrod (ed.), FAIR Baseline Technical Report, GSI (2006), URL http://www.gsi.de/fair/reports/btr.html.
- Varentsov et al. (2006) D. Varentsov, V. Y. Ternovoi, M. Kulish, et al., Nucl. Instr. and Meth. A 577, 262 (2006).
- Grinenko (2009) A. Grinenko, Nuc. Instr. and Meth. in Phys. Res. (2009), accepted for publication.