An Analysis of the Japanese Credit Network
Abstract
An analysis of the Japanese credit market in 2004 between banks and quoted firms is done in this paper using the tools of the networks theory. It can be pointed out that: (i) a backbone of the credit channel emerges, where some links play a crucial role; (ii) big banks privilege long-term contracts; the “minimal spanning trees” (iii) disclose a highly hierarchical backbone, where the central positions are occupied by the largest banks, and emphasize (iv) a strong geographical characterization, while (v) the clusters of firms do not have specific common properties. Moreover, (vi) while larger firms have multiple lending in large, (vii) the demand for credit (long vs. short term debt and multi-credit lines) of firms with similar sizes is very heterogeneous.
JEL: E51, E52, G21
Keywords: Banks-firms credit, Credit topology, Short-long term loans, Complex network
Correspondence:
Yoshi Fujiwara,
ATR Laboratories, MIS,
Kyoto 619-0288, Japan.
tel: +81-774-95-1404 / fax: +81-774-95-1409 /
email: yoshi.fujiwara@gmail.com
† Also affliated with:
Kyoto University, Kyoto, Japan
I Introduction
Debt-credit relationships between firms and banks have a long history in economics (Schumpeter, 1911). It has been widely recognized since Debreu (1959) that integrating money in the theory of value represented by the General Equilibrium model is problematic at best. No economic agent can individually decide to monetize alone; monetary trade should be the equilibrium outcome of market interactions among optimizing agents. The use of money — a common medium of exchange and a store of value — implies that one party to a transaction gives up something valuable (for instance, his endowment or production) for something inherently useless (a fiduciary token for which he has no immediate use) in the hope of advantageously re-trading it in the future. Since credit makes sense only if agents can sign contracts in which one side promises future delivery of goods or services to the other side, markets for debt in equilibrium are meaningless. A non-mainstream approach to cope with the financial stability based on the understanding of debt-credit relationships between heterogeneous interacting agents is strongly required.
This point of heterogeneity is linked to the existence of some underlying autocatalytic process at a lower level of the system. An autocatalytic process is a dynamic process in which the growth of a quantity is to some extent self-perpetuating, as in the case when it is proportional to its initial value. The existence of an autocatalytic process implies that looking at the average, or most probable, behavior of the constituent units is non-representative of the dynamics of the system: “autocatalyticity insures that the behavior of the entire system is dominated by the elements with the highest auto-catalytic growth rate rather than by the typical or average element” (Solomon, 2007). In the presence of autocatalytic processes, even a small amount of individual heterogeneity invalidates any description of the behavior of the system in terms of its “average” element: the real world is controlled as much by the tails of distributions as by means or averages. We need to free ourselves from average thinking (Anderson (1997) in the context of statistical physics; Brock (1999) in that of economics; see also Mantegna and Stanley (2000)).
The purpose of this paper is to investigate the structure and heterogeneity of debt-credit relationships by applying the recently developed tools of network analysis to an empirical data of Japanese debt-credit network to a nation-wide scale. This investigation is quite relevant to financial stability issues; for instance, the failure of a firm heavily indebted with a bank may produce important consequences on the balance sheet, or the financial status, of the bank itself. If a bank’s supply of credit is depleted, total supply of loans is negatively affected and/or the rate of interest increases, thus transferring the adverse shock to the other firms. Therefore, the study of structure of the links and their weights allows to gain some insights in the financial stability of the economic system and to develop new economic policy tools.
Let us first briefly review the literature mainly based on traditional methodologies. The exploration of the structure of credit relationships among banks and firms recently acquired increasing importance. The availability of new and large data sets allowed researchers to analyze the number of credit relationships between firms and banks in different years and countries (see Diamond, 1984, Ongena and Smith, 2000, for example). These studies show that, except for a few cases of very cash-rich firms, internal financing is only limited; short-term and long-term loans play a crucial role in the investment expenditure of the economic system in most developed countries.
An important aspect is the empirical analysis on the single vs. multiple banks-firms credit relationships (Agarwal and Elston, 2001; Farinha and Santos, 2002; and Ogawa et al., 2007) that are based on cross-country comparisons. One can observe the presence of two paradigmatic examples and many intermediate cases, i.e. the bank oriented example of Germany, Italy and Japan (e.g. less than 3% of Italian firms have single bank relationships), characterized by a close firm-bank relationship, and the market oriented paradigm of the Anglo-Saxon system (e.g., in the UK, 25% of firms maintain only one bank relationship). Other countries, such as the EU ones, are in the middle range between these two cases.
In institution-oriented countries, quite often a single firm may be influenced by the so-called inside bank. In these cases, the inside bank has a more favorable access to information about the actual financial condition of a particular firm. In the literature, a firm is defined as bank influenced when a particular bank owns more than 50% of the firm’s share or if the chair of the supervisory board is a banker (Agarwal and Elston, 2001). Even in Germany and Japan, where the main bank often plays a dominant role, firms subscribe loans contracts with other banks. Moreover, Sterken and Tokutsu (2002) states that the presence of a credit line with a main bank attracts more loans from other banks, signaling an asymmetric information problem.
Indeed, the theory of the optimal number of bank relationships gave gave a number of advantages and disadvantages in the choice of single and/or multiple relationships. On the firm side, a single bank relationship comes from the minimization of costs in transactions and monitoring, while the firm could benefit in a competing market of banks; this implies a growth in the number of relationships. Multiple banks lending guarantees the firm against the risk of liquidation. On the bank side, financing firms with multiple bank relationships allows to pool the risk of failure of firms. Single linkages, on the other hand, would give the bank greater control on the financial choices of the firm.
Moreover the tendency to multiple or single relationships changes in time, varying with internal and external conditions. There is evidences that some firms start with a single relationship and after some time they switch to multiple links in conditions of growth opportunities (Farinha and Santos, 2002). In particular conditions of financial distress, an evolution of the structure of the lending relationships can be observed: for instance, in Japan, during the bubble period, firms tended to rely on a single relationship (Ogawa et al., 2007).
Now let us turn our attention to the Japanese system of banks-firms credit relationships. In the presence of keiretsu, a terminology for industrial corporate groups, firms have a strong and long-lasting relationship with the so-called main bank (see Aoki and Patrick (1994) for a review). The firm is particularly dependent on the main bank for financing because of the information advantage over other potential lenders; this is particularly evident in conditions of financial turbulence (Spiegel and Yamori, 2003). Bank-influenced firms should enjoy increased access to capital through easier access to bank debt or preferential terms on loans, but on the other hand there may be some negative effects. Close relationships allow banks to have a major role in the corporate governance structure, like the representation of the bank on the firm’s supervisory board. Banks that handle the majority of new equity issues of the firm often place them among their customers, but on the other hand, they can influence the financial decisions of firms: in fact, in the case of firm distress, they can force firms to issue equity to pay bank debt.
The Japanese system is characterized by the presence of different types of banks: long-term credit banks, trust banks, city banks, regional banks, secondary regional banks and insurance companies. In particular long-term credit banks do not have affiliation with corporate groups and in-house credit analysis; trust banks have long-term credit to designed sectors and supplement city banks. In Japanese development after the Second World War, long-term credit banks played a crucial role because the financing of firms by issuing bonds had been strictly regulated (only after 1985 a few big firms were able to issue bonds). Institution-oriented markets have been extensively investigated. While in Germany banks-influenced firms do benefit from increased access to capital (but there is no evidence to support the hypothesis of either profitability or growth) and the payment of interest rate to debt ratio is higher for them (Agarwal and Elston, 2001), in Japan, banks influence firms to decide about low-risk investment decisions (lower debt-equity ratio) and bank-related firms are less profitable than other ones (Ogawa et al., 2007). Ogawa et al. (2007) carried out a detailed analysis of dependency of the number of long-term credit relationships on the characteristics of the firm; they emphasized that, while the largest firms have the largest number of banks relationships, the number of relationships is strongly positively correlated with solvability and R&D and inversely with the liquidity of the firm. A higher profitability (ROA), debt-on-asset ratio (DAR) and lower liquidity (LAR) lead to more banking relationships according to Sterken and Tokutsu (2002), while Kano et al. (2006), in studying the small and medium enterprises, noticed that they benefit most from bank-borrower relationship when they do not have audited financial statements and when they borrow from small banks in less competitive markets.
Since 1992, the Japanese banking system has experienced a sizable deterioration in its financial conditions (Brewer et al., 2003). Commercial banks have recorded cumulative loan losses of about 83 trillion yen. These losses reduced the bank capitalization and led to the failure of three large banks (and other small banks). The very poor financial conditions of those major banks affected the whole credit system, especially those in weaker financial conditions. In order to increase the financial stability of the system, in 1997 the Japanese regulators liquidated a large city bank and nationalized 2 of the 3 largest long-term credit banks (Brewer et al., 2003 where it is emphasized that the banks’ failure negatively affected the stock prices of firms that had lending relationships with the failed banks). In this paper, we analyze the bank-firm relationships in Japan in 2004, using the network theory, where network is the set of nodes (two types in our case: banks and firms) and links (debt/credit contracts between them).
There are some recent investigations of the “inter-bank market” (Iori et al., 2007; Boss et al., 2004), but to the best of our knowledge only a few studies of the financial credit market (see De Masi and Gallegati (2007) and Fujiwara et al. (2009)). The advantages of these network analyses include (a) characterization by statistical features of a large-scale network (section IV), (b) extraction of cohesive groups or communities in the network, and also an extensive analysis to hierarchical structures (section V, VI), and (c) correlation of those statistical features to some attributes of nodes/links (section VII). The point (c) here implies that the network analysis is just a complementary methodology to those traditional ones that were briefly reviewed in the above. The method can potentially provide scaffolding which will enable one to build a model of the network under study and a dynamics on it, that is, financial stability issues in our case.
The paper is organized as follows: section II describes our data on the multiple lending relationships in Japan. The definition of the credit network is explained in detail considering several topological measures in section III, and the methodology is applied to the dataset in order to describe the architecture of the empirical network (section IV). The following sections are, respectively, dedicated to an analysis of the properties of the hierarchical clustering of co-financing banks, to an investigation of the co-financed firms by sectors and to the analysis of possible effects of the financial conditions on the topology of credit relationships (sections V, VI, VII). Section VIII concludes.
II The data set
Our database is based on the survey of firms quoted in the Japanese stock-exchange markets and on the financial statements publicly reported by each quoted firm. The data were compiled by Nikkei Media Marketing, Inc. and commercially available. The financial statements and surveys include the information about each firm’s borrowing from financial institutions, the amounts of borrowing, classified into short-term and long-term borrowings. “Long-term” borrowing is defined by scheduled repayment period exceeding one year, and “short-term” borrowing refers to the other cases.
The financial institutions consist of long-term credit banks, city banks, regional banks (primary and secondary), trust banks and insurance companies, basically all the financial institutions in Japan, which we refer to as “banks” in this paper. We also employ the database of the financial statements for the banks except insurance companies. This database is systematically compiled and maintained by the “Japanese Banks Association” and is publicly available.
The numbers of banks and firms in the years 2000-2005 are reported in table 1.
| year | firms | banks | links |
|---|---|---|---|
| 2000 | 2,629 | 211 | 27,389 |
| 2001 | 2,714 | 204 | 26,597 |
| 2002 | 2,739 | 202 | 24,555 |
| 2003 | 2,700 | 192 | 22,585 |
| 2004 | 2,701 | 190 | 21,919 |
| 2005 | 2,674 | 182 | 21,811 |
Typical numbers of banks are, for instance in the fiscal year of 2004, seven city banks (which include the four majors: the Bank of Tokyo-Mitsubishi, the Mizuho Bank, the Sumitomo-Mitsui Bank and the UFJ Bank), 64 regional banks, 48 secondary regional banks and 9 trust banks; the rest are long-term credit banks (which include two big banks: the Shinsei Bank and the Aozora Bank) and insurance banks. As described previously, the Japanese financial institutions experienced great damage in the national financial system after the Bubble crash in 1990, and the merger of banks restructured it. The process is still going on: the Bank of Tokyo-Mitsubishi and the UFJ Bank have been merged into a single (and the largest) financial group. The merger of banks is still going on since 2000 and can be emphasized by the decrease of the total number of banks. This situation is common to all types of banks (see table 2). The other banks in each year are mostly life and non-life insurance banks and a few government-affiliated financial institutions.
| year | 2005 | 2004 | 2003 | 2002 | 2001 | 2000 |
|---|---|---|---|---|---|---|
| city | 7 | 7 | 7 | 7 | 9 | 9 |
| regional | 64 | 64 | 64 | 64 | 64 | 64 |
| 2nd regional | 48 | 50 | 53 | 57 | 57 | 60 |
| trust | 9 | 9 | 7 | 7 | 8 | 9 |
| long-term | 2 | 2 | 2 | 3 | 3 | 3 |
| others | 52 | 58 | 59 | 64 | 63 | 66 |
| total | 182 | 190 | 192 | 202 | 204 | 211 |
On the other hand, firms are all listed in the Japanese markets, mostly consisting of large firms. Industrial sectors are classified into 34 conventional sectors except banks and insurance, divided into 17 manufacturing and 17 non-manufacturing sectors. The numbers of firms for each sector in each year are summarized in the table 3.
| sector-classification | 2005 | 2004 | 2003 | 2002 | 2001 | 2000 |
| Foods | 116 | 113 | 118 | 117 | 119 | 113 |
| Textile Products | 52 | 55 | 58 | 61 | 58 | 63 |
| Pulp & Paper | 21 | 23 | 23 | 24 | 28 | 30 |
| Chemicals | 151 | 154 | 158 | 160 | 162 | 159 |
| Drugs | 21 | 23 | 25 | 29 | 32 | 36 |
| Petroleum | 9 | 9 | 9 | 8 | 9 | 10 |
| Rubber Products | 21 | 23 | 23 | 25 | 22 | 22 |
| Stone, Clay & Glass Products | 63 | 62 | 66 | 68 | 70 | 72 |
| Iron & Steel | 47 | 47 | 50 | 54 | 53 | 54 |
| Non-ferrous Metal & Metal Products | 99 | 100 | 107 | 110 | 112 | 121 |
| Machinery | 191 | 196 | 200 | 205 | 207 | 204 |
| Electric & Electronic Equip. | 199 | 206 | 214 | 217 | 209 | 211 |
| Shipbuilding & Repair | 5 | 6 | 6 | 6 | 7 | 6 |
| Motor Vehicles & Auto Parts | 57 | 61 | 65 | 68 | 71 | 72 |
| Transportation Equip. | 12 | 13 | 13 | 17 | 17 | 18 |
| Precision Equip. | 45 | 47 | 45 | 46 | 45 | 43 |
| Other Manufacturing | 97 | 95 | 93 | 98 | 94 | 89 |
| Fish & Marine Products | 10 | 8 | 9 | 9 | 9 | 10 |
| Mining | 6 | 7 | 9 | 8 | 9 | 9 |
| Construction | 157 | 168 | 181 | 200 | 207 | 199 |
| Wholesale Trade | 295 | 299 | 304 | 322 | 317 | 304 |
| Retail Trade | 222 | 220 | 212 | 213 | 209 | 215 |
| Securities houses | 19 | 13 | 15 | 15 | 14 | 12 |
| Credit & Leasing | 73 | 69 | 56 | 51 | 52 | 49 |
| Real Estate | 100 | 93 | 84 | 79 | 71 | 57 |
| Railroad Transportation | 28 | 31 | 31 | 32 | 32 | 34 |
| Trucking | 35 | 35 | 32 | 31 | 28 | 30 |
| Sea Transportation | 19 | 19 | 19 | 19 | 20 | 21 |
| Air Transportation | 5 | 4 | 6 | 7 | 7 | 6 |
| Warehousing & Harbor Transportation | 39 | 38 | 36 | 35 | 37 | 34 |
| Communication Services | 29 | 26 | 19 | 17 | 23 | 17 |
| Utilities(Electric) | 9 | 9 | 8 | 8 | 8 | 7 |
| Utilities(Gas) | 12 | 12 | 13 | 11 | 11 | 11 |
| Services | 410 | 417 | 393 | 369 | 345 | 291 |
| total | 2,674 | 2,701 | 2,700 | 2,739 | 2,714 | 2,629 |
III The network representation
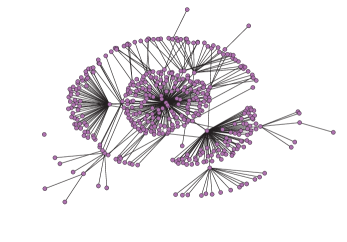
We represent the system as a network, by using an approach based on the graph theory to analyze the structure of credit relationships in the Japanese economic system. The network is defined as a set of nodes and links and it is mathematically represented by a graph. In recent years a large development of complex networks theory has been observed. Many real systems have been represented as networks (Caldarelli, 2007; Dorogovtsev, 2003). Most of them show scaling properties: they are scale-free networks, i.e. their degree distribution is power-law tailed. In our case banks and firms represent the nodes, while the links represent the credit relationships between them. This type of networks is particular, being composed by only two kinds of nodes, and is called bipartite network. Figure 1 (a) represents an example of the bank-firm network.
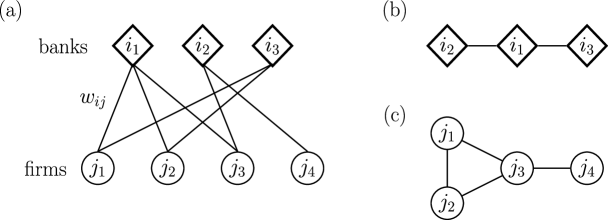
Many empirical studies have been conducted in the field of bipartite graphs (see e.g. Peltomaki and Alava (2006); Sneppen et al. (2004); Guillaume and Latapy (2004)). One can extract two networks from a bipartite network, each one composed by just one kind of nodes: these two networks are called projected networks, since they are obtained as a projection of the initial graph in the subspace composed by nodes of the same kind (see figure 1 (b) and (c)).
A network is represented from a mathematical point of view by an adjacency matrix. The element of the adjacency matrix indicates that a link exists between nodes and ; that is, if the bank provides a loan to the firm ; otherwise . We can define a weighed adjacency matrix where if the bank provides a loan to the firm and the value of is exactly the size of the loan; otherwise .
The degree of a node is the number of its links and is calculated by
| (1) |
The neighbors of a node is a set of nodes such that , which is denoted by . The strength of a node is the total amounts of the weights of its links and is calculated by
| (2) |
The participation ratio is a measure of the concentration of the weight of a node versus its neighbors, and is defined by
| (3) |
In the case of identical links (full homogeneity), the participation ratio would be . For a main-bank system, we expect the contracts of debt of each firm to be concentrated, being the contract with the main bank much more “important” with respect to those with the other banks.
The assortativity is a measure of similarity among nodes and it is defined as
| (4) |
The distance between two nodes is the shortest number of links to go from to . Therefore the neighbors of a node are all the nodes which are connected to that node by a single link (). Using the adjacency matrix this can be written as
| (5) |
where is a path connecting node and node . The diameter of a graph is given by the maximum of all distances between pairs.
In the following we apply these tools to our dataset. It is mentioned that Fujiwara et al. (2009) examined a similar dataset to quantify the dependency and influence between banks and firms by using the weights defined above and assuming a diffusion process in the bipartite graph. The present paper focuses on statistical properties of credit topology and weights, and further on extraction of cohesive groups or communities in the network, and also an extensive analysis of hierarchical structures.
IV The Banks-Firms credit network
The average degree of firms is , while the average degree of banks is ; the average strength of firms million yen, while that of banks is million yen.
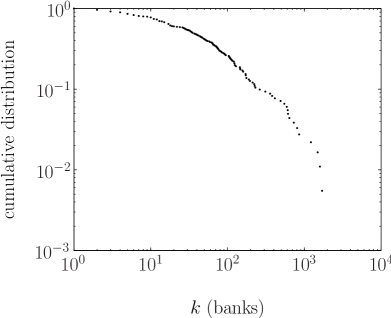

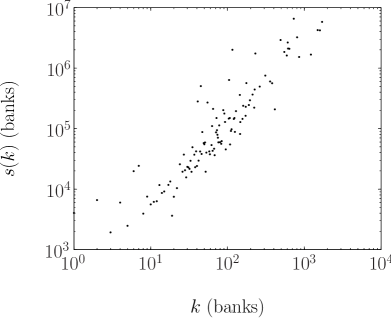


Figure 2 shows the distribution of the degree for banks (left panel) and firms (right panel). The maximum degree of the banks is 1,706, and that of the firms is 109, with very heterogeneous behavior among banks and among firms. In particular, after having conditioned it for the firm’s size, we found that many firms prefer single lending whereas others adopt a multiple lending strategy.
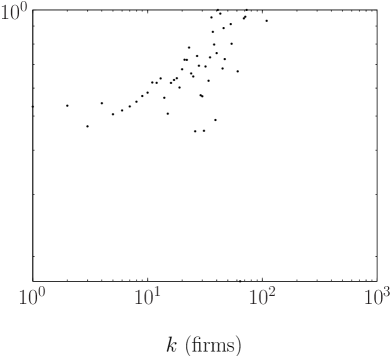
In figure 3 (top panels), we show the scaling of the strength versus the degree. In the case of banks the linear correlation coefficient between and is 0.8, while that for firms is 0.4. This signals the presence of a weak link between the amount of credit firms demand the banks for and the number of banks they ask to. The firms with large amount of borrowings prefer multiple links (in agreement with Ogawa et al., 2007), but multi-lending is present also among firms with a lower amount of borrowings. In figure 3 (bottom panel) we observe the scatter plot for the degree of firms versus their total-debt. By calculating a rank correlation (Kendall’s ), we found that () (where is what is expected from the null hypothesis that there is no association between the rank of degree and that of total-debt), which implies significantly positive correlation.
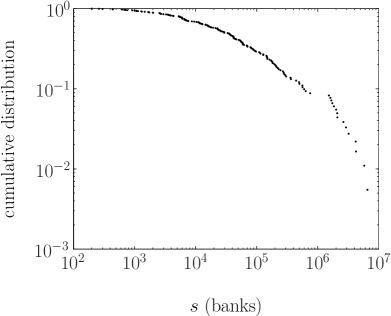
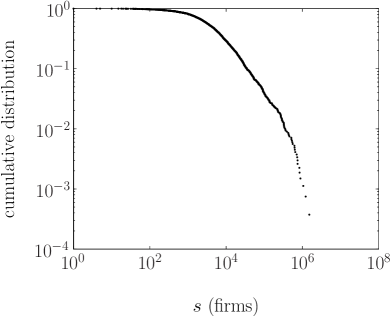
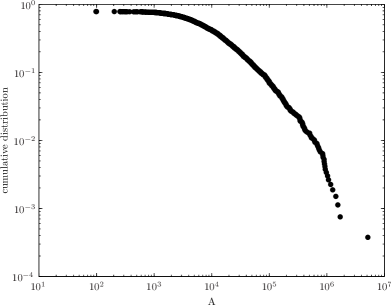
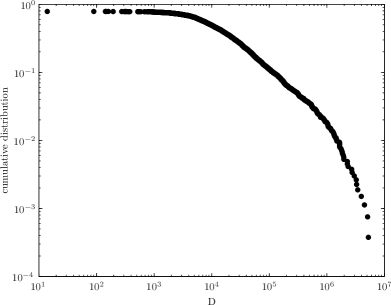
In figure 4, the distribution of the strength for total contracts is plotted. The maximum strength of banks is million yen and for firms, and there is no difference in the plots when long-term and short-term loans are considered.
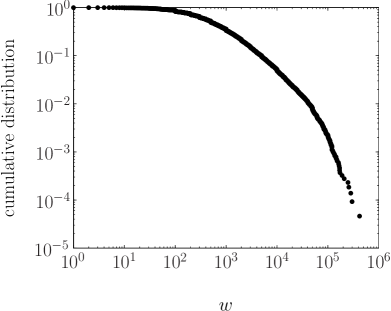
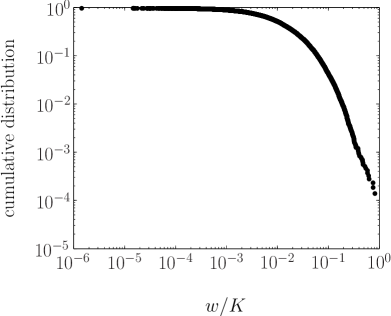
Once one looks into the differentiation of the lending contracts for all the firms, a fat tail distribution of the amount of the contracts emerges (figure 5, left panel). This heterogeneity is not a consequence of the heterogeneity of firms’ sizes. In fact, after normalization, we can still observe a fat-tailed distribution in the right panel of figure 5.
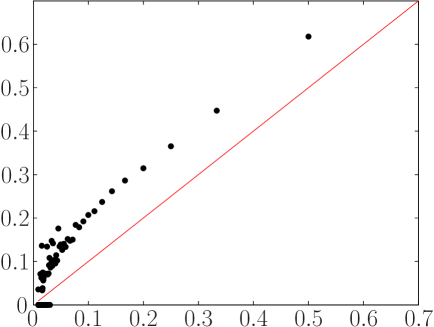
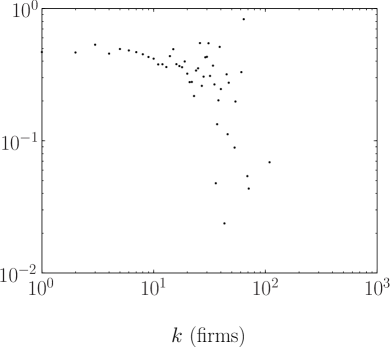
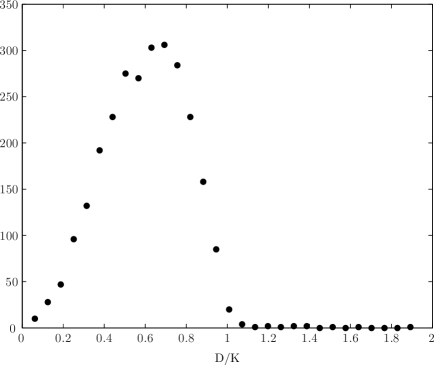
Which is the differentiation inside the set of contracts of firm by firm? The participation ratio is a measure of the heterogeneity of the amount of debt of a certain firm versus its creditors, i.e. if the sizes of different loans are roughly of a similar size or not. The ratio for a firm is
| (6) |
In figure 6, the actual participation ratio is represented with black dots, while the red line represents the “homogeneous” case . As expected, the dots do not overlap with the homogeneous line. Let us note that heterogeneity is stronger in the case of weak multiple lending (low , right side of the axis).
No striking differences in the distributions of firms-degree are observed when one considers separately long- and short-term contracts: the average degree is 6.7 (for the long-term loan) and 5.7 (short-term), while the maximum is 108 (long-term) and 54 (short-term). The linear correlation coefficient between the degree and the total amount of borrowings for firms is 0.19 (short term) and 0.39 (long term), while they increase quite a lot for banks to 0.79 (short term) and 0.88 (long term) respectively. It looks as if there is (no) statistically robust link between long- (short-) term contracts and multi-lending, because limited information induces risk diversification.
If one analyzes the percentage of short-term or long-term contracts with respect to the total amount of borrowings versus degree (as plotted in figure 7), a decreasing tendency of the ratio short/long can be emphasized.
V Hierarchical clustering of co-financing banks
From the network of banks and firms, we can extract the network of the co-financing banks with the method of projected network (De Masi and Gallegati, 2007). The obtained bank network is defined as a weighted network, only populated by banks, in which two banks are linked if they finance the same firm; therefore, the weight of the link is the number of firms they both finance. The banks are divided in 6 subgroups depending on the kind of bank, as shown in table 4.
| large sector | color | description |
|---|---|---|
| 1 | black | long-term credit bank |
| 2 | blue | city banks |
| 3 | green | regional banks |
| 4 | yellow | trust banks |
| 5 | orange | secondary regional banks |
| 6 | white | the rest of banks |
Instead of considering the whole weighted adjacency matrix and the whole network, we analyze a tree with only links, which select the most of important links of the matrix . The algorithm used to construct the tree of banks is the Minimal Spanning Tree (MST) (e.g. Cormen et al. (2001)) (see Mantegna (1999) for an early application in financial market). We consider a set of banks and the weighted matrix of the number of contracts in common among them. We define a distance between a pair of banks
| (7) |
where , and is the maximum among all the weights of the links. Then the MST is calculated in the following way:
-
rank by increasing order the values of
-
pick the pair corresponding to the smallest and create a link between these two banks
-
pick the pair corresponding to the second higher and create a link between these two banks
-
repeat the operation unless adding a link between the pair under consideration creates a cycle, in which case skip that value of .
In this way we find a tree containing the strongest links of the original weighted matrix .
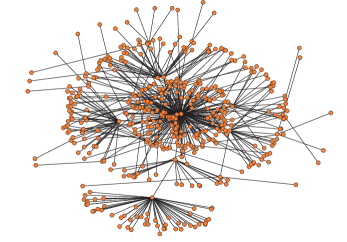
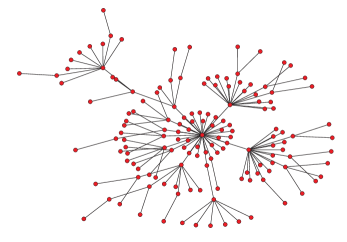
In figure 8, we plot the MST. This is the backbone of co-financing relationships in Japan. In the year 2004, the hubs are Sumitomo Mitsui Banking Corporation (center), the Bank of Tokyo-Mitsubishi, Ltd (bottom) and UFJ Bank, Ltd. (top). The three hubs structure allows separating the bank system in three sub-graphs: the failure of one of the three largest banks can cause a huge impact in each corresponding subsystem that is divided by the clusters. We observe clusters with strong geographical characterization: the nodes’ neighbors in the tree are in the same geographical region. We have clear hierarchical clustering, where the hubs are Tokyo Mitsubishi, Sumitomo Mitsui and UFJ bank. These three hubs, Tokyo-Mitsubishi, UFJ and Sumitomo Mitsui, are the largest banks in Japan until the year 2006, when the former two banks were merged into a single and largest bank. We may recognize branches from the Chubu region, pairs of banks from Tohoku, Chubu, Kantou, Kyushu, triads from Chugoku, Okinawa; also some pairs of institutes of life insurance.
We can observe a very clear geographical location of the clusters. We may define the color of the nodes considering their region (table 5).
| group | color | region |
|---|---|---|
| 0 | white | not regional |
| 1 | black | Hokkaido and Tohoku |
| 2 | blue | Kantou |
| 3 | green | Chubu |
| 4 | yellow | Kinki |
| 5 | orange | Chugoku |
| 6 | red | Shikoku |
| 7 | brown | Kyushu |
The MST obtained with this definition of colors is represented in figure 9.
A look at the MST reveals that several of its portions can be well understood. We can interpret the tree by making some considerations:
-
The main reason why banks and financial institutions have borrowers in common is that they do the lending activity in the same geographical regions. In particular, very frequently, regional banks have common sets of borrowers in the same regional places. This is because Japanese firms have customarily borrowed from more than one bank. This is in contrast with the US, where many small and medium-size firms have single borrowings. Moreover, traditionally major banks operate mainly in the urban regions of Tokyo, Osaka and Nagoya, so their common borrowers are quite similar. On the other hand, in recent years, major banks have increased the number of branch offices in suburban areas, so they have begun to share common borrowers with regional banks.
-
The set of common borrowers is also explained considering that in Japan the lending activity is based on keiretsu, between major and regional banks, between banks and trust-banks, and between banks and insurance companies (life-, fire- and marine-insurances). Frequently, big firms in industrial business conglomerates (groups partly remnant from the pre-war zaibatsu) have borrowed from closely related conglomerates of financial businesses of banks, trust-banks and insurance companies.
-
Two other reasons may determine what has been observed. The first one is that when foreign-affiliated (-owned) insurance companies lend to individuals (these activities are extended to lending to firms as well), they are supported by branch offices of regional banks. The second one is that keiretsu exists between major banks and regional banks. In the same keiretsu, human resources, financial technologies and operating systems are shared. This can possibly yield opportunities for sharing common borrowers. In the MST different main branches of the tree correspond to the keiretsu between major and regional banks.
-
Banks had been customarily owners of firms’ equities in correlation with shares of lending to those firms. In other words, lending relationships are associated with particular ownership relations. This activity would result in common lending followed by common shareholding.
-
Finally, firms happen to be in the same syndicated loan. This is a large loan in which a group of banks work together to provide funds for a borrower. There is usually one leading bank, which is called arranger and is often a major bank, which takes a percentage of the loan and syndicates the rest to other banks.
VI Co-financed firms network
We can project the bipartite network in the subspace of firms, obtaining the co-financed firms’ network. This strongly connected network was created in 2004 by 2,661 firms, linked to each other by almost 3 millions (2,881,763) links (as the number of possible links is 3,539,130 this is more than 80% of all existing possible links among firms). The average connectivity is . If the lending was sectorial (i.e. certain banks finance certain firms (for example firms of the same industrial sector), while other banks finance other firms, this would imply, in the projected space, the formation of grouping of cofinanced firms (properly said communities in the network literature). On the contrary, in the empirical case, we observe that each firm is connected to many other ones and that there are not communities. This is a sign of the fact that the lending is not sectorial.
We aggregate several sectors of table 3 into six groups: 1) Foods, Chemicals, Drugs; 2) Iron, Steel, Non-ferrous Metals, Metal Products; 3) Motor Vehicles, Auto Parts, Transportation Equip., Shipbuilding, Repair; 4) Machinery, Electric and Electronic Equip., Precision Equip., other Manufacturing; 5) the rest of manufacturing sectors, and 6) all of non-manufacturing sectors.
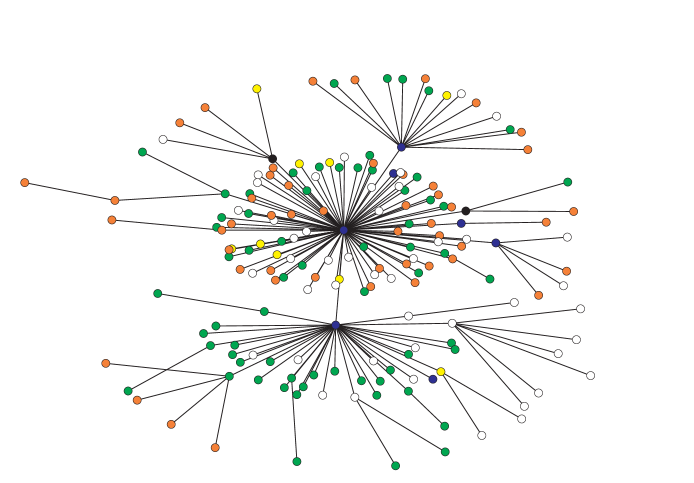
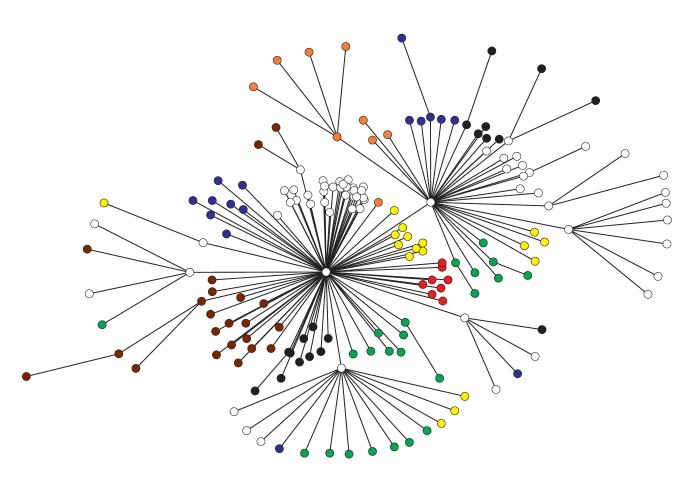
In the following we extract the sub-networks of firms belonging to the same group. We calculated the MST for each sector. The trees obtained are reported in figure 10. For each tree, the hubs are indicated in the caption of the figure.

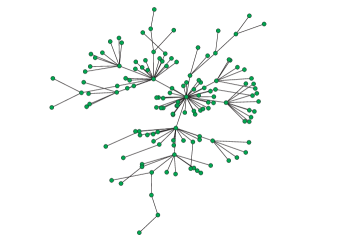
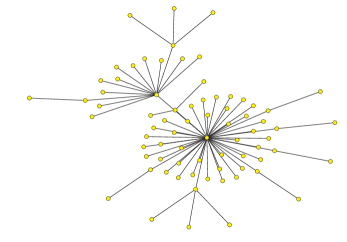
Investigating the clusters, one may observe a regular pattern, except for the first group of sectors (Foods, Chemical and Drugs, panel top left): there exists a very big firm as a hub, which has many connected firms and from 2 to 5 large firms. In turn, these firms create sub-hubs, i.e. they are connected to other smaller firms constituting an autonomous tree. Note that asymmetric information may be the cause of such a configuration. On the one hand, in fact, banks tend to specialize in providing credit to some sectors only (they diversify the risk by investing in different industrial sectors); but also there is a geographical specialization, which leads to the birth of the sub-hubs.
VII Financial status and topology
This section investigates the effect of the financial status of the firms on the topology structure as well as of banks. Data show that debt, asset and DAR (debt on asset ratio) are correlated with the total degree of the firm, although not very strongly. This signals the presence of strong heterogeneity among firms with similar degrees.
In order to test the statistical significance of the correlation values, we compute the probability of obtaining a correlation as large as the observed value by random chance, when the true correlation is zero. If is small, say less than 0.05, then the correlation is significant. The -value is computed by transforming the correlation to create a -statistic having degrees of freedom, where is the number of rows of . In the following table 6 we observe the correlation values among degree, debt, asset and DOA.
| variable 1 | variable 2 | correlation | |
|---|---|---|---|
| debt | degree | 0.32 | |
| asset | degree | 0.29 | |
| DAR | degree | 0.24 | |
| debt | asset | 0.97 |
The debt and the size (asset) of the firm are highly correlated, as pointed out in a previous work by Fujiwara (2004). The distributions of asset, debt and debt on capital of our sample are plotted in the figure 11 and figure 12. The firms are divided in 5 classes based on the different asset value. The classes are built with the aim to obtain 5 equally populated classes.
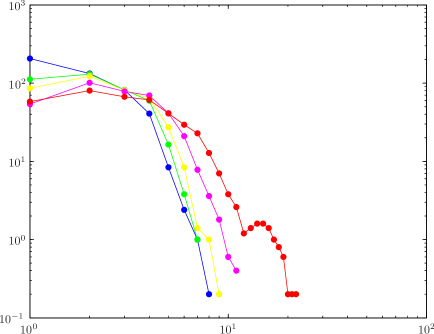

In figure 13, we plot the degree distributions for firms belonging to each of the 5 classes. Firms’ behavior of the same classes is very heterogeneous: the number of contracts in each class is variable, even if the value of shifts toward higher values of , when the size of the firms increase: multi-lending is present in both small and large firms, even if the bigger firms have a larger number of creditors.
In addition, we checked the widely recognized hypothesis that the balance-sheet conditions of financial institutions also affect the bank-firm relationships. We examined the relation between the capital-to-asset ratio of banks and their degrees. Figure 14 shows the scatter plot of the capital-to-asset ratios and degrees for the regional banks (filled dots) and also for the city banks (circles). The latter group obviously has a different distribution, so we focused only on the regional banks and confirmed that there exists a weakly positive correlation, (-value ).
VIII Conclusive Remarks
In this conclusive section, we would like to emphasize how a new tool for economic policy emerges from the network analysis, namely the issues of stabilization of the financial system by preventing a financial crises, with its propagation and amplification, or domino effects. Real economies are composed by millions of interacting agents, whose distribution is far from being stochastic or normal. The Japanese credit market shows that several hubs exist, i.e. banks and firms with many connections: the distribution of the degree of connectivity is scale-free, i.e. there are a lot of firms with 1 or 2 links, and very few firms with a lot of connections well described by a scale-free distribution. Let us assume the Central Authority has to prevent a financial collapse of the system, or the spreading of it (the so-called domino effect). Rather than looking at the “average” risk of bankruptcy, and to infer it would represent the stability of the system, the network analysis of the real system tells us to investigate the different sub-systems of the global economy and to intervene to prevent failures and their spread. Instead of a helicopter drop of liquidity, one can make “targeted” interventions to a given agent or sector of activity: Fujiwara (2008) shows how to calculate the probability of going bankrupt by solo, i.e. because of idiosyncratic elements, or domino effect, i.e. because of failure or other agents having credit or commercial links.
In this paper we performed a first analysis of relationships of credit between Japanese quoted firms and banks. We focus on the problem of multiple relationships in Japan, in order to study how the typical Japanese financial conglomerates (the keiretsu) influence the network topology of the underlying architecture of credit relationships. Notwithstanding the behavior of firms and banks is highly heterogeneous, one may observe that firms with a large demand for credit have multiple links (in agreement with Ogawa et al., 2007), because of risk sharing on the part of the banks. The analysis of the MST (minimum spanning tree) of the co-financing banks points out the presence of a hierarchical structure of the channels of credit, with big hubs (the largest Japanese banks) and several branches (smaller banks). These branches have a strong geographical characterization, indicating the presence of regional clusters in the system of the Japanese credit market (the presence of geographical clusters is also evident as regards the Italian market: De Masi and Gallegati, 2007).
To conclude, we point out that: (i) a backbone of the credit channel emerges, where some links play a crucial role; (ii) big banks privilege long-term contracts; the “minimum spanning trees” (iii) disclose a highly hierarchical backbone, where the central positions are occupied by the largest banks, and emphasize (iv) a strong geographical characterization, while (v) the clusters of firms do not have specific common properties. Moreover, (vi) while larger firms have multiple lending in large, (vii) the demand for credit (long vs. short term debt and multi-credit lines) of firms with similar sizes is very heterogeneous.
Acknowledgements
We would like to thank the Nikkei Media Marketing, Inc. for providing useful information on the dataset. GDM. acknowledges H. Aoyama and W. Souma for the fruitful collaboration during the visit in Kyoto.
References
- (1)
- Agarwal and Elston (2001) Agarwal, R. and J. A. Elston, “Bank–firm relationships, financing and firm performance in Germany,” Economics Letters, 2001, 72 (2), 225–232.
- Anderson (1997) Anderson, P. W., “Some Thoughts About Distribution in Economics,” in W. B. Arthur, S. N. Durlauf, and D. A. Lane, eds., The Economy as an Evolving Complex System II, Perseus Books 1997.
- Aoki and Patrick (1994) Aoki, M. and H. Patrick, eds., The Japanese main bank system: its Relevance for Developing and Transforming Economies, Oxford University Press, New York, 1994.
- Boss et al. (2004) Boss, M., H. Elsinger, M. Summer, and S. Thurner, “The Network Topology of the Interbank Market,” Quantitative Finance, 2004, 4, 677–684.
- Brewer et al. (2003) Brewer, E., H. Genay, and G. G. Kaufman, “Banking Relationships during Financial Distress: The Evidence from Japan.,” Economic Perspectives, 2003, 27 (3), 2–19.
- Brock (1999) Brock, W. A., “Scaling in economics: a reader’s guide,” Industrial and Corporate Change, 1999, 8 (3), 409–446.
- Caldarelli (2007) Caldarelli, G., Scale-Free Networks, Oxford University Press, Oxford, 2007.
- Cormen et al. (2001) Cormen, T. H., C. E. Leiserson, R. L. Rivest, and C. Stein, Introduction to Algorithms, MIT Press, Cambridge, 2001.
- Debreu (1959) Debreu, G., Theory of value, John Wiley & Sons, New York, 1959.
- Diamond (1984) Diamond, D. W., “Financial Intermediation and Delegated Monitoring,” Review of Economic Studies, 1984, 51 (3), 393–414.
- Dorogovtsev (2003) Dorogovtsev, SN, Evolution of Networks: From Biological Nets to the Internet and WWW, Oxford University Press, 2003.
- Farinha and Santos (2002) Farinha, L. A. and J. A. C. Santos, “Switching from Single to Multiple Bank Lending Relationships: Determinants and Implications,” Journal of Financial Intermediation, 2002, 11 (2), 124–151.
- Fujiwara (2004) Fujiwara, Y., “Zipf law in firms bankruptcy,” Physica A, 2004, 337 (1-2), 219–230.
- Fujiwara (2008) , “Chain of firms bankruptcy: a macroscopic study of link effect in a production network,” Advances in Complex Systems, 2008, 11 (5), 703–717.
- Fujiwara et al. (2009) Fujiwara, Y., H. Aoyama, Y. Ikeda, H. Iyetomi, and W. Souma, “Structure and temporal change of the credit network between banks and large firms in Japan,” Economics E-Journal, 2009, 3 (2009-7). http://www.economics-ejournal.org/economics/journalarticles/2009-7.
- Guillaume and Latapy (2004) Guillaume, J. L. and M. Latapy, “Bipartite structure of all complex networks,” Information Processing Letters, 2004, 90 (5), 215–221.
- Iori et al. (2007) Iori, G., G. De Masi, O. Precup, G. Gabbi, and G. Caldarelli, “A Network Analysis of the Italian Overnight Money Market,” 2007. to appear in Journal of Economic Dynamics and Control.
- Kano et al. (2006) Kano, M., H. Uchida, G. F. Udell, and W. Watanabe, “Information Verifiability, Bank Organization, Bank Competition and Bank-Borrower Relationships,” 2006. RIETI discussion paper 06-E-003, the Research Institute of Economy, Trade and Industry.
- Mantegna and Stanley (2000) Mantegna, R. N. and H. E. Stanley, Introduction to Econophysics: Correlations and Complexity in Finance, Cambridge University Press, 2000.
- Mantegna (1999) Mantegna, RN, “Hierarchical structure in financial markets,” European Physical Journal B, 1999, 11 (1), 193–197.
- De Masi and Gallegati (2007) Masi, G. De and M. Gallegati, “Bank-firm topology in Italy,” 2007. submitted.
- Ogawa et al. (2007) Ogawa, K., E. Sterken, and I. Tokutsu, “Why do Japanese firms prefer multiple bank relationship? Some evidence from firm-level data,” Economic Systems, 2007, 31 (1), 49–70.
- Ongena and Smith (2000) Ongena, S. and D. C. Smith, “What Determines the Number of Bank Relationships? Cross-Country Evidence,” Journal of Financial Intermediation, 2000, 9 (1), 26–56.
- Peltomaki and Alava (2006) Peltomaki, M. and M. Alava, “Correlations in bipartite collaboration networks,” Journal of Statistical Mechanics, 2006, p. P01010.
- Schumpeter (1911) Schumpeter, J. A., The Theory of Economic Development, Harvard University Press, Cambridge, 1911.
- Sneppen et al. (2004) Sneppen, K., M. Rosvall, A. Trusina, and P. Minnhagen, “A simple model for self-organization of bipartite networks,” Europhysics Letters, 2004, 67 (3), 349–354.
- Solomon (2007) Solomon, S., “Complexity Roadmap,” 2007. Technical report, Institute for Scientific Interchange, Torino.
- Spiegel and Yamori (2003) Spiegel, M. M. and N. Yamori, “Financial Turbulence and the Japanese Main Bank Relationship,” Journal of Financial Services Research, 2003, 23 (3), 205–223.
- Sterken and Tokutsu (2002) Sterken, E. and I. Tokutsu, “What are the determinants of the number of bank relations of Japanese firms?,” 2002. University of Groningen.