Spectroscopic Detection of Carbon Monoxide
in Two
Late-type T Dwarfs
Abstract
band spectra of two late-type T dwarfs, 2MASS J09373487+2931409, and Gliese 570D, confirm evidence from photometry that photospheric CO is present at abundance levels far in excess of those predicted from chemical equilibrium. These new and unambiguous detections of CO, together with an earlier spectroscopic detection of CO in Gliese 229B and existing band photometry of a large selection of T dwarfs, suggest that vertical mixing in the photosphere drives the CO abundance out of chemical equilibrium and is a common, and likely universal feature of mid-to-late type T dwarfs. The band spectra allow determinations of the time scale of vertical mixing in the atmosphere of each object, the first such measurements of this important parameter in late T dwarfs. A detailed analysis of the spectral energy distribution of 2MASS J09373487+2931409 results in the following values for metallicity, temperature, surface gravity, and luminosity: [M/H], K, , . The age is 3–10 Gyr and the mass is in the range 45–69.
1 Introduction
In the 1500–4000 K photospheres of late-type stars and early-mid L-type brown dwarfs carbon is predominantly locked up in carbon monoxide (CO), due to the much higher binding energy of CO than that of any other carbon-bearing molecule. At temperatures of 1500 K, however, methane (CH4) begins to be stable against collisional dissociation. As a brown dwarf cools below this temperature, the overwhelming abundance of hydrogen slowly drives the carbon that was in CO into CH4 (Fegley & Lodders, 1996). This chemical change leads to a striking transformation of the infrared spectrum of the brown dwarf and marks the division between the L and T classifications (Kirkpatrick et al., 1999; Burgasser et al., 2002; Geballe et al., 2002; Burgasser et al., 2006).
Absorption bands of CH4 together with those of H2O dominate the 1-2.5 m spectra of T dwarfs, making the = 2.3–2.5 m first overtone band of CO, which is easily observed in K to L dwarfs, virtually undetectable by spectral type T4 (Geballe et al., 2002), even if a significant amount of CO is still present. In contrast, the fundamental vibration-rotation band of CO is centered near 4.7m, where methane is not an important absorber. Over a decade ago Noll, Geballe & Marley (1997) discovered evidence of CO at 4.7 m at an abundance roughly three orders of magnitude larger than expected from chemical equilibrium, in the bright T7p brown dwarf Gliese 229B. The discovery was promptly confirmed by Oppenheimer et al. (1998). Noll, Geballe & Marley (1997) found that the CO abundance in Gl 229B matched that expected at a temperature of 1250 K, roughly 400 K higher than the photospheric temperature. They interpreted the detection as evidence for vertical transport of CO from hotter internal atmospheric layers to the surface, which was later supported by more detailed analysis (Saumon et al., 2000).
This finding was not unexpected, as mixing is predicted to occur in the outer, radiative zones of brown dwarf atmospheres, and the reaction(s) moving carbon from CO to CH4 are slow (Fegley & Lodders, 1994, 1996; Lodders & Fegley, 2002). Recently, the band fluxes of numerous late T dwarfs have been measured to be up to one magnitude fainter than predictions based on their brightnesses in other wavebands and the assumption of equilibrium chemistry (Saumon et al., 2003; Golimowski et al., 2004; Patten et al., 2006). This strongly indicates that the CO phenomenon seen in Gl 229B is common to most or all late T dwarfs. Here we describe spectroscopic observations of two late-type T dwarfs, 2MASS 09373487+2931409 (hereafter, 2MASS 0937) and Gliese 570D, whose physical properties differ significantly from Gl 229B, in order to test this hypothesis spectroscopically.
2MASS 0937 and Gl 229B have nearly the same spectral classifications, T6p and T7.5, respectively (Burgasser et al., 2006). However, the band flux of 2MASS 0937 is significantly depressed relative to Gl 229b and other T6-T7 dwarfs; e.g., its color is 0.8 mag bluer (Burgasser et al., 2002; Knapp et al., 2004). This is believed to be due to the effect of greatly enhanced collision-induced absorption by H2 (implying that 2MASS 0937 is considerably more massive than other T6-T7 dwarfs) and/or that it has unusually low metallicity (Burgasser et al., 2002, 2003; Burrows et al., 2002; Knapp et al., 2004; Burgasser et al., 2006b). The color of 2MASS 0937 (Golimowski et al., 2004) is close to that of Gl 229B, suggesting that its photosphere does contain an enhanced abundance of CO, but a spectroscopic observation is needed to verify that the this is indeed the cause.
Gl 570D (Burgasser et al., 2000) is part of a quadruple system whose other members are low mass main sequence stars. Saumon et al. (2006) determined an age for it of 3–5 Gyr and a mass of 38-47 MJupiter by comparing evolutionary models of brown dwarfs and 1-2.5 m synthetic spectra of Gl 570D to the known luminosity and the observed spectrum. Comparison of Spitzer 3.5–7.9 m photometry and models strongly suggests that the abundance of CO is enhanced by vertical mixing (Patten et al., 2006; Leggett et al., 2007a). The Spitzer 5–15m spectrum of Gl 570D provides strong evidence for mixing also being responsible for the depletion of NH3 (Saumon et al., 2006). In late T dwarfs the nitrogen chemistry is insensitive to the time scale of mixing in the radiative zone, because it is quenched in the convection zone deep in the atmosphere. On the other hand the carbon chemistry, and thus the abundance of CO, is very sensitive to the mixing time scale. Since Gl 570D is significantly cooler than Gl 229B and 2MASS 0937, observations of the 4.7m band of CO provide an opportunity to determine the mixing time scale for a different set of atmospheric parameters.
This paper is structured as follows. Section 2 discusses the properties of the fundamental CO band, §3 presents the band spectroscopic observations and data reduction, and §4 covers the modeling and analysis of Gl 570D and 2MASS 0937, respectively. The last section summarizes and compares the results for the two objects.
2 The Spectral Appearance of the Fundamental Band of CO
In the photospheres of cool stars and “warm” brown dwarfs the fundamental ( = 1) vibration-rotation band of CO, as viewed at low or medium resolution, is a broad and more or less structureless absorption stretching across the entire band. This is the consequence of (1) several vibational levels being populated, (2) each = 1 (i.e., 1–0, 2–1, 3–2, …) band being successively shifted by 0.06 m (25 cm-1) to longer wavelength, and (3) the spacing of vibration-rotation lines in each = 1 band being slightly different. If the rotational levels of only the ground vibrational state are populated, however, the absorption spectrum of CO observed at low or medium spectral resolution will exhibit a bump (due to minimum absorption) around the center of the band at 4.665 m that separates the P and R branches of the band. As excited vibrational levels become more populated at higher temperatures, this absorption gap gradually disappears.
The absorption gap is predicted to become noticeable at photospheric temperatures below 1500 K; that is, at about the same temperature at which equilibrium CO abundances are dropping rapidly in the photosphere of a cooling brown dwarf. Thus, for a mid-late type (T 1000 K) T dwarf photosphere in chemical equilibrium, CO absorption lines will be very weak and no gap will be evident. If, however, the abundance of CO is considerably enhanced, then a broad absorption with a gap at the band center should be relatively prominent and detectable at moderate spectral resolution. The effect is illustrated in early non-equilibrium model spectra of cool dwarfs of Saumon et al. (2003).
H2O also is an important absorber in the band, but its lines, which are irregularly spaced, tend to be spread across the band (although generally increasing in strength toward longer wavelengths). The H2O lines may partially mask the CO absorption gap at band center, but if the gap is prominent they should not entirely conceal it.
3 Observations and Data Reduction
band spectra of 2MASS 0937 and Gliese 570D were accumulated over several nights during 2004-2005, at the Frederick C. Gillett Gemini North telescope, using the facility near infrared imager/spectrograph, (NIRI Hodapp et al. (2003)), which contains grisms for low resolution spectroscopy. The instrument was configured with a slit and a grism, which together provided a resolving power of 460 (corresponding to =0.010 m) in the band.
An observing log is given in Table 1. The total exposure times were 6.1 hr for 2MASS 0937 and 6.5 hr for Gl 570D. Observations were made in the standard stare-nod mode so that spectra were obtained alternately at two locations along the array, separated by . Coaddition of subtracted pairs of frames then result in a final sky-subtracted image containing both a positive and a negative spectrum of the brown dwarf. Positioning of the target in the slit was checked using -band imaging and was adjusted if necessary every 45-60 minutes. Typical adjustments were ; thus each brown dwarf probably was centered well within the slit at all times during most integrations. A telluric standard (a mid F dwarf) was observed just before or just after the brown dwarf, and at an airmass that closely matched that of the brown dwarf. The seeing, as judged from the intensity profiles along the slit of bright calibration stars, ranged from to .
To our knowledge, at 12.3 (as determined here) Gl 570D is the faintest astronomical object to have its -band spectrum successfully observed from the ground. Data reduction of band spectra of faint sources such as Gl 570D and 2MASS 0937 is difficult, because not only is the residual background in the sky-subtracted coadded spectral image considerably brighter than the brown dwarf, but also the gradient in the residual background along the slit is steep compared to the signal produced by the spectrum of the faint source, even after 1 hr of integration. For these data it was necessary to extract sky rows adjacent on either side of each of the positive and negative spectra, in order to remove this gradient, prior to combining the positive and negative spectra.
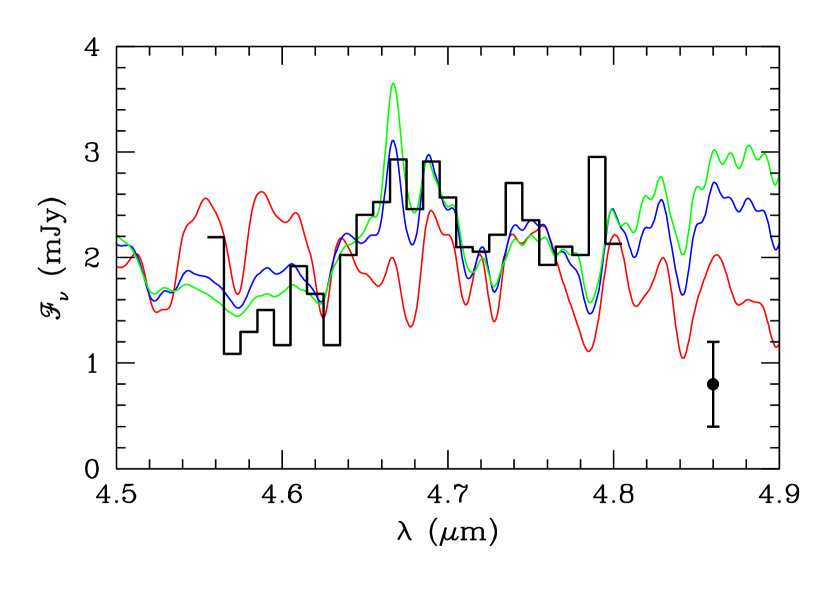
Wavelength calibrations of the spectra were obtained from the host of strong telluric lines evident in the spectra of telluric standards obtained just before and/or after the spectra of the brown dwarfs. The accuracies of the calibrations were better than 0.001 m (3). Flux calibrations utilized the 2MASS magnitudes of the telluric standards and the very small color corrections to derive their magnitudes. It was assumed that the spectra of the standards and the brown dwarfs suffered identical slit losses due to seeing and guiding. That assumption might be suspect, both because the brighter stars can be more accurately centered in the slit of the spectrograph and because during the longer integration times on the brown dwarfs it is more likely that guiding “drifts” occur and result in higher signal losses. Nevertheless, the average flux density in the 4.55–4.80 m spectrum of 2MASS 0937 in Fig. 1, 5.0 0.1 10-16 W m-2 m-1, agrees to within several percent with the (4.55-4.79 m) magnitude of 11.74 0.10) reported by Golimowski et al. (2004). No photometry is available for Gl 570D. From Fig. 1 we estimate = 12.30.3 mag, where the uncertainty is largely that of calibration. This value is consistent with the Patten et al. (2006) IRAC [4.5] photometry and values of [4.5]- for late T dwarfs as given by Leggett et al. (2007b, see their Fig. 2); the uncertainty in the color is several tenths of a magnitude.
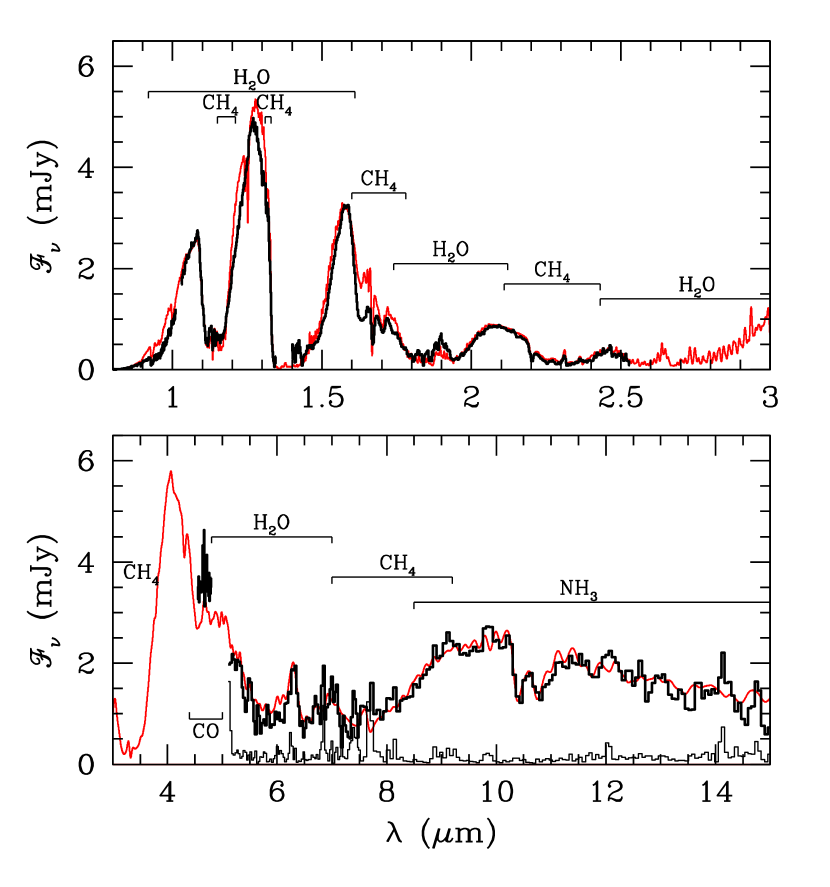
In Figure 1 the coadded, ratioed, and flux-calibrated spectra are binned into 0.01 m intervals. The spectra are qualitatively similar to the published spectra of Gl 229B (Noll, Geballe & Marley, 1997; Oppenheimer et al., 1998), but have higher signal-to-noise ratios. Both have maximum flux density in the 4.64-4.70 m region, as expected if photospheric CO depresses the spectrum everywhere except near the 1-0 band center. The wavelengths of the 1-0 CO lines and their relative strengths, assuming optically thin lines and LTE conditions for T=750 K, are shown in the upper panel of Fig. 1 to illustrate the effect of the band center. Lines of H2O also are expected to contribute spectral features. The model spectra (see below) show that the strongest H2O absorption feature in this region is at 4.68 m, not far from the CO band center, and indeed the spectrum of each brown dwarf shows a pronounced dip at that wavelength. Thus the overall shapes of the spectra constitute unambiguous detections of CO in both 2MASS 0937 and Gl 570D. The effect of the band center is considerably more pronounced in the spectrum of Gl 570D than in 2MASS 0937. In the former the flux density at the center is 50% above the surrounding, whereas in the latter the contrast is roughly half of that.
4 Modelling and Analysis
We analyze the band spectra with the goals of establishing the presence of CO on a quantitative basis and determining the time scale of vertical mixing in the atmosphere. The parallaxes of both objects are known and red, near-infrared, and mid-infrared Spitzer Space Telescope spectra are available, together sampling about 70% of the total flux emitted. The distance and spectra effectively constrain the luminosity, , effective temperature, , gravity, , and metallicity. The Spitzer Infrared Spectrograph (IRS, Houck et al., 2004) spectra of T dwarfs later than T1 show NH3 features (Cushing et al., 2006) whose strengths are influenced by non-equilibrium nitrogen chemistry and thus by vertical mixing. Those features are not sensitive to the time scale of atmospheric mixing, however. Once other parameters have been constrained, the strength of the CO 4.7m band can be used to find the mixing time scale. As in our previous work (Geballe et al., 2001; Saumon et al., 2006), we parametrize the vertical mixing time scale by the eddy diffusion coefficient , where is the mixing scale height, assumed to be equal to the local pressure scale height (Griffith & Yelle, 1999).
Our analysis is based on the atmospheric models and mixing scheme described in Saumon et al. (2006, 2007) and the evolution sequences of Saumon & Marley (2008). Since both Gl 570D and 2MASS 0937 are late T dwarfs, we assume that their atmospheres are cloudless, which is amply supported by their photometry and the detailed analysis of the T7p dwarf Gl 229B (Saumon et al., 2000), Gl 570D (Saumon et al., 2006), and the T8 dwarf 2MASS J0415195093506 (Saumon et al., 2007). The evolutionary sequences were computed with consistent surface boundary conditions provided by a grid of cloudless atmospheric models with the appropriate metallicities.
4.1 Gliese 570D
Because it is a companion to a well-studied main sequence star, Gl 570D has the most precisely determined physical parameters of any T dwarf to date. The K4 V primary provides an accurate distance and metallicity and a tight age constraint on the system. We obtain the basic parameters from the bolometric luminosity derived using the method developed by Geballe et al. (2001). Briefly, we use the well-sampled spectral energy distribution (SED) and a combination of synthetic spectra and evolutionary sequences to obtain . Given , the evolutionary sequences give the range of possible models that are consistent with the age. A detailed comparison with the observed spectrum can further limit the possible range of solutions. This is a robust method to determine , and for T dwarfs, as the results depend only weakly on the metallicity assumed for the models, the details of the synthetic spectra, and the degree of sampling of the SED. The method involves no assumption other than some confidence in the models, which have been validated by comparison with data (Saumon et al., 2006, 2007).
For Gl 570D, Saumon et al. (2006) found –820 K, –5.23, and to . The above ranges of values are not due to random uncertainties, because the parameters are correlated; e.g., for K, and . Fits of the spectrum favor the high-, high- limit of this range. The metallicity of the system is [Fe/H]=0.090.04 (an average of several determinations: Thorén & Feltzing, 2000; Santos et al., 2005; Valenti & Fisher, 2005). Saumon et al. (2006) used solar metallicity models to obtain the above parameters and we do likewise in our analysis of the band spectrum.
The 5–15m Spitzer spectrum shows strong ammonia features that can be accurately modeled using an NH3 abundance reduced by a factor of 10 compared to that in chemical equilibrium, as expected for non-equilibrium chemistry driven by vertical mixing in the atmosphere (Lodders & Fegley, 2002; Saumon et al., 2006). We therefore expect that the band spectrum will show a non-equilibrium abundance of CO. We have performed the analysis using a baseline model computed with the most likely values determined by Saumon et al. (2006), which correspond to their model C: K, , and an age of 5 Gyr (solar metallicity). The only free parameter left to fit the band spectrum is the eddy diffusion coefficient , which determines the surface abundance of CO.
4.1.1 Fits of the band spectrum
There are two approaches to fitting the spectrum shown in Fig. 1 with a set of synthetic spectra. The first method fits only the shape of the spectrum, i.e. the synthetic spectra are scaled by a constant multiplicative factor that is adjusted to minimize with the data. In this approach, the uncertainty in the fitting parameter () is determined by the random noise in each data point of the observed spectrum. This is estimated at W mm-1 (Fig. 1). The second approach uses evolutionary sequences to obtain the radius of the brown dwarf and computes absolute model fluxes that are directly compared to the observed fluxes. This method simultaneously fits the shape of the spectrum and its overall flux level and is subject to the systematic uncertainty in the flux calibration of the data, which is estimated at %. We compute and its uncertainty using both methods. With perfectly calibrated data and perfect models, both methods would give the same value of . We find that the flux calibration uncertainty dominates the noise when fitting the absolute fluxes. The final source of uncertainty in the determination of arises from the possible range of model parameters for the brown dwarf. For Gl 570D, where is narrowly constrained, this last contribution is negligible.
To account for the influence of noise on the interpretation of the spectrum, we generated 1000 simulated observed spectra by adding random Gaussian noise with the above dispersion to the observed flux in each data point. Each of the simulated observed spectra was fitted with a synthetic spectrum computed with the baseline model parameters and (cm2/s) ranging between 2 and 8.5. The high resolution () synthetic flux densities were converted to the resolution of the spectrum in Fig. 1 by integration over 0.01 m wide bins. The best value of is obtained by minimizing
| (1) |
where is the number of points in the band spectrum, , , and are the observed flux, the absolute model flux, and the random noise in pixel , respectively. The flux calibration uncertainty of % enters as (,1, 1.3) and is the model flux renormalization. For the absolute flux fitting procedure was set to unity. When fitting the shape of the spectrum only, was adjusted to minimize for each value of . The resulting distribution of 1000 values of gives an average value and its dispersion. The procedure was repeated for all three values of (with ) to quantify the effect of the uncertainty of the flux calibration.
The general behavior of the for these different assumptions is shown in Fig. 2. For a given value of , the best fit, indicated by the lowest value, occurs when the model fluxes are scaled to the data, i.e. when only the shape of the observed spectrum is fitted (dotted curve). This curve has a broad minimum and our statistical sampling finds the minimum at . Equilibrium chemistry (), which Saumon et al. (2006) found is strongly excluded on the basis of the NH3 depletion revealed by the Spitzer spectrum, is also strongly excluded by the shape of the band spectrum. This is readily seen in Fig. 3 which compares the equilibrium model spectrum, which shows no detectable CO, with the best-fitting non-equilibrium model spectrum. Furthermore, by increasing the statistical sampling by one order of magnitude to 10,000 simulated observed spectra, we found only three simulated spectra giving and none below 3.8. This illustrates the negligible likelihood that the model using chemical equilibrium is consistent with the data. If we fit the data by considering the absolute flux calibration, we find narrower distributions of (solid curves on Fig. 2 that depend sensitively on the flux calibration of the data. For the nominal calibration, we get . Decreasing the absolute flux level by the estimated uncertainty of 30% we find . The systematic uncertainty in due to flux calibration is 8 times larger than that due to random noise in the spectrum. Consistent solutions between the two fitting methods can be obtained if the calibrated flux density is reduced by a factor of 0.65 to 0.5, corresponding to a -1.1 to -1.7 correction, which is just plausible.
4.1.2 Photometry
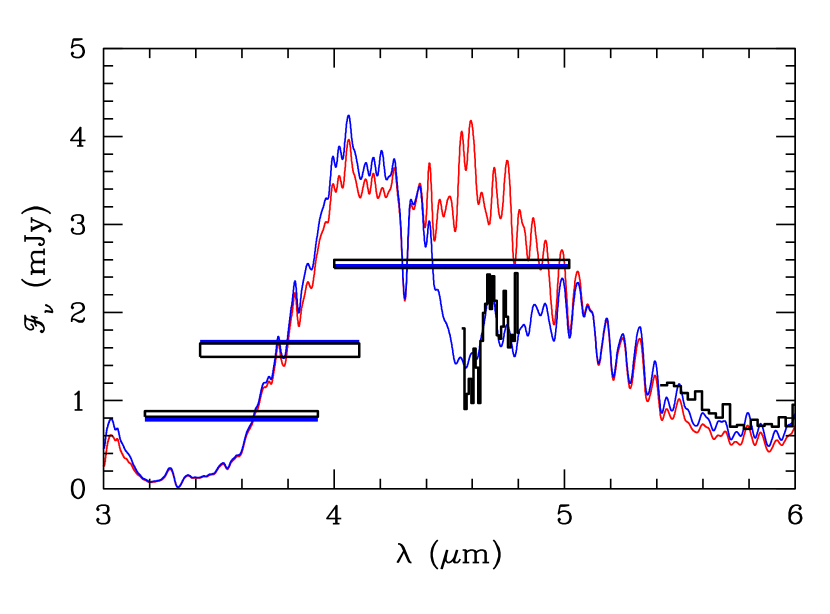
Photometric measurements of Gl 570D in the MKO (Golimowski et al., 2004) and the Spitzer IRAC [3.6] and [4.5] bands (Patten et al., 2006) provide additional relevant information. We generated synthetic fluxes by integrating the model spectra over the bandpasses111MKO system: Tokunaga et al. (2002); IRAC: http://ssc.spitzer.caltech.edu/irac/spectral_ response.html, and multiplying by , where is the radius obtained from our cloudless [M/H]=0 evolution sequences and is the distance (Perryman et al., 1997). The observed magnitudes were converted to fluxes by computing zero magnitude fluxes in each bandpass with a spectrum of Vega222www.stsci.edu/instruments/observatory/cdbs/calspec or from the flux calibration of the IRAC instrument333http://ssc.spitzer.caltech.edu/irac/calib/. A least squares fit of the three photometric points gives for our nominal model (K, and [M/H]=0). This best-fitting synthetic spectrum, its corresponding equilibrium spectrum and the photometry are shown in Fig. 4 along with the band spectrum. The band spectrum in the figure is scaled by a factor of 0.83 relative to the flux-calibrated spectrum in order to minimize the residuals with the model spectrum. This is a shift of about half of the calibration uncertainty of the spectrum. The figure clearly shows the strong and broad CO band, centered at 4.7m and complete with the bump at band center, that appears when vertical transport drives the carbon chemistry far out of equilibrium. The spectrum outside of the 4.4–5.0 m region is barely affected, however.
4.1.3 Summary: Optimal model
Figure 4 shows that a cloudless model with K, , [M/H]=0 and agrees with (1) the optical, near infrared and the 5–15m Spitzer IRS spectrum (Saumon et al., 2006), (2) the MKO and Spitzer IRAC [4.5] photometry, and (3) the flux level of the band spectrum within its uncertainties. The IRAC [3.6] flux is too low, however. In addition provides a better fit to the shape of the spectrum. This latter value also fits all of the data except for the photometry. Within the various sources of uncertainty, these two results for are barely compatible. For instance, the (non-Gaussian) statistical distribution that led to the determination has only 1.6% of the sample falling within the range .
We believe that fitting the shape of the band spectrum only is the more reliable way to determine the value of . This method depends primarily on the CO/H2O abundance ratio in the photosphere and much less on modeling details While the flux level in the Spitzer 4.5 m band is indicative of CO absorption, it does not specifically point to CO as the absorber and the filter is not well matched to the CO band. In addition, there is no photometric data point outside of and just to longer wavelength of the CO band, where absorption by H2O, which also occurs within the CO band, should dominate.
The photometric measurements are much more precise than the band spectrum calibration, however. They measure the spectral energy distribution in the vicinity of the 4–5m peak, which is strongly affected by the band of CH4 centered at 3.3m extending to m, and by the band of H2O on the long wavelength side of the peak. The CH4 line list is known to be incomplete at the temperatures of brown dwarf atmospheres. The modest success in fitting the 3–4m spectra of T dwarfs (Stephens et al., 2008) suggests that the inconsistency between the two solutions could be resolved in favor of the higher value of by invoking a higher CH4 opacity. Indeed the incompleteness of the CH4 line list implies that the CH4 opacity in our model is a lower limit to the actual opacity. Increasing the opacity in the red wing of the band of CH4 would nudge all three broad band fluxes in a direction that would increase the value of the best fitting . The flux removed from the increased CH4 absorption in the near infrared will reemerge primarily in low opacity windows. It is very likely that the shape of the 4–5m peak will be altered by flux redistribution caused by a change in the CH4 opacity, which could significantly change the value of that best fits the photometry.
Thus, we adopt as the most likely value for Gl 570D, based on the favored nominal model parameters (model C of Saumon et al. (2006)). Repeating the above analysis with the less favored but still possible values of model B of Saumon et al. (2006) (K, ), gives which is essentially identical within the uncertainty. The corresponding time scale of vertical mixing in the radiative region of the atmosphere of Gl 570D is to 3 hours. The complete infrared synthetic spectrum of our optimal model for Gl 570D is not shown because it is essentially indistinguishable from that shown in Fig. 2 of Saumon et al. (2006) which was computed with . The only region of the spectrum that is affected by the larger value of is between 3.8 and 5.0m, which is shown in Figs. 3 and 4.
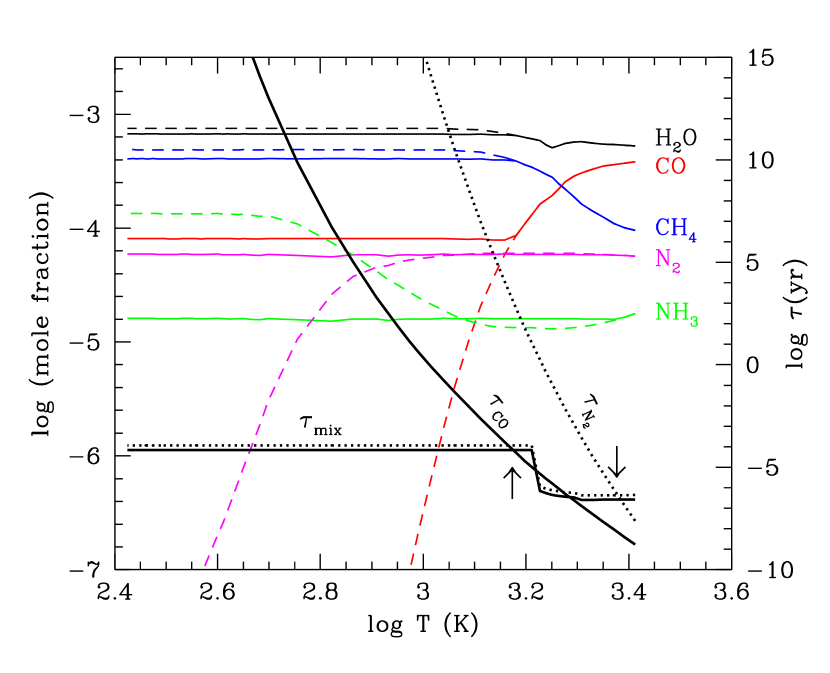
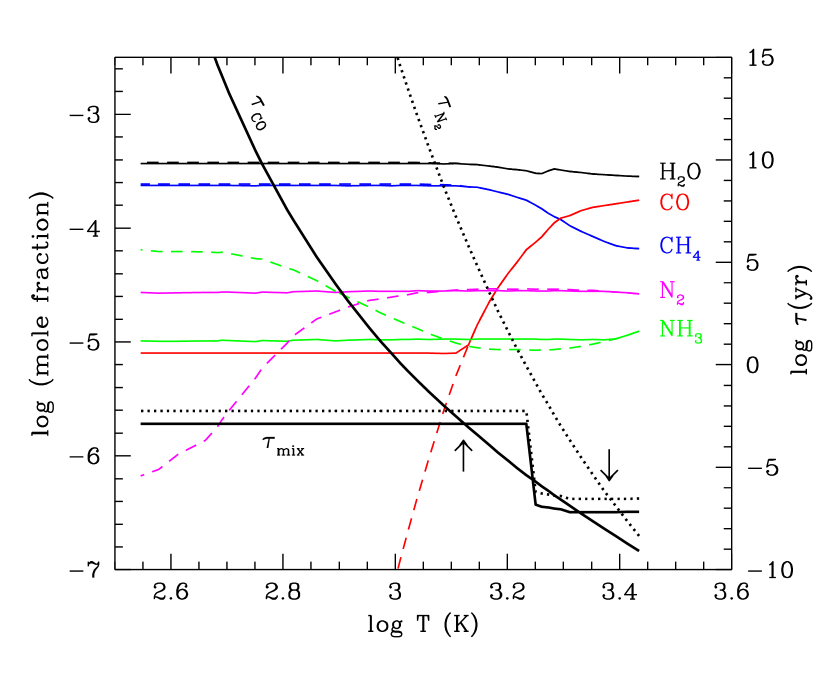
For the optimal model the composition of the atmosphere as a function of depth for the most important opacity sources is shown in Fig. 5. The chemistry of nitrogen is quenched in the convection zone where becomes shorter than , the time scale for conversion of N2 to NH3. This occurs at . In the upper atmosphere, the NH3 abundance is nearly a factor of ten lower than the equilibrium value. Because the eddy diffusion coefficient determines the mixing time scale in the radiative zone, the quenching level of the nitrogen chemistry is unaffected by the choice of ; rather it is determined by the convective mixing time scale. On the other hand, the carbon chemistry is quenched in the radiative zone around and its abundance depends sensitively on because the equilibrium mole fraction of CO has a steep dependence on depth in the atmosphere in low- models. In the upper part of the atmosphere the CO mole fraction is . Finally, the 4.7m band of CO and the 10–11m feature of NH3 probe the same level of the atmosphere, because the lines in both spectral regions are formed at –2.9.
4.2 2MASS 0937
4.2.1 Determination of , gravity and metallicity
Due to its very blue color, 2MASS 0937 has long been recognized as having low metallicity and/or high gravity (Burgasser et al., 2002, 2003; Burrows et al., 2002; Knapp et al., 2004; Burgasser et al., 2006b). Previous estimates give = 725-1000 K (Golimowski et al., 2004) and 700-850 K (Vrba et al., 2004), and (Knapp et al., 2004). More recently Burgasser et al. (2006b), using a calibrated set of spectral indices, found that 2MASS 0937 is metal poor with [M/H] between and . For [M/H], they obtain -840 K and -5.5. With the wealth of information provided by the wide spectral coverage now available, we can determine these parameters more reliably. The observed spectrum covers the intervals 0.63–1.01m, 1.03–1.345m, 1.40–2.53m and 5.13–15.35m. The integrated observed flux is erg s-1 cm-2, which represents about 70% of the total flux. The flux calibration uncertainties are % in the red, % in the near infrared, and % for the Spitzer IRS spectrum. The distance is pc (Vrba et al., 2004). The resulting uncertainty in the bolometric luminosity is %, or 0.027 dex, where we have combined the various flux calibration uncertainties rather than treating them as statistically independent variations.
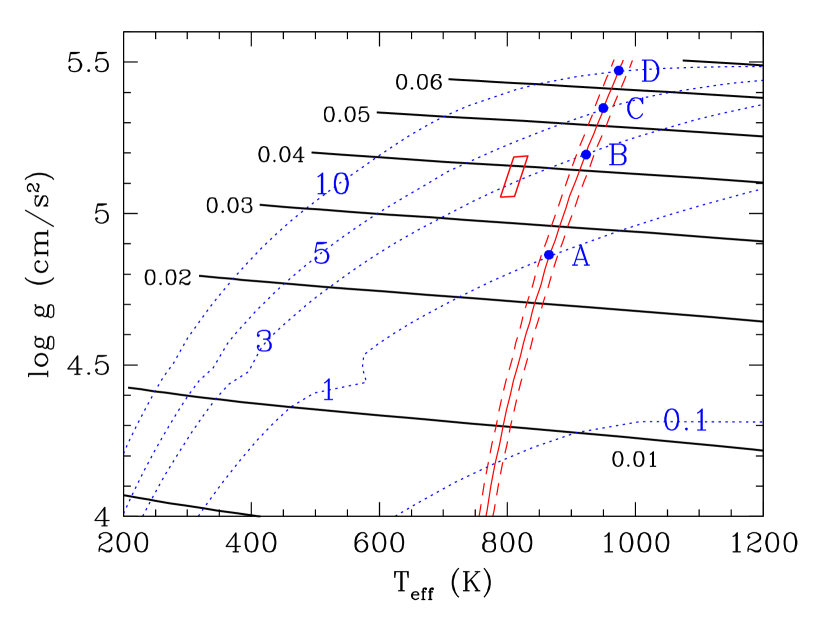
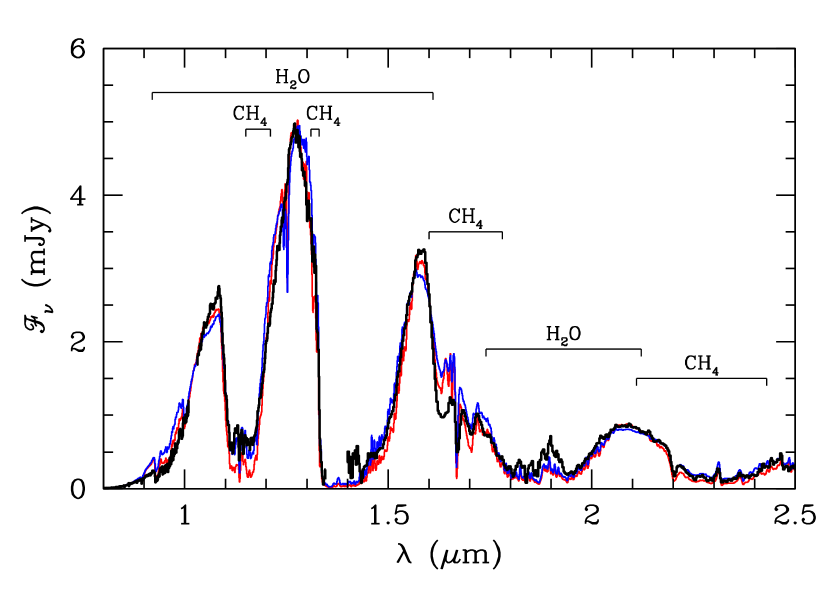
We first applied our suite of solar metallicity models and found, as expected, that the model overestimate the band flux by about 60%, even at the highest possible gravity of . A better match of the near-infrared spectrum, and the band flux in particular, thus requires a sub-solar metallicity. Applying our grid of model atmospheres, spectra, and evolution for [M/H]= to the method described in Geballe et al. (2001) and Saumon et al. (2006), we obtain the parameters shown in Fig. 6 and given in Table 2 for four different ages ranging from 1 to 10 Gyr. We will see below that models corresponding to ages of 1 Gy and less do not fit the data satisfactorily. We find that , the same luminosity as the T7.5 dwarf 2MASS J121711100311131 (Saumon et al., 2007). The red and near infrared spectra of these four models are nearly identical, as can be seen in Fig. 7 where the two extreme cases, models A and D, are plotted. The lower gravity model matches the data best, but the four models reproduce the and peak fluxes equally well. Note that the fluxes in the model spectra in Fig. 7 are absolute and have not been scaled to the observed spectrum. The model spectra were computed from parameters determined with the integrated spectral flux and the distance to 2MASS 0937 as the only input. The excellent agreement implies that the metallicity of 2MASS 0937 is close to [M/H], the value used for the rest of the analysis. For comparison, the values obtained with the solar metallicity models are shifted by 10-15 K lower in , dex lower in and dex lower in for a given age. These small variations, which are close to the uncertainties in the present determinations, demonstrate that a more accurate determination of the metallicity of 2MASS 0937 will not significantly affect the parameters given in Table 2.
The range of parameters between models A and D cannot be further constrained on the basis of the near infrared spectrum. Generally, the band flux (e.g., ) is a gravity indicator for a fixed . The models in Table 2 are nearly constant in . Higher gravities also imply higher , with compensating effects on the near infrared spectra (Fig. 7). As we had found in our analysis of Gl 570D (Saumon et al., 2006), the mid-infrared Spitzer IRS spectrum is more sensitive to variations in in the suite of solutions than is the near-infrared spectrum. We have compared each of the four models in Table 2 with the mid-infrared data, taking into account the spectrum of random pixel noise and the systematic % calibration uncertainty (Patten et al., 2006). Because there is a strong suspicion that the chemistry in the atmosphere of 2MASS 0937 is driven out of equilibrium by vertical mixing, we also consider out-of-equilibrium synthetic spectra computed with the parameters of models A through D. The mid-infrared spectrum is insensitive to the choice of the vertical mixing parameter (Saumon et al., 2006) and we arbitrarily choose a value of cm2/s. To constrain the set of solutions, we thus consider eight model spectra (the four models of Table 2, with both and cm2/s) and the observed 5-15m spectrum with its nominal calibration, the calibration modified by %, and finally by fitting only the shape of the spectrum, i.e. without regard of the absolute flux level.
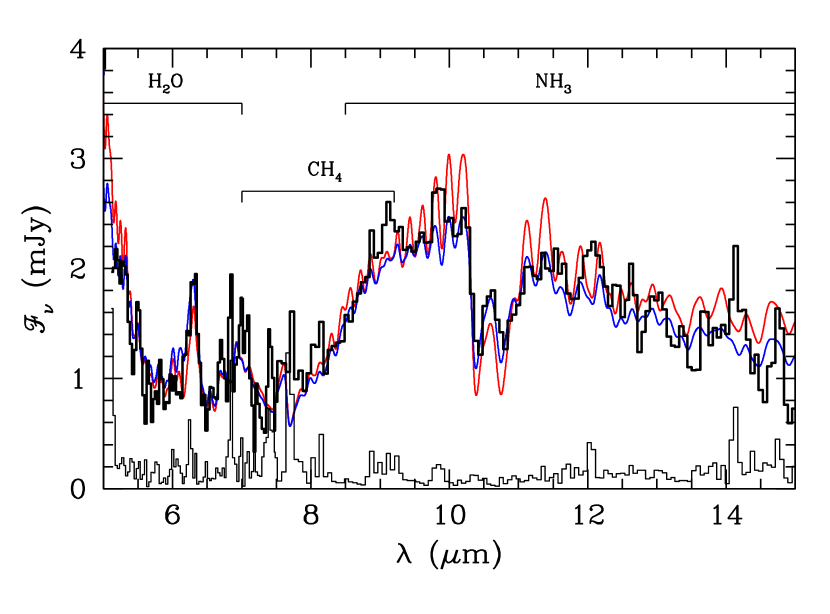
The goodness of fit of a particular model is measured by the , which includes the random uncertainty in the flux of each pixel. The ensemble of for these models reveals a clear picture. In every case, the best of the equilibrium models (A-D) is a much worse fit than the best non-equilibrium model, at more than an 8 level of significance. The IRS spectrum thus rules out equilibrium chemistry for nitrogen in 2MASS 0937. For the non-equilibrium case, models A through D fit the shape of the spectrum equally well. If absolute fluxes are considered, for all choices of calibration (within %) the lowest gravity model (A) is ruled out at . Models B through D can provide equally good fits depending on the choice of absolute calibration. For the nominal calibration, the best fit is obtained with model C. We conclude that the parameters of 2MASS 0937 fall within the range between models B and D in Table 2 and that vertical transport occurs in its atmosphere, resulting in a depletion of NH3. The synthetic spectrum for non-equilibrium model C is shown in Fig. 8 as well as the best equilibrium model (model B). The non-equilibrium model agrees very well with the data, although the fit is not perfect.
To summarize, combining the information in the red, near infrared, and mid-infrared spectra with the distance to 2MASS 0937 we find that to K, to 5.47, , the metallicity is close to [M/H], and the age is between 3 and 10 Gyr. These values confirm that 2MASS 0937 is a metal-poor brown dwarf with a fairly high gravity. The metallicity and gravity agree with the determinations of Burgasser et al. (2006b) and Knapp et al. (2004) but is substantially higher than previous determinations, except for that of Golimowski et al. (2004).
4.2.2 Fits of the band spectrum
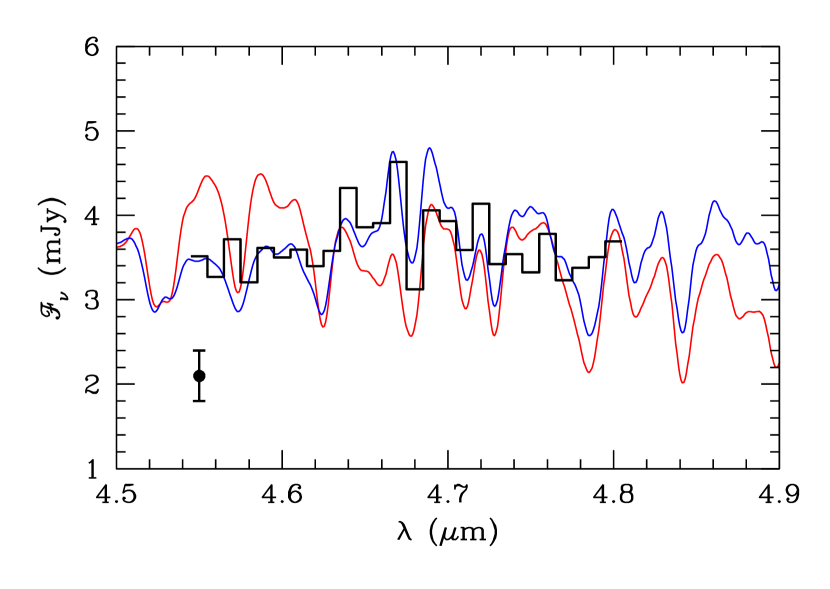
We fit the band spectrum of 2MASS 0937 to determine the value of the eddy diffusion coefficient using the procedure described in §4.1.1. In this case, the random noise in each pixel of the observed spectrum is estimated at W mm-1 and the systematic uncertainty in the flux calibration is estimated at % although the agreement with previous photometry is much better than this. We consider the three models B though D in this analysis. By fitting the shape of the band spectrum only, we find that for model C. The value increases slowly with among the suite of models but the differences with the above result remain well within the uncertainty. All three models give equally good fits to the shape of the band spectrum. An example of such a fit is shown in Fig. 9 where the non-equilibrium spectrum corresponding to model C with is in much better agreement with the shape of the band spectrum than the same model in equilibrium. The latter fails to produce the 4.665m bump seen in the data that indicates the presence of CO. This corroborates our conclusion based on the fit of the 5-15m spectrum that vertical mixing in the atmosphere of 2MASS 0937 causes the chemistry to depart from equilibrium.
By fitting absolute model fluxes to the data we obtain lower values of (Table 2). If we rescale the observed fluxes by factors of 0.8–0.75 (less than the nominal calibration uncertainty), then models B through D can all be made to give , and a consistent solution is found between fitting the shape of the band spectrum and its flux level. This value of the eddy diffusion coefficient corresponds to a mixing time scale of to 25 hours and a CO mole fraction of .
4.2.3 Photometry
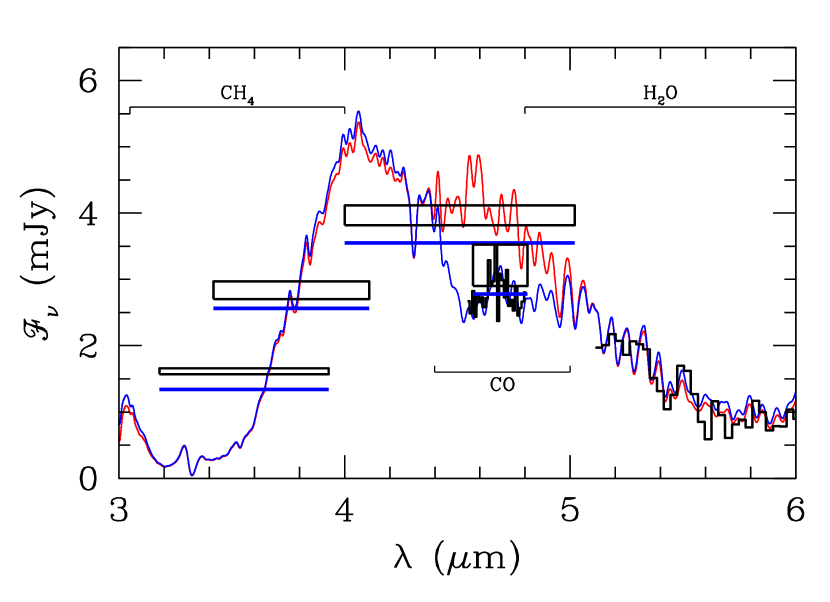
We attempted to fit the MKO and magnitudes (Golimowski et al., 2004) and the Spitzer IRAC [3.6] and [4.5] fluxes (Patten et al., 2006) as in §4.1.2. In this case however, it was not possible to closely match the shape of the 3.5–5m peak with any of our models, not even with discarded model A (Table 2), for any value of . In all cases, the modelled 3.3m band of CH4 is too deep, and the resultant and [3.6] fluxes are too low (Fig. 10). Values of that fit the [4.5] or the fluxes can be found but are different from each other. Using the model C parameters, we find , but both the fit and are very poor, with the [3.6] flux falling several standard deviations below the IRAC measurement. The 3.3m band of CH4 can be weakened by further decreasing the metallicity, or increasing , but the latter to a value that is incompatible with the shape of the band spectrum. Both of these possibilities appear unlikely, given the good agreement that we find with the spectroscopic data. A more complete line list for the CH4 band would increase the opacity and thus go in the wrong direction. The discrepancy between our best fitting model and the [3.6] and photometry might be attributable to the secondary effect of increasing the CH4 opacity and redistributing flux in the low opacity windows at wavelengths less than m into the 4–5m.
4.2.4 Summary: Optimal model
In view of the difficulty in fitting the 3–5m photometry and the likelihood that the model spectra are impacted by an incomplete CH4 linelist, we again rely on the shape of the band spectrum to determine the most likely value of , and thus conclude that . With the data in hand, we are unable to distinguish between models B, C, and D, as they give essentially equally good – or in the case of the photometry, equally poor – fits to the ensemble of data. Model C (K, , [M/H]=) with as an example, provides an excellent fit to the red and near infrared spectra and to the Spitzer IRS spectrum as well (Fig. 11). It also gives a good fit to the shape of the band spectrum (Fig. 9, although it underestimates the flux by (Fig. 10). This model also underestimates the [3.6], [4.5], and fluxes substantially, however.
The chemical composition of the atmosphere as a function of depth is shown in Fig. 12. In the region of formation of the 4.7m band of CO (), vertical transport increases the CO abundance by about two orders of magnitude. The NH3 abundance decreases by dex which accounts for the large effect seen in Fig. 8. The H2O and CH4 mole fractions are barely affected by non-equilibrium chemistry. As was found for Gl 570D, the nitrogen chemistry is quenched deep in the convection zone of the atmosphere (at ) and thus is unaffected by the value of . On the other hand, the carbon chemistry is quenched much higher in the atmosphere, at .
5 Conclusions
Low resolution band spectra of Gl 570D and 2MASS 0937 clearly reveal the presence of photospheric CO via the CO absorption minimum between the P and R branches of the band. These are the first spectroscopic detections of CO in late T dwarfs since the original discovery in the T7p dwarf Gliese 229B. The observed spectra are well-reproduced by model spectra with CO mole fractions of and , respectively.
Atmospheric models and synthetic spectra based on equilibrium chemistry predict that the CO abundance should be too low to form a detectable CO band and that instead the band spectrum should be dominated by H2O features. Thus, the detection of prominent CO absorption in the spectra of these two T dwarfs is strong evidence for the presence of vertical mixing in the radiative part of their atmospheres. This interpretation is reinforced by independent evidence for depletions of NH3 by a factor of 8 to 10 compared to the expectations from chemical equilibrium calculations in both Gl 570D (Saumon et al., 2006) and 2MASS 0937 (§4.2.1). The concordance of deviations of the NH3/N2 and the CO/CH4 ratios from chemical equilibrium in both objects can be explained consistently by a model including vertical mixing in the atmosphere and the kinetics of carbon and nitrogen chemistry. The present work firmly establishes this process in cool T dwarfs.
The model spectra that include vertical mixing reproduce the entire observed SEDs of both dwarfs very well, with the exception of the photometry of the 4–5m peak in 2MASS 0937. Similar difficulties have been encountered with 2MASS J041519540935066 (T8) and 2MASS J121711100311131 (T7.5) (Saumon et al., 2007). Given the overall success of our cloudless models at reproducing the SEDs of late T dwarfs, we think that this problem is related to well-known remaining flaws in the models. Since the 4–5m peak occurs in a low opacity window, it should be sensitive to the flux redistribution that we expect will occur in models that will benefit in the future from an improved line list for CH4 at wavelengths below 1.7m (see Fig. 7 for example). Our non-equilibrium spectra are currently computed as post-processing on a fixed atmospheric structure computed with abundances from chemical equilibrium. A self-consistent calculation of non-equilibrium models would also redistribute the flux, but the effect should be relatively modest (Hubeny & Burrows, 2007).
The values of and of derived for Gl 570D and 2MASS 0937 depend directly on the choice of reaction pathway for the kinetics of the carbon chemistry and on the choice of quenching scheme. As in our previous work, we have adopted the “fast” reaction rate of Yung et al. (1988) and the quenching scheme of Smith (1998). The latter is physically and computationally more realistic than the simple scheme that is generally applied (Hubeny & Burrows, 2007; Fegley & Lodders, 1994). Its application to modeling the excess CO in Jupiter’s troposphere then requires the fast reaction rate of Yung et al. (1988) to reproduce the spectroscopic data (Bézard et al., 2002). We have used those same choices for the kinetics of carbon chemistry and the quenching scheme in the past, so the present determinations of and our previous estimates (Saumon et al., 2007) are consistent. Using the “slow” kinetic scheme of Prinn & Barshay (1977) would result in significantly lower values of and longer mixing time scales.
The most direct way to determine the vertical mixing time scale in the atmosphere with the data currently available is from the CO abundance derived by fitting models to the shape of the band spectrum. The time scale is parametrized by the eddy diffusion coefficient, , for which we find for Gl 570D, which corresponds to a mixing time scale of 0.1 to 3 hours. While the uncertainty in the mixing time scale remains large, it is crudely comparable to the measured rotation period of hours, where is the inclination of the axis of rotation to the line of sight (Zapatero Osorio et al., 2006). For 2MASS 0937, , implying a much longer mixing time scale of to 25 hours, which is also comparable to the –10 hour rotation periods of T dwarfs (Zapatero Osorio et al., 2006). This suggests that the vertical mixing process is coupled to the rotation. The eddy diffusion coefficients of these two dwarfs differ by nearly two orders of magnitude, which seems a rather large variation for two T dwarfs whose physical properties are fairly similar: , and . Other properties in which there are significant differences between the two dwarfs in this study are the effective temperature, which differs by 100–150 K and metallicity, where [M/H]=0.3 to 0.4. In the absence of a physical model for vertical mixing in brown dwarf atmospheres, it is difficult to appreciate the significance of these differences between Gl 570D and 2MASS 0937. In this context, a measure of the rotational velocity of 2MASS 0937 would be of interest.
Eddy diffusion coefficients (or bounds on their values) have been derived for the atmospheres of all of the solar system giants, often by comparing models with measurements of the vertical profiles of various photochemical products. Other methods have been used as well. As reviewed by Moses et al. (2004), estimates for Jupiter’s upper stratosphere cluster around (cm2/s)=6, comparable to or larger than the values we derive here for T dwarfs, despite Jupiter’s four orders of magnitude smaller heat flow and nearly two orders of magnitude lower gravity. Constraints have even been placed on eddy mixing in the atmosphere of Neptune, where similar values of are inferred (Bishop et al., 1995). Such mixing in the radiatively-stable solar system stratospheres is often attributed to the propagation and/or breaking of atmospheric waves. Bishop et al. review the literature in some detail and point out that likely varies vertically through an atmosphere, increasing with falling density. Such a shortening of the mixing time scale with height would leave the quenching level and the resulting chemistry unchanged (Figs. 5 and 12). As such, the values we derived from the observations are local values at the quenching level of the atmosphere, which is at both higher pressures and higher densities than the regions typically probed in giant planet atmospheres. The relatively similar mixing coefficients in such a great diversity of atmospheres is striking, even though the derived values apply to different atmospheric regions. Further investigation of the underlying mechanisms responsible for mixing in giant planet and brown dwarf atmospheres would be of interest and may also find applicability to the study of extrasolar giant planet stratospheres.
Finally, we have derived the first set of well-constrained physical parameters for 2MASS 0937 and have firmly established that this T6p dwarf has a subsolar metallicity and a moderately high gravity, as has long been suggested. Our analysis shows that, like other late T dwarfs, its mid-infrared and band spectra can only be fit with models in which both the nitrogen and the carbon chemistry depart substantially from chemical equilibrium. This reinforces the conjecture that vertical mixing and the associated departures from equilibrium chemistry are common, if not ubiquitous, among late T dwarfs.
References
- Bézard et al. (2002) Bézard, B., Lellouch, E., Strobel, D., Maillard, J.-P., & Drossard, P. 2002, Icarus, 159, 95
- Bishop et al. (1995) Bishop, J., Atreya, S. K., Romani, P. N., Orton, G. S., Sandel, B. R., & Yelle, R. V. 1995, Neptune and Triton, 427
- Burgasser et al. (2000) Burgasser, A. J., et al. 2000, ApJ, 531, L57
- Burgasser et al. (2006b) Burgasser, A.J., Burrows, A., & Kirkpatrick, J.D. 2006, ApJ, 639, 1095
- Burgasser et al. (2002) Burgasser, A.J., Kirkpatrick, J.D., Brown, M.E., Reid, I.N., Burrows, A., Liebert, J., Matthews, K., Gizis, J.E., Dahn, C.C., Monet, D.G. and 2 coauthors, 2002, ApJ, 564, 421
- Burgasser et al. (2003) Burgasser, A. J., Kirkpatrick, J. D., Liebert, J., & Burrows, A. 2003, ApJ, 594, 510
- Burgasser et al. (2006) Burgasser, A. J., Geballe, T. R., Leggett, S. K., Kirkpatrick, J. D. & Golimowski, D. A. 2006, ApJ, 637, 1067
- Burrows et al. (2002) Burrows, A., Burgasser, A. J., Kirkpatrick, J. D., Liebert, J., Milsom, J. A., Sudarsky, D., & Hubeny, I. 2002, ApJ, 573, 394
- Cushing et al. (2008) Cushing, M.C., Marley, M.S., Saumon, D., Kelly, B.C., Vacca, W.D., Rayner, J.T., Freedman, R.S., Lodders, K., Roellig, T.L. 2008, ApJ, 678, 1372
- Cushing et al. (2006) Cushing, M.C., Roellig, T.L., Marley, M.S., Saumon, D., Leggett, S.K., Kirkpatrick, J.D., Wilson, J.C., Sloan, G.C., Mainzer, A.K., Van Cleve, J.E., Houck, J.R. 2006, ApJ, 648, 614
- Fegley & Lodders (1994) Fegley, B. Jr. & Lodders, K. 1994, Icarus, 110, 117
- Fegley & Lodders (1996) Fegley, B. Jr. & Lodders, K. 1996, ApJ, 472, L37
- Geballe et al. (2002) Geballe, T. R., et al. 2002, ApJ, 564, 466
- Geballe et al. (2001) Geballe, T. R., Saumon, D., Leggett, S.K., Knapp, G.R., Marley, M.S. & Lodders, K. 2001, ApJ, 556, 373
- Golimowski et al. (2004) Golimowski, D. A., et al. 2004, AJ, 127, 3516
- Griffith & Yelle (1999) Griffith, C.A., & Yelle, R.V. 1999, ApJ, 519, L85
- Hodapp et al. (2003) Hodapp, K.W., et al. 2003, PASP, 115, 1388
- Houck et al. (2004) Houck, J.R., et al. 2004, ApJS, 154, 18
- Hubeny & Burrows (2007) Hubeny, I. & Burrows, A. 2007, ApJ, 669, 1248
- Kirkpatrick et al. (1999) Kirkpatrick, J. D., Reid, I.N., Liebert, J., Cutri, R.M., Nelson, B., Beichman, C.A. Dahn, C.C., Monet, D.G., Gizis, J.E. & Skrutskie, M.F. 1999, ApJ, 519, 802
- Knapp et al. (2004) Knapp, G. N., et al. 2004, AJ, 127, 3553
- Leggett et al. (2007a) Leggett, S. K., Marley, M. S., Freedman, R., Saumon, D., Liu, M. C., Geballe, T. R., Golimowski, D. A., Stephens, D. C. 2007a, ApJ, 667, 537
- Leggett et al. (2007b) Leggett, S. K., Saumon, D., Marley, M. S., Geballe, T. R., Golimowski, D. ., Stephens, D., & Fan, X. 2007b, ApJ, 655, 1079
- Lodders & Fegley (2002) Lodders, K. & Fegley, B. Jr. 2002, Icarus, 155, 393
- Moses et al. (2004) Moses, J. I., et al. 2004, Jupiter. The Planet, Satellites and Magnetosphere, 129
- Noll, Geballe & Marley (1997) Noll, K. S., Geballe, T.R. & Marley, M. S. 1997, ApJ, 489, L87
- Oppenheimer et al. (1998) Oppenheimer, B. R., Kulkarni, S. R., Matthews, K. & van Kerkwijk, M. H. 1998, ApJ, 502, 932
- Patten et al. (2006) Patten, B.M., et al. 2006, ApJ, 651, 502
- Perryman et al. (1997) Perryman, M. A. C., et al. 1997, A&A, 323, L49
- Prinn & Barshay (1977) Prinn, R.G., & Barshay, S.S. 1977, Science, 198, 1031 Marley, M.S., Saumon, D., Leggett, S.K., Kirkpatrick, J.D., Wilson, J.C., Sloan, G.C., Mainzer, A.K., Van Cleve, J.E., Houck, J.R. 2006, ApJ, 648, 614
- Santos et al. (2005) Santos, N. C., Israelian, G., Mayor, M. Bento, J. P., Almeida, P. C., Sousa, S. G. & Ecuvillon, A. 2005, A&A, 437, 1127
- Saumon et al. (2000) Saumon, D., Geballe, T. R., Leggett, S. K., Marley, M.S., Freedman, R. S., Lodders, K., Fegley, B., Jr. & Sengupta, S. K. 2000, ApJ, 541, 374
- Saumon & Marley (2008) Saumon, D. & Marley, M. S., submitted to ApJ
- Saumon et al. (2006) Saumon, D., Marley, M. S., Cushing, M.C., Leggett, S.K., Roellig, T.L., Lodders, K. & Freedman, R.S. 2006, ApJ, 647, 552
- Saumon et al. (2007) Saumon, D., Marley, M. S., Leggett, S.K., Geballe, T.R., Stephens, D., Golimowski, D. A., Cushing, M. C., Fan, X., Rayner, J. T., Lodders, K. & Freedman, R. S. 2007, ApJ, 665, 1136
- Saumon et al. (2003) Saumon, D., Marley, M. S., Lodders, K. & Freedman, R. S. 2003, in IAU Symp. 211, Brown Dwarfs, ed. E. L. Martín (San Francisco: ASP), 345
- Smith (1998) Smith, M.D. 1998, Icarus, 132, 176
- Stephens et al. (2008) Stephens, D., Leggett, S.K., Saumon, D., Marley, M.S., Cushing, M.C., Geballe, T.R., Golimowski, D.A. & Fan, X. 2008, submitted to the ApJ.
- Thorén & Feltzing (2000) Thorén, P. & Feltzing, S. 2000, A&A, 363, 692
- Tokunaga et al. (2002) Tokunaga, A.T., Simons, D.A. & Vacca, W.D. 2002, PASP, 114, 180
- Valenti & Fisher (2005) Valenti, J. A. & Fisher, D. A. 2005, ApJS, 159, 141
- Vrba et al. (2004) Vrba, F. J., Henden, A. A., Luginbuhl, C. B., Guetter, H. H., Munn, J. A., Canzian, B., Burgasser, A. J., Kirkpatrick, J.D., Fan, X., Geballe, T. R., and 5 coauthors, 2004, AJ, 127, 2948
- Yung et al. (1988) Yung, Y.L., Drew, W.A., Pinto, J.P., & Friel, R.R. 1988, Icarus, 73, 516
- Zapatero Osorio et al. (2006) Zapatero Osorio, M.R., Martín, E.L., Bouy, H., Tata, R., Deshpande, R. & Wainscoat, R.J. 2006, ApJ, 647, 1405


| UT Date | Source Name | Exposure (min) | Calib. star |
|---|---|---|---|
| 20040429 | Gl 570D | 64 | HIP 78585 |
| 20040430 | Gl 570D | 64 | HIP 78585 |
| 20041230 | 2MASS 0937 | 90 | HIP 52959 |
| 20050116 | 2MASS 0937 | 84 | HIP 52959 |
| 20050126 | 2MASS 0937 | 108 | HIP 52959 |
| 20050215 | 2MASS 0937 | 84 | HIP 40843 |
| 20050222 | Gl 570D | 105 | HIP 67945 |
| 20050301 | Gl 570D | 96 | HIP 77610 |
| 20050302 | Gl 570D | 63 | HIP 67945 |
| Model | Mass | Radius | Age | ccFor the nominal flux calibration of the data. | |||
|---|---|---|---|---|---|---|---|
| (K) | (cm/s2) | (Gyr) | (cm2/s) | ||||
| A | 865 | 4.86 | 27 | 0.0984 | 1.0 | ||
| B | 923 | 5.20 | 45 | 0.0870 | 3.0 | ||
| C | 950 | 5.35 | 57 | 0.0818 | 5.0 | ||
| D | 974 | 5.47 | 69 | 0.0778 | 10.0 |