Driving Turbulence and Triggering Star Formation by Ionizing Radiation
Abstract
We present high resolution simulations on the impact of ionizing radiation of massive O-stars on the surrounding turbulent interstellar medium (ISM). The simulations are performed with the newly developed software iVINE which combines ionization with smoothed particle hydrodynamics (SPH) and gravitational forces. We show that radiation from hot stars penetrates the ISM, efficiently heats cold low density gas and amplifies over-densities seeded by the initial turbulence. The formation of observed pillar-like structures in star forming regions (e.g. in M16) can be explained by this scenario. At the tip of the pillars gravitational collapse can be induced, eventually leading to the formation of low mass stars. Detailed analysis of the evolution of the turbulence spectra shows that UV-radiation of O-stars indeed provides an excellent mechanism to sustain and even drive turbulence in the parental molecular cloud.
Subject headings:
stars: formation — ISM: structure — turbulence — ultraviolet: ISM — methods: numericalgritschm@usm.uni-muenchen.de
1. Introduction
Some of the most spectacular structures in the molecular ISM are observed in the vicinity of hot O/B-stars or associations, e.g. the Horsehead nebula (B33), the three pillars of creation in M16 and the Elephant trunk (BRC37) in IC1396. For the pillars in M16 Sugitani et al. (2002) find a head to tail structure with the denser head pointing towards the OB stars of NGC661. In addition, young stellar objects (YSOs) are present at the tips of the pillars. In the Horsehead nebula Ward-Thompson et al. (2006) report two core-like structures that might undergo subsequent gravitational collapse. Very recent observations by Ikeda et al. (2008) report several YSOs close to the tip of BRC37. As a common feature these pillar-shaped nebulae point towards a source of ionizing radiation and show signs of present or future star formation at their tips.
Up to now the precise physical processes leading to the formation of these structures are not fully understood. The morphologies suggest that feedback effects of UV-radiation and winds of massive stars play an important role in the formation of the pillars. In addition, the radiation might have a strong impact on the overall evolution of the parental cloud. Furthermore, molecular clouds are observed to be highly turbulent structures. There is evidence that this turbulence can support the clouds against gravitational collapse and thereby control star formation. As hydrodynamic and MHD turbulence decays rather quickly, the only way to explain this high level of turbulence would be to drive the turbulence - either on large scales by i.e. supernova explosions or on small scales from within the cloud by stellar outflows, winds or ionization (see e.g. Elmegreen & Scalo 2004 and Mac Low & Klessen 2004, for reviews). The possibility of ionization driven turbulence has been indicated by e.g. semi-analytic models of Krumholz et al. (2006). In this Letter we test the hypothesis using high resolution numerical simulations with the newly developed code iVINE (Gritschneder et al., 2009, hereafter G08).
On the theoretical side progress has been made since Elmegreen et al. (1995) first presented two-dimensional, grid-based simulations showing that the expansion of an HII region into the surrounding ISM can trigger star formation by sweeping up the cold material. This is called ’collect and collapse’. Another proposed scenario is the ’radiation driven implosion’, where preexisting density structures are driven into collapse (see e.g. Bertoldi 1989, Kessel-Deynet & Burkert 2003 and G08).
For the numerical treatment of radiation in simulations several codes have been developed (see Iliev et al. 2006 and references therein). Recent applications for the treatment of ionizing radiation in grid based codes include e.g. Mellema et al. (2006) and Krumholz et al. (2007). In SPH-codes implementations have been presented by Dale et al. (2005), Pawlik & Schaye (2008) and Altay et al. (2008). Simulations by Dale et al. (2007) show that ionizing radiation can slightly enhance the formation of cores in a globally unbound molecular cloud of . With their choice of initial conditions the positive feedback, the additional or faster formation of cores, outweighs the negative feedback, the disruption of cores. All these applications calculate the effect of a point source on the surrounding medium, thereby focussing much more on the global effect of the ionization. However, neither the detailed morphology of the gas nor the impact of the ionizing radiation on the turbulence has been investigated so far.
2. Initial Conditions
We set up a box of gas with sides pc long at a temperature of K and a mean number density of , which resembles a slightly denser part of a molecular cloud. The gas mass in the box is which corresponds to Jeans masses. To mimic initial turbulence we employ a supersonic turbulent velocity field (Mach 10) with a steep power-law , where only the largest modes are populated initially. This setup is allowed to freely decay under the influence of isothermal hydrodynamics simulated with the tree/SPH-code VINE (Wetzstein et al. 2008, Nelson et al. 2008). The individual particle time-steps in VINE are determined by using an accuracy parameter of and a Courant-Friedrichs-Lewy (CFL) tolerance parameter of . We also use an additional time-step criterion based on the maximum allowed change of the smoothing length with an accuracy parameter of .
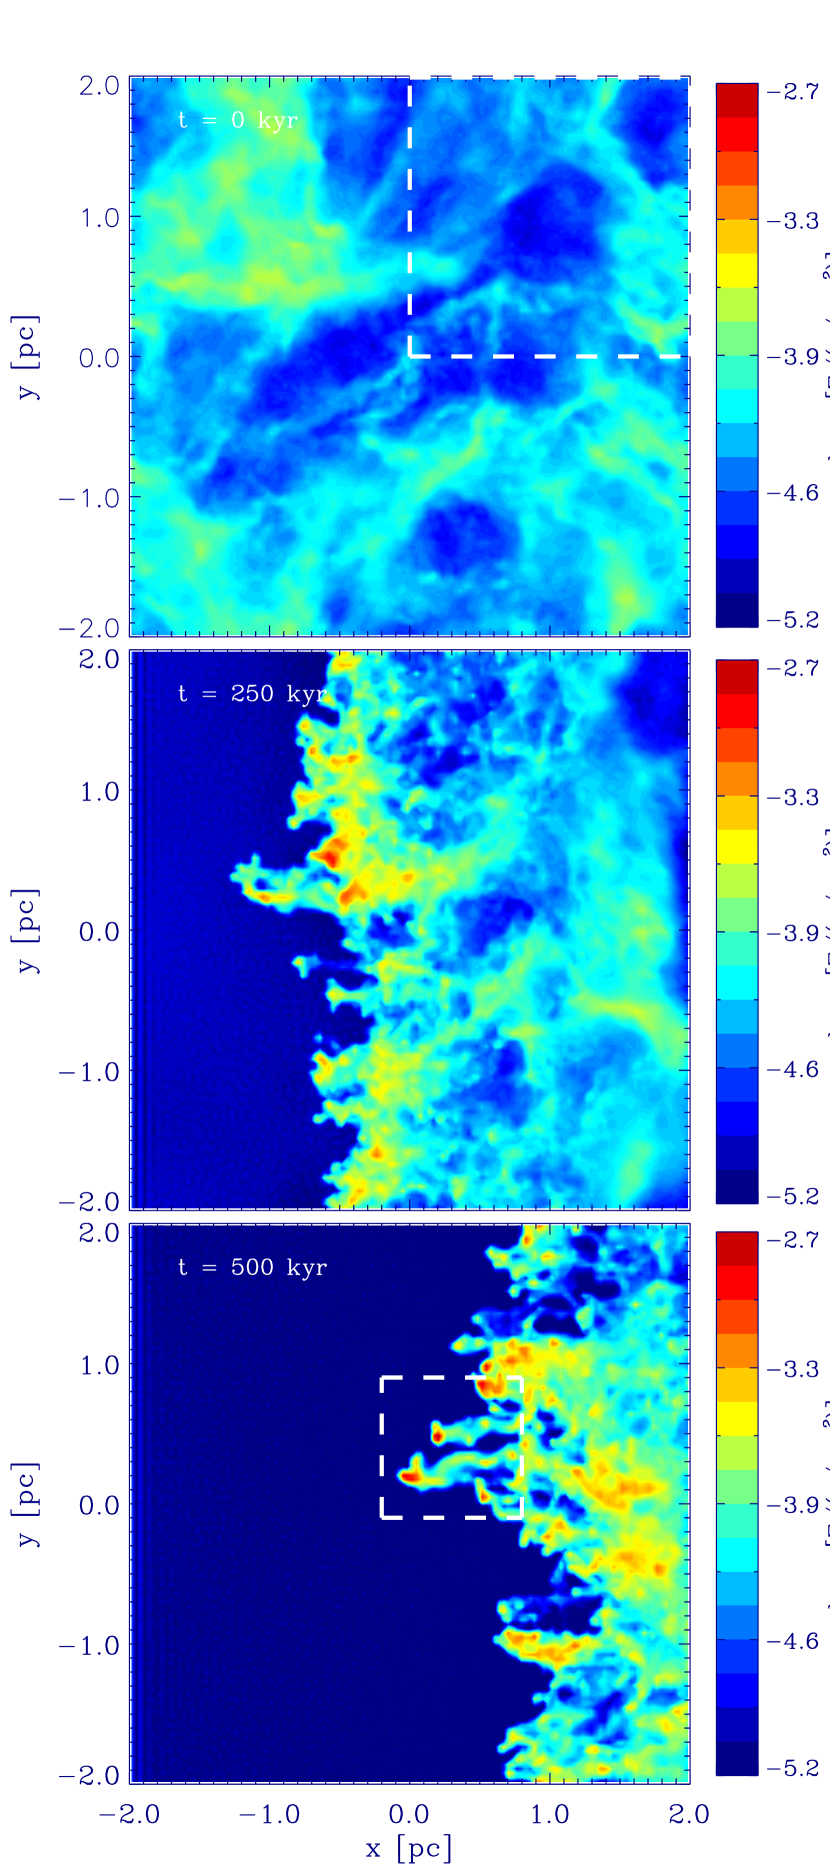
After Myr a Kolmogorov-like power-law with is well established on all resolvable scales. The velocities now correspond to Mach 5. This initial setup with the turbulent velocities is shown in Fig. 1 (top panel), the corresponding power-spectrum in Fig. 2 (top panel).
With these turbulent initial conditions we perform two simulations, one with and one without the inclusion of ionization. To account for the UV-radiation of a young massive star we use iVINE (G08), a new parallel implementation of ionizing radiation in the tree-SPH code VINE. Here we assume plane-parallel infall of UV-radiation onto one transparent side of the simulated area, which enables us to perform simulations at yet unmatched high resolution. From the surface the radiation is propagated by a ray-shooting algorithm. The size of the rays is determined by the smoothing-length of the SPH-particles, i.e. the width a particle occupies. Along these rays the radiation is calculated. This provides us with an ionization degree for each SPH-particle, which is then used to assign a new temperature to each particle by linear interpolation.
| (1) |
where K is the initial temperature of the cold, unionized gas and K is the average temperature of the ionized gas (see e.g. Shu, 1991). The gas is assumed to be atomic hydrogen. Both gas components are close to thermal equilibrium since the heating and cooling timescales are much shorter than the dynamical timescales. We treat the gas with an isothermal equation of state () as for the density range in our simulations heating and cooling should balance each other to approximate isothermality (see e.g. Scalo et al., 1998). However, in reality the situation is more complicated. Recent simulations by Glover & Mac Low (2007) indicate an equation of state of the thermal equilibrium gas which is softer than isothermal (). For a detailed prescription of the iVINE-code along with several analytical test cases see G08. In the simulations presented here the radiation was calculated on more than rays, with the additional inclusion of five levels of refinement, leading to a spatial resolution of pc in the radiation. The photon flux per unit time and area is set to , allowing the radiation to penetrate the first of the cloud immediately. This corresponds to setting up our simulation to be right at the border of the Strömgren-sphere (Strömgren, 1939), which can be immediately ionized by an O-star or association.
The radiation is impinging from the negative x-direction. Hydrodynamics is calculated with periodic boundaries in the y- and z-direction. The boundary is assumed to be reflecting in the negative x-direction to represent conservation of flux towards the star, whereas in the positive x-direction the gas is allowed to stream away freely. Gravitational forces are calculated without boundaries. This is valid as the free-fall time of the whole simulated area is Myr, which is much larger than the simulation time. To ensure a correct integration of all quantities we use the individual time-stepping-scheme of VINE with the same parameters as for the freely decaying turbulence (see above). For the tree-based calculation of gravitational forces we use a multi-pole acceptance criterion (MAC, Springel et al. 2001) with a tree accuracy parameter of . The correct treatment of the ionization and the resulting acceleration of the particles is obtained by a modified CFL-condition as discussed in G08. The simulations are performed with gas particles on a SGI Altix 3700 Bx2 supercomputer. The entire calculation took approximately 100 wall clock hours on 16 CPUs.
3. Results
3.1. Morphology and Formation of Cores
At the beginning of the simulation the R-type front immediately reaches into the first of the box, with the radiation penetrating further into the low density parts of the cold gas. After a hydrodynamical crossing timescale of the hot gas (kyr)111This timescale is calculated by taking the sound speed of the hot ionized gas and the average penetration length of the ionization of pc into account. the ionized gas reacts to its increase in temperature and starts to exert pressure on the cold gas. The cold gas is compressed and pushed away from the source, leading to a systematic velocity in the x-direction. At the same time the radiation has penetrated and ionized the ISM along channels of low density gas. Now these low density regions expand and start compressing the denser, unionized regions especially tangential to the direction of radiation. Thus the preexisting density structures, which are seeded by the turbulent initial conditions get enhanced as shown in Fig. 1.
The combination of overall and tangential compression leads to elongated structures that keep sweeping up cold gas. After kyr (Fig. 1, middle panel) the dominant structures are already excavated by the combination of radiation and the pressure of the hot gas. From now on the evolution is mainly dominated by the hydrodynamic interactions between the hot and cold phase of the gas.
After kyr (Fig. 1, bottom panel) the morphology is remarkably reminiscent of the observed structures. The pillars in our simulations are indeed very complex structures with a cork-screw type, torqued morphology and show rotational motion around their main axis, as it is observed (Gahm et al., 2006). Up to now it has been suggested that these complex morphologies arise due to magnetic fields, which are not included in our simulations. It is very likely that the pillars in M16 are a snapshot of the formation scenario proposed here. At this stage the densest region (indicated by the center of the white box in Fig. 1, bottom panel) undergoes gravitational collapse, the simulation is slowed down considerably and we terminate it. Future simulations with the inclusion of e.g. sink particles to avoid the detailed calculation of the further gravitational collapse leading to low mass stars will allow us to trace the subsequent evolution of the whole region. We call the most prominent feature in the white box in Fig. 1 (bottom panel) ’pillar I’ and the second largest ’pillar II’, the collapsing compact core is at the tip of pillar II. Their respective masses are , and . The compact core is defined as all material with a number density above in a region of pc around the peak density (see G08). Observations show that star formation is taking place close to the tips of the evolving structures (Snider et al., 2007). The same is true for our simulations. In the process of sweeping up the dense material lags behind, gaining less momentum and thus leading to very high density enhancements near the radiation front. In contrast, the simulation without UV-radiation does not show any signs of gravitational collapse.
Overall the scenario is very similar to the ’collect and collapse’ model, as the denser regions would not collapse on their own on the timescale simulated and the sweeping up of material plays a vital role. We call it ’collect and collapse with turbulent seeds’.
3.2. Turbulent Evolution
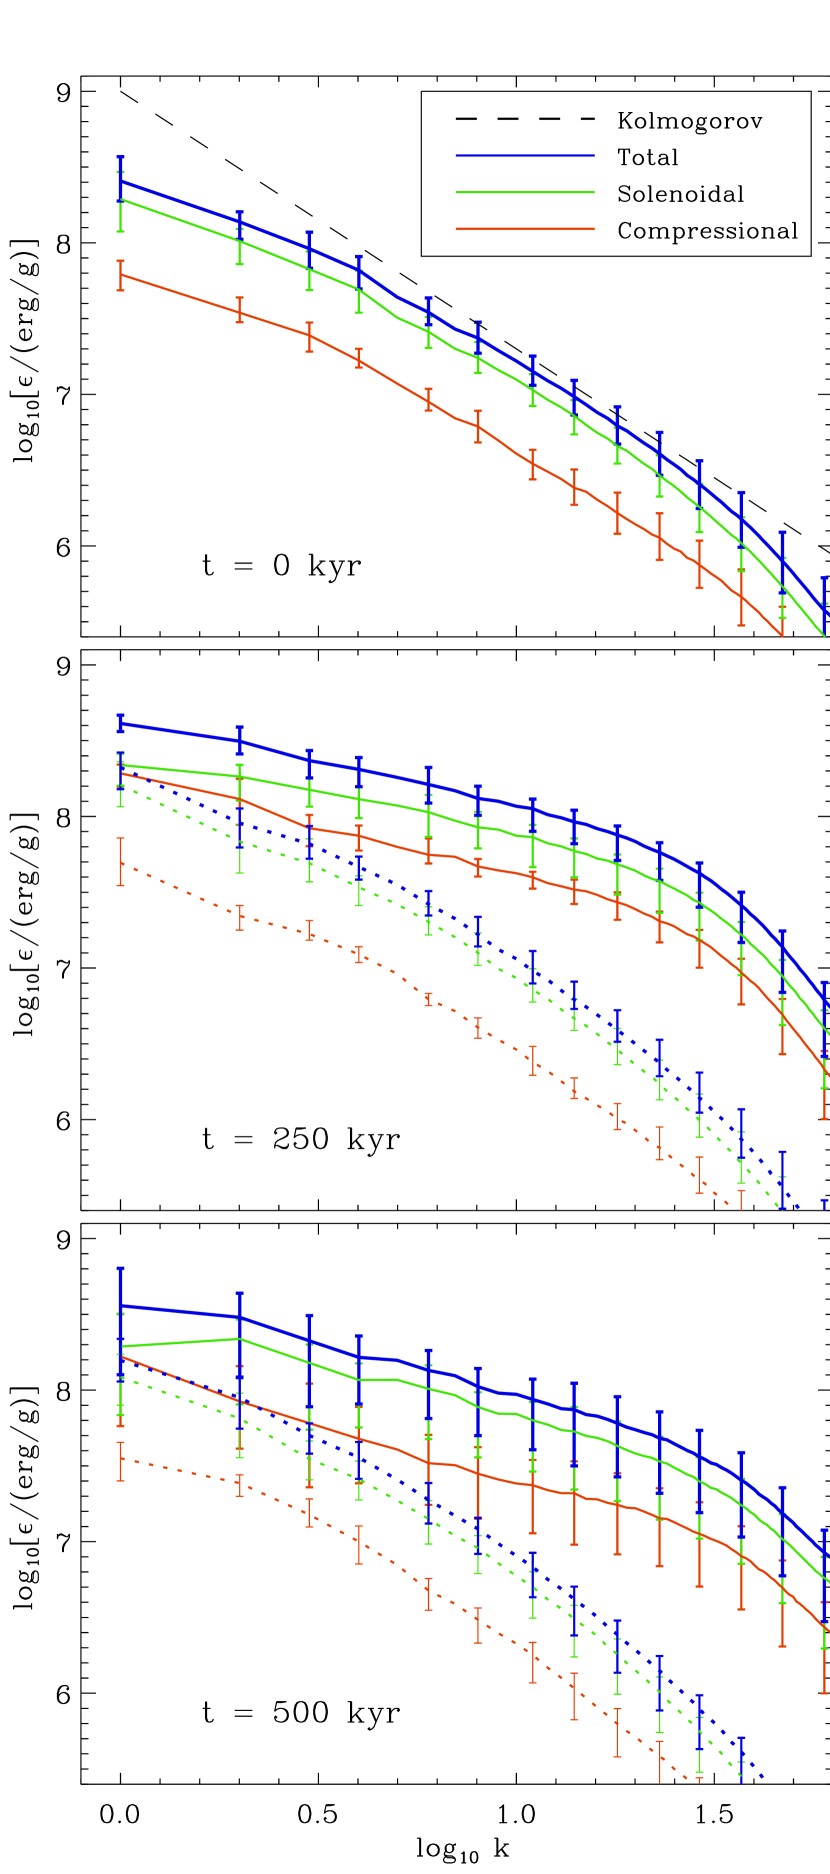
For the discussion of the evolution of the density weighted spectra from the run with ionization we perform a control run with the same initial conditions and accuracy parameters as the main simulation but without the inclusion of UV-radiation. In the comparison run no sign of star formation can be detected. This is reasonable, since the cloud is not set up to become gravitationally unstable as the total time of the simulation is much less than . The comparison is shown at kyr, kyr and kyr (Fig. 2). We analyze the turbulent spectrum in four cubic domains in the backward domain of the simulation, spanning pc in each direction (one is indicated in Fig.1, top panel, the other three are shifted in the negative y- and z-direction, respectively). Thus, it is guaranteed that there is always enough cold gas in the volume to achieve sensible results. To avoid a bias by either the ionized gas or the forming high density regions we take into account only gas with a number density . The particles are binned on a cubic grid by using a kernel-weighted binning routine (as e.g. in Kitsionas et al., 2008). Based on this grid we calculate the density weighted spectra by substituting with before the Fourier transformation. is the average velocity in each of the three components. The specific turbulent kinetic energy in the Fourier space is then given as
| (2) |
where and are the Fourier transform of the substituted velocity and its complex conjugate, respectively. By mapping the cube to wave numbers , the specific energy in the compressional, curl-free modes can be calculated as
| (3) |
The specific energy in the solenoidal or incompressible, divergence-free modes is then given by . We construct the spectra by collecting the energy in the different wavenumber intervals (see Kitsionas et al., 2008, for details). The total spectra as well as the solenoidal and compressional parts are shown in Fig. 2.
The initial spectrum at kyr (Fig.2, top panel) resembles quite well a power-law, even though the large-scale (low k) modes are lower, as the initial conditions are not produced by driven but by freely decaying turbulence. The slope is similar to a Kolmogorov-law. Approximately 25% of the total turbulent energy is contained in the compressional modes.
At kyr (Fig.2, middle panel) there is already a distinct difference between the two spectra. The control run keeps the power-law shape and dissipates energy. In the ionization case the power is strongly increased on all scales. The increase is pronounced for , corresponding to scales pc. An interesting feature is the rise in the compressional modes, where now 39% of the total turbulent energy is contained, whereas in the comparison run this ratio stays at 25%. This clearly shows that the energy of the radiation is transferred into compression of the cold gas via the hot gas. The increase is in the turbulent energy itself and not correlated to the overall bulk motion in the x-direction, since the mean velocity is subtracted separately in each direction before the Fourier transform.
After kyr (Fig.2, bottom panel) these differences are even more pronounced. The kinetic energy in the cold gas is now a factor of four higher than in the run without ionization. Approximately 33% of the total turbulent energy is now contained in the compressional modes. This suggest that after an initial phase of high compression the system starts to relax.
Including the mass in the respective region and density range the total turbulent energy can be calculated. The initial turbulent energy is , the final turbulent energy (at kyr) is and in the ionized and unionized case, respectively. Thus, the input of turbulent energy per unit volume and unit time averaged over the simulation time when comparing the run with ionization to the case of freely decaying turbulence is . By using the simplified assumption that the UV-radiation is absorbed isotropically in the entire simulation volume the amount of energy contained in the ionizing radiation for the chosen flux is . Compared to the estimates of Matzner (2002) and Mac Low & Klessen (2004) our radiative energy is several orders of magnitude higher, since we look at the direct surrounding of an O-star instead of averaging over an entire galaxy. Nevertheless, the conversion efficiency of ionization into turbulent motion of the cold gas is in our case , which is an order of magnitude higher than their estimate of for the Milky Way. Our highly resolved simulations show that ionizing radiation from an O-star or association provides a much more efficient mechanism to drive and sustain turbulence in the parental molecular cloud than was previously estimated. However, this is still the energy input into the local environment in contrast to the average input rate on galactic scales derived by Mac Low & Klessen (2004). On the larger scales it does not appear to contribute as significantly as e.g. supernova explosions.
4. Discussion
We have shown in this letter that the observed pillar-like structures around O-stars as well as the gravitational collapse at the tip of the pillars can result from the impact of the ionizing radiation of massive O-stars on a turbulent molecular cloud. In addition, the turbulent energy in the cold gas is increased by a factor of four, especially in the compressional modes. Both effects are due to the same mechanism: the ionization can heat the gas along channels of low density, thereby compressing gas at higher density into filaments. Close to the source of ionization this leads to the excavation of pillar-like structures with triggered gravitational collapse at their tips. Further away from the source front, the structures have not yet fully developed, nevertheless the effect of compression is clearly visible in the turbulent energy spectra.
Even though we find striking similarities between our simulations and observations, one has to bear in mind that this is a simplified approach which does not involve full radiative transfer. Ionized gas which gets shaded is assumed to cool immediately without affecting the adjacent structures. In addition, the shaded gas does not get ionized and heated by the recombination radiation of the ionized gas surrounding it. This might influence the precise shape of the structure behind the tip. Moreover, the thin surface layers around each pillar where cold and hot gas are mixing cannot be resolved, although they might be crucial for the precise understanding of the temperature and the chemical composition of these structures. Nevertheless, our simulations indicate that these detailed effects are of minor importance to explain the global picture, i.e. the overall structure and mass assembly of the pillars observed. Stellar winds might have an additional impact. Although O-stars have very powerful winds which can reach velocities of up to km/s, our models suggest that ionizing radiation alone can reproduce most observed features.
The straightforward combination of hydrodynamics and ionizing radiation together with a standard turbulent model and typical parameters for molecular clouds leads to morphologies consistent with observed objects like pillars and collapsing cores. The similarities suggest that ionizing radiation plays a major role not only in shaping the parental cloud, but also in triggering secondary star formation. Furthermore, the overall turbulent kinetic energy in the cold gas is increased significantly.
References
- Altay et al. (2008) Altay, G., Croft, R. A. C., & Pelupessy, I. 2008, MNRAS, 386, 1931
- Bertoldi (1989) Bertoldi, F. 1989, ApJ, 346, 735
- Dale et al. (2005) Dale, J. E., Bonnell, I. A., Clarke, C. J., & Bate, M. R. 2005, MNRAS, 358, 291
- Dale et al. (2007) Dale, J. E., Clark, P. C., & Bonnell, I. A. 2007, MNRAS, 377, 535
- Elmegreen et al. (1995) Elmegreen, B. G., Kimura, T., & Tosa, M. 1995, ApJ, 451, 675
- Elmegreen & Scalo (2004) Elmegreen, B. G., & Scalo, J. 2004, ARA&A, 42, 211
- Gahm et al. (2006) Gahm, G. F., Carlqvist, P., Johansson, L. E. B., & Nikolić, S. 2006, A&A, 454, 201
- Glover & Mac Low (2007) Glover, S. C. O., & Mac Low, M.-M. 2007, ApJS, 169, 239
- Gritschneder et al. (2009) Gritschneder, M., Naab, T., Burkert, A., Walch, S., Heitsch, F., & Wetzstein, M. 2009, MNRAS, 393, 21
- Ikeda et al. (2008) Ikeda, H. et al. 2008, AJ, 135, 2323
- Iliev et al. (2006) Iliev, I. T. et al. 2006, MNRAS, 371, 1057
- Kessel-Deynet & Burkert (2003) Kessel-Deynet, O., & Burkert, A. 2003, MNRAS, 338, 545
- Kitsionas et al. (2008) Kitsionas, S. et al. 2008, ArXiv e-prints, 810, arXiv:0810.4599
- Krumholz et al. (2006) Krumholz, M. R., Matzner, C. D., & McKee, C. F. 2006, ApJ, 653, 361
- Krumholz et al. (2007) Krumholz, M. R., Stone, J. M., & Gardiner, T. A. 2007, ApJ, 671, 518
- Mac Low & Klessen (2004) Mac Low, M.-M., & Klessen, R. S. 2004, Reviews of Modern Physics, 76, 125
- Matzner (2002) Matzner, C. D. 2002, ApJ, 566, 302
- Mellema et al. (2006) Mellema, G., Arthur, S. J., Henney, W. J., Iliev, I. T., & Shapiro, P. R. 2006, ApJ, 647, 397
- Nelson et al. (2008) Nelson, A. F., Wetzstein, M., Naab, T., & . 2008, ArXiv e-prints, 802, arXiv:0802.4253
- Pawlik & Schaye (2008) Pawlik, A. H., & Schaye, J. 2008, MNRAS, 389, 651
- Scalo et al. (1998) Scalo, J., Vazquez-Semadeni, E., Chappell, D., & Passot, T. 1998, ApJ, 504, 835
- Shu (1991) Shu, F. 1991, Physics of Astrophysics, Vol. II: Gas Dynamics (Published by University Science Books, 648 Broadway, Suite 902, New York, NY 10012, 1991.)
- Snider et al. (2007) Snider, K. D., Hester, J. J., Desch, S. J., Healy, K. R., & Bally, J. 2007, ArXiv e-prints, 711, arXiv:0711.1515
- Springel et al. (2001) Springel, V., Yoshida, N., & White, S. D. M. 2001, New Astronomy, 6, 79
- Strömgren (1939) Strömgren, B. 1939, ApJ, 89, 526
- Sugitani et al. (2002) Sugitani, K. et al. 2002, ApJ, 565, L25
- Ward-Thompson et al. (2006) Ward-Thompson, D., Nutter, D., Bontemps, S., Whitworth, A., & Attwood, R. 2006, MNRAS, 369, 1201
- Wetzstein et al. (2008) Wetzstein, M., Nelson, A. F., Naab, T., & Burkert, A. 2008, ArXiv e-prints, 802, arXiv:0802.4245