11email: sing@iap.fr 22institutetext: Carnegie Institution of Washington, Dept. of Terrestrial Magnetism, 5241 Broad Branch Road NW, Washington, DC 20015, USA
22email: mercedes@dtm.ciw.edu
Ground-based secondary eclipse detection of the very-hot Jupiter OGLE-TR-56b††thanks: Based on data collected with the 6.5 meter Magellan Telescopes located at Las Campanas Observatory and the FORS2 imager at the VLT-Antu telescope in Paranal Observatory, ESO, Chile (program 081.C-0266).
We report on the detection of the secondary eclipse of the very-hot Jupiter OGLE-TR-56b from combined -band time series photometry obtained with the VLT and Magellan telescopes. We measure a flux decrement of 0.03630.0091% from the combined Magellan and VLT datasets, which indicates a blackbody brightness temperature of K, a very low albedo, and a small incident radiation redistribution factor, indicating a lack of strong winds in the planet’s atmosphere. The measured secondary depth is consistent with thermal emission, but our precision is not sufficient to distinguish between a black-body emitting planet, or emission as predicted by models with strong optical absorbers such as TiO/VO. This is the first time that thermal emission from an extrasolar planet is detected at optical wavelengths and with ground-based telescopes.
Key Words.:
binaries:eclipsing – planetary systems – stars:individual (OGLE-TR-56) – techniques: photometric1 Introduction
Very hot Jupiters (VHJs) are giant planets orbiting very close to their host star, typically with periods of less than 2–3 days. Their proximity to the stars makes those planets potentially very hot, and it is therefore expected that they will emit detectable amounts of thermal radiation both at optical and near-infrared wavelengths (López-Morales & Seager 2007; Fortney et al. 2008).
Since the first detection of thermal emission from hot-Jupiters (Deming et al. 2005), all detections have been made from space using the Spitzer telescope at wavelengths longer than 3.6 m, despite numerous ground-based attempts (e.g. Knutson et al. 2007; Deming et al. 2007; Snellen & Covino 2007; Snellen 2005). Anti-transit exoplanet atmospheric detections from the ground so far have been elusive, in contrast to the recent ground-based primary transit result by Redfield et al. (2008). This is unfortunate, as ground-based anti-transit detections can greatly facilitate hot Jupiter atmospheric studies, and extend this field to the optical and near-infrared regions of the spectrum.
López-Morales & Seager (2007) predicted the detectability of thermal emission of OGLE-TR-56b in -band (0.9 m). The authors found that if the planet had a bolometric albedo = 0 and a negligible atmospheric energy redistribution factor, the decrement in flux during secondary eclipse could be as large as 0.05 of the total light of the system. Of the hot Jupiter planets known at that time, OGLE-TR-56b was the best suited candidate for detection.
Here we present the results of the follow-up observations to test that prediction. §2 describes our observations and the data reduction and analysis are presented in §3. In §4 we summarize and discuss our results.
2 Observations
OGLE-TR-56b is a faint target (V=16.56) located in a very crowded field. These factors, combined with the small expected signal of the secondary eclipse, make a detection challenging. Stable photometric conditions and large aperture telescopes, which minimize stellar blends and also provide high resolution time sampling of the target’s light curves, are therefore necessary.
We first monitored three secondary eclipse events of OGLE-TR-56b on June 25th, 30th and July 2nd, 2008 UT using the FORS2 instrument at the VLT-Antu telescope located at Paranal Observatory in Chile. FORS2 has a mosaic of two 2k4k E2V CCDs with 1515 m pixels. We used the direct imaging mode of the instrument with a Gunn-z filter, a high resolution collimator and 22 binning, to obtain images with 0.125”/pixel and a field of view (FoV) of 4.2’4.2’ around the target.
Only the night of July 2nd produced high enough quality data to detect the secondary transit of OGLE-TR-56b. On that night we benefited from both stable and good conditions, with an average seeing of 0.72” varying by 0.2” during the run. The observations were taken between the Julian dates of 2454649.67536 and 2454649.88428, yielding 354 images with exposure times between 10 and 30 seconds and 26 second readout times. Exposure times were adjusted during the night to keep the counts in the central pixel of the target PSF around half-well depth. The pointing was stable, with the target centered to within 0.5 pixel in the CCD’s x-direction and 0.25 in the y-direction throughout the night.
The observations on June 25th suffer from poor and highly variable seeing conditions, with seeing 1.3” during the night, and could not be used for this analysis. The night of July 30th had good seeing, between 0.6” and 0.22”, but the sky conditions changed both rapidly and dramatically during the in-eclipse phases, while remaining stable out-of-eclipse. This affects the performance of our de-trending algorithms (see §3), which use the systematics found in the out-of-eclipse portions of the light curve to correct the data in-eclipse. The in- and out-of eclipse systematics proved to be very different and impossible to remove.
We monitored another secondary eclipse event of OGLE-TR-56b on August 3rd, 2008 UT with the new MagIC-E2V instrument on the Magellan-Baade telescope located at Las Campanas Observatory in Chile. The MagIC-E2V is a two-amplifier CCD with 10241024, 1313 m pixels, producing a FoV of 38”38” and a resolution of 0.037” per pixel in the 11 binning configuration. All the exposures were taken with a SDSS filter. The observations span the Julian dates of 2454682.48142 to 2454682.69383 containing 253 images with 60 second integration times and 5 second readout times. The sky conditions were stable and good, with an average seeing of 0.9” which only varied by 0.1” during the run.
3 Reduction and analysis
Several stars, including the target, appear well isolated both in the VLT and Magellan frames. This renders our analysis by aperture photometry precise enough for this study.
After correcting for bias and flat-fielding all images using standard IRAF routines, we started the data analysis by performing DAOPHOT-type aperture photometry, recording the flux from all bright non-saturated stars in the FoV for a large and well sampled range of apertures. In the Magellan data, the sky background was estimated using annuli centered around the apertures, and with a large and well sampled range of inner and outer ring radii. In the VLT data, we estimated the sky background using an iterative clipping method in the central third of the image, which contains the target and reference stars, in a manner similar to the calculation of sky background in DAOPHOT.
The best comparison stars were selected separately in the Magellan and VLT datasets by identifying the most stable (i.e. minimum standard deviation) differential light curves between each star and OGLE-TR-56. The individual preliminary light curves of both OGLE-TR-56 and the selected comparisons presented clear systematic trends, with the VLT dataset more highly affected. These trends can be attributed to atmospheric effects, such as seeing, sky-background brightness and airmass variations, or instrumental effects such as small changes of the location of the stars in the detector. Those effects can be modeled and reduced using de-trending algorithms commonly used in transit light curve analyses.
A standard procedure in transit light curve analysis is to model systematics using only portions of each star’s light curve at phases out-of-transit and then to apply the model to the in-transit data, to prevent removing the transit signal itself. For data-sets with a large number of light curves, systematic errors can be corrected by algorithms like SysRem (Tamuz et al. 2005), which measures trends common to many stars of the sample, removing each trend with a pass through the algorithm.
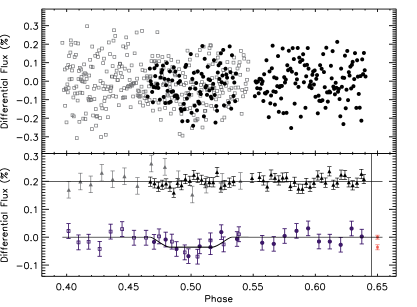
Our field is in a very crowded region toward the Galactic center, limiting the number of useful unblended reference stars and the performance of iterative algorithms. Therefore, we de-trend the light curves in two steps. First we modeled and removed a single initial linear trend common to the target and reference stars using an implementation of the SysRem algorithm (Tamuz et al. 2005), which seeks to minimize the expression , where is the average-subtracted stellar magnitude for the th star of the th image, is the uncertainty of , is an epoch-dependent parameter, and is a stellar dependent parameter. After this first pass, the VLT data has a per-point scatter of 0.13%, down from 0.27%. Any remaining trends in the target are further reduced by performing a multiple linear regression fit with position in the detector, FHWM of the stars and airmass. This second detrending pass further reduces the scatter of the VLT light curve to 0.116%, close to the Poisson limit of 0.10%. For the Magellan data, the initial per-point scatter of the light curve was 0.16% and a final scatter of 0.098% was achieved after de-trending, close to the Poisson limit of 0.08%. The optimal VLT and Magellan apertures, and the sky background annulus for the Magellan data, were determined for the target and reference stars which minimized the standard deviation of the light curve when using the apertures in the above de-trending procedures. The final light curves are shown in Figure 1.
3.1 Eclipse detection and error estimation
The VLT and Magellan datasets combined contain 596 points between phases 0.3965 and 0.6403, based on the transit ephemerides equation of Torres et al. (2008). Given the photometric precisions per data point of 0.116 for the VLT data and 0.098 for the Magellan data, the 0.05 maximum expected depth of the thermal emission signature of OGLE-TR-56b during secondary eclipse is at least a factor of two shallower than the errors of the individual points. Therefore, the eclipse is difficult to discern by eye in the unbinned data (see Fig. 1) and further tests are necessary to confirm its presence.
First, we used the known orbital period and stellar and planetary radii from Torres et al. (2008) to fit transit models (Mandel & Agol 2002) with no limb darkening to the data from each night. The best fits were found using a Levenberg-Marquardt least-square algorithm, with the central phase of the transit set to 0.5, consistent with a circular orbit (Bouchy et al. 2005), and leaving the depth and the flux out of transit as free parameters. The results are a transit depth of 0.0370.016 with a reduced of 0.903 for VLT and 0.0360.011 with a reduced of 0.926 for Magellan. The total errors in the eclipse depth are estimated as where is the scatter per-point out-of-transit and describes the red noise (Pont et al. 2006), estimated with the “prayer-bead” method (see Gillon et al. 2007; Southworth 2008), to be 1.1 in the VLT data and 4 in the Magellan data.

We finally investigated to what extent uncertainties in the system’s parameters affect our eclipse depth measurements. Varying the impact parameter, inclination, planet-to-star radius ratio, and system scale from Torres et al. (2008) by 1, the measured eclipse depth in the Magellan data changed by only 2.4 or 0.22 . Thus, our result is largely independent of the system parameters
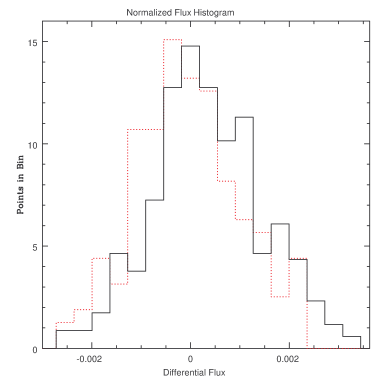
Three other tests were performed to confirm the detection. Taking the average of the 365 light curve data points at out-of-transit phases versus 174 points in-transit (only points near the bottom of the transit), we measure a depth of 0.0363 0.0091, which corresponds to a 3-4 detection including red-noise. We further checked the detection in a manner similar to the reported detection of HD209458 at 24m by Deming et al. (2005). Figure 2 shows the first of those tests, i.e. histograms of the distribution of normalized flux for both the in-transit and out-of-transit phase intervals. The distribution of in-occultation points is shifted by 0.0363 of the flux, as expected from the presence of the occultation. The results of the second test are shown in Figure 3. Letting the central phase and depth of the model transit vary, we confirm the depth and find the center of the occultation to be at phase , consistent with a near-circular orbit.
4 Discussion
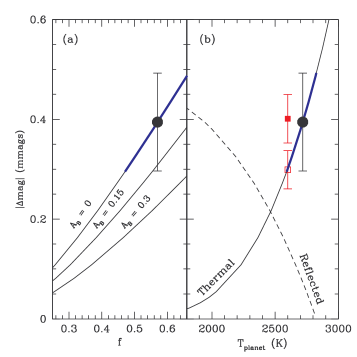
A decrease in flux of 0.03630.0091 corresponds to a contribution from the planet to the total z’-band brightness of the system of 0.3940.098 milli-magnitudes. The light detected could be stellar light reflected by the surface of the planet, but planetary thermal emission is the best explanation. Theoretical work on Very-Hot Jupiter atmospheres (Marley et al. 1999; Seager et al. 2000; Sudarsky et al. 2000) predict that these planets can reflect at most 30 of the stellar incident light (i.e. = 0.3), if their atmospheres are covered by homogeneous pure silicate clouds at altitudes of one millibar or higher. will be less than 0.3 if the planets are cloud free or have patchy silicate or iron clouds so stellar radiation penetrates through the clouds and is absorbed by gaseous molecules (Hood et al. 2008). Reflected light could make OGLE-TR-56b appear bright enough to be detected in the z’-band, but this requires 0.3, and Very-Hot Jupiter atmospheres are too hot on the substellar side for silicate or iron clouds to form, implying low albedos. The measured radiation most likely comes from thermal emission and the effective temperature of the planet has to be high. We estimate a brightness temperature of = K, based on the eclipse depth error bars, and assuming the planet emits thermally as a black-body (see Figure 4b). and are also values consistent with the eclipse depth (See Figure 4a). This indicates that the stellar radiation is absorbed by the planet and not efficiently distributed throughout its atmosphere via winds, but instead is almost instantaneously re-radiated back to space (López-Morales & Seager 2007). The blackbody of the planet would be 226019 K if the incident stellar radiation were completely redistributed and .
Recent detections of planetary occultations at infrared wavelengths ( 3–24 m) by the Spitzer space telescope have revealed properties of the atmospheric structure of hot-Jupiter exoplanets, most notably thermal inversions (Hubeny et al. 2003; Burrows et al. 2007; Harrington et al. 2007; Knutson et al. 2008; Seager et al. 2008), thought to be caused by a strong optical absorber at high altitudes (Burrows et al. 2007; Fortney et al. 2008). Hot Jupiters with thermal inversions have bright near-infrared and infrared emission lines where the planetary flux is much greater than a single temperature black-body model would predict. OGLE-TR-56b is hotter than any of the planets Spitzer has observed, and at the extreme hot and highly-irradiated end of those planets believed to have inversions. While our result in Fig. 4 reveals a depth closest to the expected value from the Hubeny et al. (2003) model with thermal inversion, more observations of the secondary transit of OGLE-TR-56b are necessary to improve our current error bars and confirm this result. Also, the contrast between models with and without thermal inversion is greater in the near-infrared, with predicted occultation depths of 1–3 mmags (Fortney et al. 2008), making detections possible with modern ground-based detectors. Detecting the secondary transit of this planet in the near-infrared will also further constrain the models.
All secondary transit measurements to date have been made with Spitzer. A ground-based detection now extends exoplanet occultation science to shorter wavelengths, more accessible telescopes, and fainter targets. This is particularly important for the near future, as Spitzer is soon to run out of cryogens, severely limiting its capabilities. The eventual loss of Spitzer will leave a long time window before the launch of the James Webb Space Telescope, when occultation measurements will rely heavily on ground-based measurements. At the same time, planet-finding missions like CoRoT and Kepler will find a wealth of new planets to study. Extending ground-based measurements to other very hot Jupiters will enable comparative exoplanetology, where the atmospheric structures of hot planets can be compared and contrasted, to continue investigation into important and relevant physical processes.
Acknowledgements.
D.K.S. is supported by CNES. MLM acknowledges support provided by NASA through Hubble Fellowship grant HF-01210.01-A awarded by the STScI, which is operated by the AURA, Inc. for NASA, under contract NAS5-26555. We wish to thank J. Elliot, P.I. of MagIC-E2V, for providing access to the instrument, S. Seager, F. Pont and A. Lecavelier for helpful comments, suggestions and discussions, and the Magellan staff and ESO staff at Paranal.References
- Bouchy et al. (2005) Bouchy, F., Pont, F., Melo, C., et al. 2005, A&A, 431, 1105
- Burrows et al. (2007) Burrows, A., Hubeny, I., Budaj, J., Knutson, H. A., & Charbonneau, D. 2007, ApJ, 668, L171
- Deming et al. (2007) Deming, D., Richardson, L. J., & Harrington, J. 2007, MNRAS, 378, 148
- Deming et al. (2005) Deming, D., Seager, S., Richardson, L. J., & Harrington, J. 2005, Nature, 434, 740
- Fortney et al. (2008) Fortney, J. J., Lodders, K., Marley, M. S., & Freedman, R. S. 2008, ApJ, 678, 1419
- Gillon et al. (2007) Gillon, M., Demory, B.-O., Barman, T., et al. 2007, A&A, 471, L51
- Harrington et al. (2007) Harrington, J., Luszcz, S., Seager, S., Deming, D., & Richardson, L. J. 2007, Nature, 447, 691
- Hood et al. (2008) Hood, B., Wood, K., Seager, S., & Collier Cameron, A. 2008, MNRAS, 389, 257
- Hubeny et al. (2003) Hubeny, I., Burrows, A., & Sudarsky, D. 2003, ApJ, 594, 1011
- Knutson et al. (2008) Knutson, H. A., Charbonneau, D., Allen, L. E., Burrows, A., & Megeath, S. T. 2008, ApJ, 673, 526
- Knutson et al. (2007) Knutson, H. A., Charbonneau, D., Deming, D., & Richardson, L. J. 2007, PASP, 119, 616
- López-Morales & Seager (2007) López-Morales, M. & Seager, S. 2007, ApJ, 667, L191
- Mandel & Agol (2002) Mandel, K. & Agol, E. 2002, ApJ, 580, L171
- Marley et al. (1999) Marley, M. S., Gelino, C., Stephens, D., Lunine, J. I., & Freedman, R. 1999, ApJ, 513, 879
- Pont et al. (2006) Pont, F., Zucker, S., & Queloz, D. 2006, MNRAS, 373, 231
- Redfield et al. (2008) Redfield, S., Endl, M., Cochran, W. D., & Koesterke, L. 2008, ApJ, 673, L87
- Seager et al. (2008) Seager, S., Deming, D., & Valenti, J. A. 2008, ArXiv.0808.1913
- Seager et al. (2000) Seager, S., Whitney, B. A., & Sasselov, D. D. 2000, ApJ, 540, 504
- Snellen (2005) Snellen, I. A. G. 2005, MNRAS, 363, 211
- Snellen & Covino (2007) Snellen, I. A. G. & Covino, E. 2007, MNRAS, 375, 307
- Southworth (2008) Southworth, J. 2008, MNRAS, 386, 1644
- Sudarsky et al. (2000) Sudarsky, D., Burrows, A., & Pinto, P. 2000, ApJ, 538, 885
- Tamuz et al. (2005) Tamuz, O., Mazeh, T., & Zucker, S. 2005, MNRAS, 356, 1466
- Torres et al. (2008) Torres, G., Winn, J. N., & Holman, M. J. 2008, ApJ, 677, 1324