Physical Chemistry Chemical Physics, volume 11, 543-555, (2009)
The phase diagram of water at high pressures as obtained by computer simulations of the TIP4P/2005 model: the appearance of a plastic crystal phase.
Abstract
In this work the high pressure region of the phase diagram of water has been studied by computer simulation by using the TIP4P/2005 model of water. Free energy calculations were performed for ices VII and VIII and for the fluid phase to determine the melting curve of these ices. In addition molecular dynamics simulations were performed at high temperatures (440K) observing the spontaneous freezing of the liquid into a solid phase at pressures of about 80000 bar. The analysis of the structure obtained lead to the conclusion that a plastic crystal phase was formed. In the plastic crystal phase the oxygen atoms were arranged forming a body center cubic structure, as in ice VII, but the water molecules were able to rotate almost freely. Free energy calculations were performed for this new phase, and it was found that for TIP4P/2005 this plastic crystal phase is thermodynamically stable with respect to ices VII and VIII for temperatures higher than about 400K, although the precise value depends on the pressure. By using Gibbs Duhem simulations, all coexistence lines were determined, and the phase diagram of the TIP4P/2005 model was obtained, including ices VIII and VII and the new plastic crystal phase. The TIP4P/2005 model is able to describe qualitatively the phase diagram of water. It would be of interest to study if such a plastic crystal phase does indeed exist for real water. The nearly spherical shape of water makes possible the formation of a plastic crystal phase at high temperatures. The formation of a plastic crystal phase at high temperatures (with a bcc arrangements of oxygen atoms) is fast from a kinetic point of view occurring in about 2ns. This is in contrast to the nucleation of ice Ih which requires simulations of the order of hundreds of ns.
I INTRODUCTION
The study of the phase diagram of water started its way with the pioneering work of Tammanntammann ; tammann1910 and Bridgmanbridgman12 ; bridgman35 ; bridgman37 , who obtained a number of different solid phases for water. The story has not ended yet since in the last decade new solid phases have been discovered, as it is the case of ice XIIN_1998_391_00268 , discovered in 1998 by Lobban, Finney and Kuhs and ices XIII and XIV discovered just two years ago by Salzmann et al.iceXIII . In addition to the existence of new phases, water presents a number of interesting questions, as the possibility of a liquid-liquid transitionN_1992_360_00324_nolotengo ; mishima98 , the relation between the different amorphous phasesdebenedetti03 , the possibility of partial proton orderingJCP_2000_112_07169 and the aspect of the phase diagram at high temperatures and pressures. Water is an important molecule since its liquid phase constitutes the ”matrix of life” ball01 ; franksbook . Getting a molecular understanding of the behaviour of waterfinneyreview appears as an interesting and challenging goal. For this reason thousands of computer simulation studies have been reported since the pioneering work of Barker and Wattsbarker69 and Rahman and Stillingerrahman71 . Most of the studies have focused on the liquid phase. The study of the solid phases have received less attention. Morse and Ricemorse82 analyzed the performance of early water models to describe the different solid phases of water. In the recent years we have analysed the performance of several popular models (SPC/Eberendsen87 and TIP4Pjorgensen83 ) to describe the solid phases of water and its phase diagramsanz1 ; vegafilosofico ; vegautrecht ; mcbride1 . It was realized that TIP4P could be modified slightly to yield an overall better description of the water phase diagram. In this way we proposed two new models TIP4P/2005abascal05b and TIP4P/Iceabascal05a , the first describing correctly the maximum in density of water and the second reproducing the melting point temperature of ice Ih. After analysing the behaviour of these two models for other properties (diffusion coefficients, surface tension, vapour-liquid equilibria) it has been concluded that TIP4P/2005 provides a quite reasonable description of the properties of water. In fact it reproduces reasonably well the densities and relative energies of the water polymorphsaragones1 ; noya_jpc_2007 ; maria1 , the vapour-liquid equilibriavega06 , the diffusion coefficientabascal05b , the surface tensionvega07a and the structure of the liquid and solid phase (as given by the radial distribution functions). In the original paper where TIP4P/2005 was proposed it was shown that it provides a reasonable description of the phase diagram of waterabascal05b at low and moderate pressures where the polymorphs Ih, II, III, V and VI are thermodynamically stable. However, the high pressure and high temperature region was not considered. One of the goals of this paper is to determine the high temperature and the high pressure part of the phase diagram including the high pressure polymorphs, namely ices VII and VIII.
Another issue which motivated this research was the possibility of obtaining by computer simulation the nucleation of ice from liquid water. In principle, by cooling water at room pressure in a computer simulation, there is the possibility of nucleating ice Ih (or Ic). Svishchev and Kusaliksvishchev94 were able to nucleate ice from liquid water by using an external field. Attempts to obtain ice from water without external fields were unsuccessful until the seminal work of Matsumoto, Saito and Ohmine matsumoto02 , who in 2002 observed by the first time the nucleation of ice from liquid water after very long runs (hundreds of ns). After these first attempts several other authors have been able to nucleate ice from water. Vrbka and Jungwirthsubsurface nucleated ice from water in a very long run using a slab of liquid in contact with its vapour. Quigley and Rodger quigley_rodger nucleated ice by introducing bias in the simulations (via the metadynamics techniquemetadynamics ). However, it is fair to say that nucleating ice Ih (or Ic) from liquid water in a computer simulation is rather difficult, and this can be achieved only either performing very long runs or introducing bias within the simulations. However, in a very recent experimental study following previous workdolan_JCP1232005 , Dolan et al.dolan_nature_physics_2007 showed that the formation of ice VII, from water occurs in a few nanoseconds when the temperature was around 400K. In their work, Dolan et al.dolan_nature_physics_2007 suggested that such low nucleation time could be studied by computer simulation. We intend to address this issue in this paper.
In the present work we shall determine by using free energy calculations the high pressure region of the phase diagram of the TIP4P/2005 model. On the other hand we shall use this model to analyse if the nucleation of ice VII from the liquid does indeed occur in a few ns. As it will be shown the answer is positive, and besides, as a surprise a new solid phase is found for water. This new solid phase is a plastic crystal phase. It will be shown that for TIP4P/2005 this plastic crystal phase is thermodynamically stable with respect to ices VII and VIII in the region of high pressures and temperatures. The plastic crystal has also been found two months ago by Takii, Koga and Tanaka takii_koga_tanaka for the TIP5P and TIP4P models of water. It would be of interest to determine if this plastic crystal phase does indeed exist for real water, especially taken into account that the interest in the high pressure phases of water is growinghemley_nature1987 ; hemley_JCP1282008 . If so, that would be, ice XV (the precise value of the roman numeral depends on the order ices are found experimentally).
II Simulation details
In this work Monte Carlo simulations have been performed for ices VIII, VII and liquid water. The TIP4P/2005 model will be used. This a rigid non-polarisable model, with a distribution of charges, similar to that of the TIP4P model. A Lennard-Jones (LJ) site is located on the oxygen atom, positive charges are located on the hydrogen atoms, and the negative charge is located in the H-O-H bisector. The parameters of the model are given in Table I. The TIP4P/2005 model improves the description of water properties significantly with respect to the original TIP4P modelvega_faraday and is becoming popular in computer simulations of waternezbeda08 ; hugh08 ; franceses08 ; bartok_baranyai . A critical comparison of the performance of the model with respect to other water models has been presented recentlyfaraday .
Ice VIII is formed by two sub-lattices, which are interpenetrated but not interconnectedpetrenko99 ; eisenberg69 . In one of the sublattices all dipole moments of the water molecules are aligned along the negative direction of the vector c of the unit cell, whereas in the other sublattice all dipole moments are aligned along the positive direction of the c vector of the unit cell. Thus the net dipole moment of ice VIII is zero. Protons are ordered in ice VIII. Thus an initial configuration of ice VIII can be obtained easily from the neutron diffraction experimental dataJCP_1984_81_03612 (adjusting slightly the bond length and angles from the experimental values to those of the TIP4P/2005 model). Ice VII is formed by two ice Ic sublattices which are interpenetrated but not interconnected. Ice VII is a proton disordered phasekamb_ice_VII ; whalley_ice_VII ; eisenberg69 . The initial configuration of ice VII was obtained by generating first an ice Ic lattice, with no net dipole moment and satisfying the Bernal Fowler rulesbernal33 ; pauling35 . The algorithm of Buch et al.buch98 was used to obtain such a proton disordered configuration. A second ice Ic lattice was obtained in the same way. After these two independent ice Ic configurations were obtained, we generated the initial configuration of ice VII but putting together the two ice Ic sublattices, so that they are interpenetrated but not interconnected. Thus, the density of ice VII is of about twice the density of ice Ic.
The number of molecules used in the simulations were 600 (ice VIII), 432 (ice VII), 360 (ice VI) and for water we used either 432 or 360. In all cases the LJ potential was truncated at Å. Standard long range corrections to the LJ part of the potential were added (i.e., 1 beyond the cutoff)allen_book . Note that this simple prescription (i.e. assuming 1 beyond the cutoff) might introduce an error in the estimate of the long range correction, especially in solid phases (where g(r) is not one even at large distances). The impact that this might have on the coexistence points is not easy to assess, as the effect is different for different phases and at different densities. By analyzing the internal energy of solid phases for different systems sizes we conclude that the use of the simple prescription 1 to estimate the long range correction of the LJ part of the potential may introduce an error of about 1.5% in the determination of coexistence points ,which is enough for the purposes of this work. The importance of an adequate treatment of the long range coulombic forces when dealing with water simulations has been pointed out in recent studies.JCP_1998_108_10220 ; lisal02 ; rick04JCP_2004_120_06085 In this work, the Ewald summation techniquefrenkelbook has been employed for the calculation of the long range electrostatic forces. Isotropic NpT simulations were used for the liquid phase and for ice VII (which is of cubic symmetry) while anisotropic Monte Carlo simulations (Parrinello-Rahman like) JAP_1981_52_007182 ; yashonath85 were used for ices VIII and VI (both tetragonal). A typical Monte Carlo run involves about 30000 cycles of equilibration and 70000 cycles to obtain averages (defining a cycle as a trial move per particle plus a trial volume change).
The free energy was computed at a certain thermodynamic state for the ices VIII, VII and for liquid water. Once obtained at a certain thermodynamic state the free energy can be computed for any other thermodynamic conditions by using thermodynamic integration. Initial coexistence points were located by imposing the condition of equal chemical potential, temperature and pressure between coexistence phases. In particular we located coexistence points between several phases along the 70000 bar isobar, and along the 400K isotherm. The free energy of the liquid is calculated by computing the free energy change along a reversible path in which the water molecules are transformed into Lennard-Jones spheres by switching off the charges. The free energy of the reference Lennard-Jones fluid is taken from the work of Johnson et al. MP_1993_78_0591_photocopy . The free energy of ices VIII and VII was obtained by using the Einstein crystal methodfrenkel84 , or its slightly variant recently proposed by us denoted as the Einstein molecule methodvega_noya . In the case of ice VII, and due to the proton disorder, one must add at the end of the calculation the entropy contribution due to the degeneracy of the structure. Thus was estimated by Paulingpauling35 to be of about . Further details about the free energy calculations, both for the liquid phase, and for the solid phases of water can be found in our recent review paper about free energy calculations vega_review .
Once an initial coexistence point has been determined the rest of the coexistence curve can be obtained by using Gibbs Duhem simulationskofke93 ; ACP_1998_105_0405__coll_nolotengo . Gibbs Duhem simulations, first proposed by Kofke, allow to determine the coexistence line between two phases, provided that an initial coexistence point is known. Gibbs Duhem is just a numerical integration (using simulation results to estimate the volume and enthalpy change between phases) of the Clapeyron equation. For the integration of the Clapeyron equation a fourth-order Runge-Kutta method algorithm is employed. Anisotropic scaling (Rahman Parrinello like) was used to simulate ices VIII and VI (both are tetragonal) and isotropic NpT simulations are used for the liquid and for the solid phases of cubic symmetry (ice VII and the plastic crystal solid). Rest of the details (size of the system, cutoff) were identical to that used in the NpT simulations.
In this work we have also performed Molecular Dynamic simulations to study the formation of solid phases from liquid water at high temperatures. The choice of Molecular Dynamics (instead of Monte Carlo) allows to determine the time required by the liquid to freeze so that a comparison with experiment is possible. The molecular dynamic simulations were performed with the program Gromacsgromacs33 . In the simulations the temperature is fixed with a Nose-Hoover thermostatnose84 ; hoover85 with a relaxation time of 2 ps. To keep the pressure constant, an isotropic Parrinello-Rahman barostatparrinello81 ; nose83 was used. The relaxation time of the barostat was 2 ps. The time step used in the simulations was 1 fs. The typical length of the simulations was about 5 ns (five million time steps). The geometry of the water molecule is enforced using constraints. The LJ part of the potential was truncated at 8.5 Å and standard long range corrections were added. The real part of the coulombic potential was truncated at 8.5 Å. The Fourier part of the Ewald sums was evaluated by using the Particle Mesh Ewald (PME) method of Essmann et al.essmann95 The width of the mesh was 1 Å and we used a fourth other polynomial. As it can be seen the conditions of the Molecular Dynamic simulations were quite similar to those used in the Monte Carlo simulations.
III Results
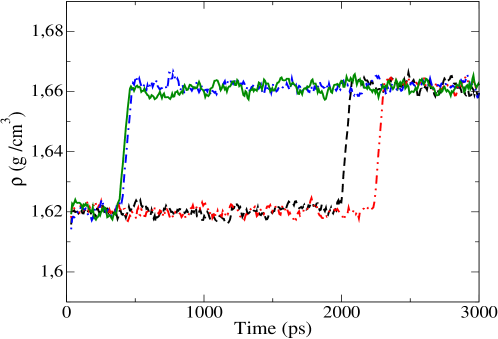
Let us start by presenting the results of Molecular Dynamics for the 440K isotherm. This temperature is close to temperature where fast nucleation of ice was observed experimentallydolan_nature_physics_2007 . We used 432 molecules in these molecular dynamic simulations. The choice of this number of molecules was motivated by the fact that we were expecting the formation of ice VII at high pressures. This number of molecules (432) would correspond to 216 unit cells (6x6x6) of ice VII. We started our simulations at low pressures (i.e about 10000 bar) where the system is in the liquid phase, and increased the pressure in consecutive runs. The final configuration of a run was used as the initial configuration of the next run. When the pressure was of 80000 bar we observed the spontaneous formation of a solid phase within a few ns. We repeated the runs several times (using different initial configurations) and the formation of the solid phase in less than 5ns was observed in almost all the cases. Thus the nucleation of a solid phase under these thermodynamic conditions can be reproduced easily. In Fig. 1 the evolution of the density with time at 440K and 80000 bar is plotted for several independent runs (we performed five independent runs). The nucleation of ice is a stochastic event so that each run freezes in a somewhat different time. However, it is clear that the formation of a solid phase occurs in about 1.5ns for the TIP4P/2005 model in this thermodynamic state (although for one of the five runs performed no freezing was observed after 5ns). Since the package Gromacs allows to visualise the trajectories, it was simple to identify the structure of the solid. The oxygen atoms of the water molecules formed a body centred cubic structure. The surprise was that the molecules of water were rotating rather wildly in the solid phase. Thus the system jumped from the liquid phase into a plastic crystal phase. Notice that ices VIII and VII are not plastic crystal phases, so that the phase obtained spontaneously is a new type of solid. For small system sizes (N=128 and N=432) and NpT simulations the crystal formed tends to be commensurate with the simulation box. However, for larger system sizes or NVT simulations we found more often that the crystal grows in some direction that was not compatible with the simulation box, so that complete crystallisation could not be achieved. In summary, we have observed that the TIP4P/2005 model freezes spontaneously in about 1.5ns (in average) into a plastic crystal phase at 440K. The formation of a plastic crystal, by heating ice VII at constant pressure has also been reported two months ago by Takii, Koga and Tanakatakii_koga_tanaka for the TIP5P and TIP4P models. The plastic crystal phase obtained in this work from the liquid is identical to that described by Takii, Koga and Tanaka takii_koga_tanaka . Sometimes when cooling/compressing liquids, the obtained solid phase is not the most stable from a thermodynamic point of view, but the more favourable from a kinetic point of view. Thus the thermodynamic stability of the plastic crystal phase with respect to ices VIII and VII should be determined.
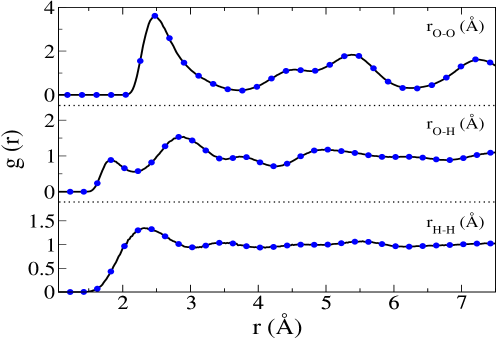
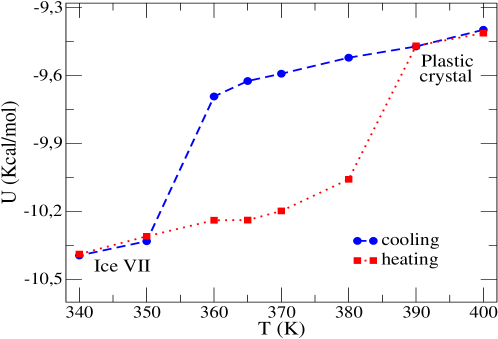
After observing the formation of the plastic crystal phase we analysed in detail the mechanical stability of ices VII and VIII when heated along the 70000 bar isobar. Starting at low temperatures, the temperature was increased (in jumps of 10-20K). For each temperature the length of the run was of about 100000 cycles. The final configuration of each simulation was taken as the initial configuration of the next run. For ice VII we observed a jump in the internal energy and density starting at a temperature of about 380K and ending at a temperature of about 390K. Visualisation of several snapshots revealed that the phase obtained at 390K was a plastic crystal phase. The density, radial distribution functions and internal energy were identical to those of the plastic crystal phase obtained from the freezing of the liquid (when compared at the same thermodynamic conditions). This is illustrated for the radial distribution functions in Fig. 2. After a long equilibration at 400K and 70000 bar of the plastic crystal phase obtained by heating ice VII, we proceed to cool the system along the isobar to see if the system was able to return to the original state. The plastic crystal phase was mechanically stable up to 360K, and at a temperature of about 350K, the density and internal energy undergo a jump. The result of this heating-cooling cycle is plotted in Fig. 3. The presence of a hysteresis loop indicates clearly the existence of a first order phase transition between ice VII and the plastic crystal phase. In fact the phase obtained by cooling the plastic crystal phase is ice VII. In Fig. 4 the radial distribution functions (O-O, H-H and O-H) of ice VII and of the phase obtained by cooling the plastic crystal phase are shown. As it can be seen they are nearly identical (and the same is true for other thermodynamic properties as density and internal energy) providing further evidence of the fact that the solid phase obtained by cooling the plastic crystal is ice VII. By analyzing the average positions of the water molecules in the phase obtained from the cooling of the plastic crystal phase, we found that the solid was formed by two sublattices which are interpenetrated but not interconnected as in ice VII. In each of the sublattices each molecule was forming four hydrogen bonds (in two acting as donor and in two acting as acceptor). Therefore, the phase obtained by cooling the plastic crystal phase was indeed ice VII. We have repeated this heating-cooling cycle for the ice VII-plastic crystal transition at several pressures (70000 bar, 65000 bar and 60000 bar). In Table II the temperatures at which the ice VII to plastic crystal and plastic crystal to ice VII transitions occur are presented. From the results of Table 2 it is obvious that the ice VII to plastic crystal thermodynamic phase transition (where the chemical potential of both phases become identical) must be between 350K and 390K when the pressure is of 70000 bar, between 340K and 380K when the pressure is 65000 bar and between 310K and 360K when the pressure is of 60000 bar. Obviously only free energy calculations can determine the precise location of the coexistence point, which must be located between the two temperatures which bracket the hysteresis loop.
We also analysed the mechanical stability of ice VIII when heated along these three isobar. It was found that ice VIII was mechanically stable up to 390K for the p=70000bar isobar, up to 390K for the p=65000bar isobar and up to 380K for the p=60000bar isobar. At higher temperatures ice VIII also becomes a plastic crystal phase. Thus ice VIII becomes mechanically unstable (transforming into a plastic crystal phase) at temperatures similar to those found for ice VII. The mechanical stability limit of ice VIII (where it transforms into a plastic crystal phase) seems to be about 10K higher than that of ice VII. We did not observe any spontaneous transformation of ice VIII into ice VII when heated . This is not to say that this transition does not exist from a thermodynamic point of view (in fact it will be shown later that this transition indeed exists) but rather that the system is not able to overcome the free energy nucleation barrier separating ice VIII from ice VII within the length of our simulations. In any case for pressures below 70000 bar it is not possible to have neither ice VIII nor ice VII as mechanically stable phases for temperatures above 390K. This provides further evidence that the plastic crystal phase obtained spontaneously from the liquid at 440K must indeed be thermodynamically stable at least at high temperatures. In any case, the definite proof of that will be provided by the free energy calculations. In Fig. 4 the radial distribution functions of ice VIII are compared to those of ice VII at 300K and 70000 bar. They are clearly different showing that both solids are mechanically stable (and clearly distinguishable) under these thermodynamic conditions.
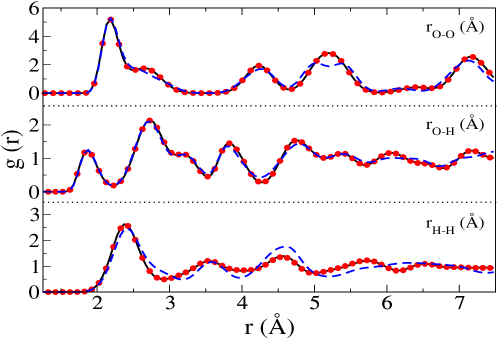
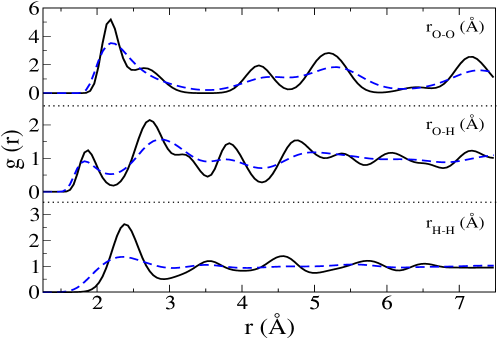
Let us now present the structural properties for the plastic crystal phase. In Fig. 5, the radial distribution functions for the plastic crystal phase at 400K and 70000 bar are compared to those of ice VII at 300K and 70000bar for the O-O, O-H and H-H correlation functions. As it can be seen from the oxygen-oxygen correlation function, the peaks of the O-O distribution in the plastic crystal phase correspond to those of ice VII, although the higher temperature and lower density of the plastic crystal solid provokes peaks with a more diffuse character. Changes in the distribution function are significant, but the most important change occurs in the correlation function. It has a liquid like aspect in the plastic crystal solid whereas its long range order is clearly visible in ice VII. Thus the distribution function is quite useful to identify the existence of a plastic crystal phase.
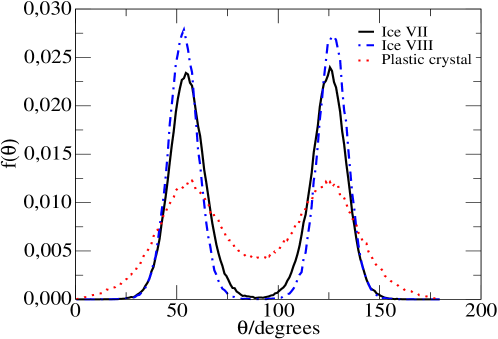
We have also determined the probability distribution of the polar angles ( and of the OH bonds). The x axis is located on the a vector of the unit cell, the y axis is located on the b vector of the unit cell, and the z axis is located along the c vector of the unit cell. The distribution function is defined as :
| (1) |
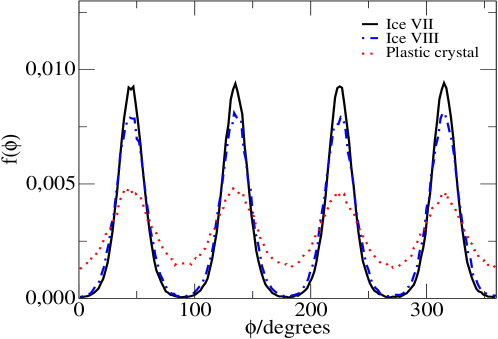
where denotes the number of bonds with polar angle between and and 2N is the number of OH bonds (i.e twice the number of molecules N). The distribution function is defined as :
| (2) |
In Fig. 6 the functions and are presented for ices VIII and VII at 300K and 70000bar. As it can be seen the peaks of are located at and where 54.74 is the angle in ice VII between one of the diagonals of the cube and a line connecting the center of two opposite faces. The four peaks in are separated by 90 degrees as it should be. In Fig. 6 the functions and are also presented for the plastic crystal phase at 400K and 70000bar. As it can be seen both distributions present less structure than the one of ices VII and VIII. It is also clear that even in the plastic crystal phase the OH vectors prefer to point out to the contiguous oxygens atoms. Therefore the angular distribution is not uniform even in the plastic crystal phase (i.e the OH vector does not distribute uniformly on the surface of a sphere). The molecules, although able to rotate prefer to point out the OH vectors to any of the 8 O atoms forming the first coordination layer. However, we checked that as the temperature increases the and distributions become somewhat more uniform. In summary the molecules rotate almost freely in the plastic crystal phase, but the OH vectors prefer to point out to the contiguous oxygen atoms. An additional interesting comment is that for ices VIII and VII at 300K and 70000 bar and for the length of the simulations performed in this work , a certain individual molecule presents a fixed value of and (except for a little bit of thermal vibration). However for the plastic crystal phase each individual molecule jumps quite often from one of the peaks of the distribution to another peak. These flipping or jumping moves occur quite often for each molecule within the length of the simulation runs considered here (at 400K in average each flipping requires about 8000 Monte Carlo cycles). The ice VIII to ice VII transition represents the change from proton order to proton disorder within the two sub lattices of the solid, whereas the ice VII to plastic crystal phase transition represents the disappearance of the two sublattices.
Let us now change to the determination of coexistence points. We have determined the free energy for ices VIII, VII and for the plastic crystal phase (Table 3). The free energy calculation was performed for ice VIII at 300K and for a density which corresponds to that of the system at 70000 bar. The free energy of ice VII was computed at 300K and for a density which corresponds to that of 70000bar. Finally the free energy of the plastic crystal phase was computed at 400K and for a density which corresponds to that of the system at 70000 bar. Details about the free energy calculations in water solid phases have been provided elsewherevega_review . Let just mention the procedure used to compute the free energy of the plastic crystal phase as it differs from that used for the rest of solid phases of water. Firstly translational springs connecting the oxygen atoms to the lattice positions of the bcc structure were switched on (in the plastic crystal phase the oxygens form a bcc solid). After that, and while keeping the translational springs, the charges of the system were switched off ending with a system of LJ atoms connected by springs to a bcc solid structure. Free energies changes can be computed easily along this path in which the Hamiltonian of the system is changed. Notice that no phase transition occurs along the integration since the system is in a plastic crystal phase along the entire integration path. Finally the free energy difference between a LJ particle connected with translational springs to a bcc lattice, and an ideal Einstein crystal (with springs connecting to the bcc lattice but without intermolecular interactions) is computed by a perturbative approach. This integration path is inspired by a recent article by Lindberg and Wang in which the dielectric constant of ice Ih was computed by switching off the charges of the molecules while having translational springsdielectric_constant_ice . In Table III the free energies for the considered thermodynamic states are reported. Let us just mention, that the Pauling degeneracy entropy was added to the free energy of ice VII. This contribution was not added neither to ice VIII nor to the plastic crystal phase.
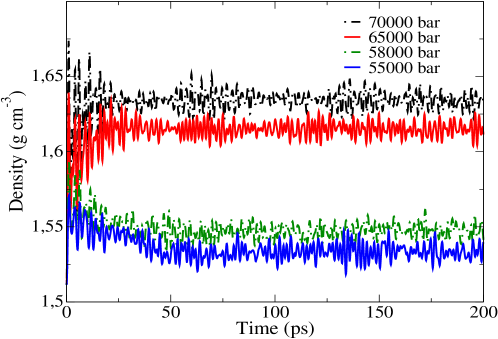
As it can be seen the Gibbs free energy of ice VII is smaller than that of ice VIII. Both phases have similar densities and internal energies and the higher stability of ice VII is mainly due to the contribution of the Pauling entropy (which is not present in ice VIII). Therefore for T=300K and p=70000bar ice VII is more stable than ice VIII. By using thermodynamic integration the ice VII to ice VIII transition at 70000 bar has been located at T=69K. In the same way the VII to plastic crystal transition has been located to occur at 377K for a pressure of 70000 bar. This value is consistent with the hysteresis loop found at 70000bar between the temperatures 350 and 390. Finally by using thermodynamic integration the fluid-plastic crystal transition was found to occur at a pressure of for the 400K isotherm. The fluid-plastic crystal transition was also determined by using direct coexistence simulations. An equilibrated configuration of the plastic crystal phase (432 molecules) was located on the left hand side of a simulation box, and put into contact with an equilibrated configuration of the fluid having 432 molecules. Molecules of the fluid phase overlapping with those of the solid phase at the fluid-solid interface were deleted. Thus the total number of molecules in the direct coexistence simulations was of 858. We then performed MD simulations using Gromacs, while keeping the temperature at 400K. Runs at different pressures were performed. At pressures below the melting point the solid phase will melt, whereas at pressures higher than the coexistence pressure the fluid phase will crystallise. The direct coexistence technique, was pioneered by Ladd and Woodcockwoodcock1 ; woodcock2 ; woodcock3 , and used recently by several authorsbroughton5 ; laird98 ; morris02 ; thompson_nitromethane_defects_and_twophases ; karim88 ; bryk02 ; ramon06 ; abascal06 ; kroes_hydrate ; wang05 ; kusalik_hydrate ; noya_hs_interface . In Fig. 7, the evolution of the density with time is shown for several pressures. As it can be seen for the low pressures (55000 and 58000 bar) the density decreases quickly indicating the melting of the plastic crystal. For high pressures (i.e 65000, 70000 bar) the density of the system increases quickly indicating the freezing of the fluid into a plastic crystal phase. Thus the value of 62000 bar obtained from free energy calculations is consistent with the results obtained from direct coexistence simulationsramon06 . Notice that in the direct coexistence simulations the melting of the plastic crystal, or the freezing of the water occurs in about 0.2ns, which is about two orders of magnitude smaller than the time required to determine accurately the melting point of ice Ih at room pressure by direct coexistence simulationsramon06 . This is probably due to two different facts. First, the temperature is high (400K instead of the temperature of about 250K used in the ice Ih-water direct interface simulations). Secondly the growth of the crystal is a somewhat more complex process for ice Ih since each water molecule must be located in a certain position and with a certain orientation to allow the ice Ih to grow. However, in the plastic crystal phase, the molecule must find the location, but the orientation is not so important since the molecules are rotating in the plastic crystal phase anyway.
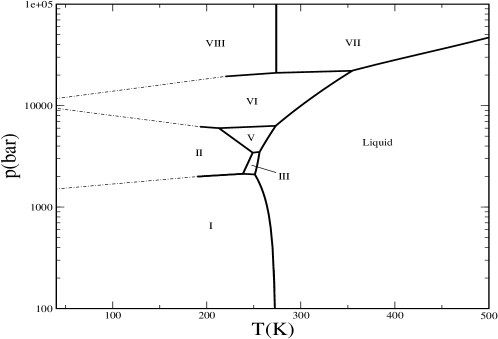
Once an initial coexistence point has been found for the VIII-VII, VII-plastic and VII-fluid transitions, the rest of the coexistence lines will be obtained by Gibbs Duhem simulations. In Fig. 8 these three coexistence lines are plotted. As it can be seen the fluid-plastic crystal and the VII-plastic crystal coexistence lines met at a triple point located around 352K and 60375 bar. This triple point can be used as initial coexistence point of the VII-fluid coexistence line. The fluid-VII coexistence line obtained from Gibbs Duhem simulations has also been plotted in Fig. 8. At 300K the Gibbs Duhem integration predicts a fluid-VII coexistence pressure of about 51000 bar, which is consistent with the coexistence pressure predicted from free energy calculations. The melting curve of ice VI intersects the melting curve of ice VII, generating a fluid-VI-VII triple point (the precise location is 301K and 50742 bar). This triple point can be used as initial point for the VI-VII coexistence curve. The VI-VII coexistence curve intersects the VIII-VII coexistence curve at about 55000 bar and 69K. This generates an VI-VII-VIII triple point which can be used to initiate the VI-VIII coexistence line. The global phase diagram of the TIP4P/2005 (including the high pressure phases) is presented in Fig. 8. The experimental phase diagram is also presented in Fig. 8. The coexistence lines are given in tabular form in Tables IV-VI. The triple points are given in Table 7.
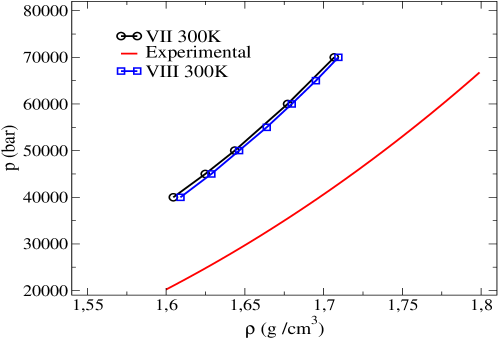
As it can be seen the TIP4P/2005 reproduces qualitatively the phase diagram of water. Ice VIII is stable only at low temperatures. The coexistence line between ice VIII and ice VII is almost a vertical line. This is due to the fact that the densities of ices VII and VIII are practically identical for a certain temperature and pressure. There is a certain regime of temperatures where ice VII coexists with the liquid phase. There are three significant qualitative differences between the phase diagram of TIP4P/2005 and the experimental one. The first is that the VIII-VII transition temperature seems to be low as compared to experiment. It seems that models with a TIP4P geometry tend to underestimate the temperature of the order-disorder transitions (between ices having the same arrangement of oxygens but differing in the proton ordering). In fact we found in previous workvegautrecht that also the XI-Ih transition was predicted to occur for the TIP4P model at a temperature lower than found experimentally. The second is the appearance of a plastic crystal phase for the TIP4P/2005 model. This plastic crystal phase has not been reported so far for real water. The third is the appearance of re-entrant melting in the melting curve of ice VI which is not found in the experimental phase diagram. The reason for the appearance of re-entrant melting in the melting curve of ices (from ice Ih up to ice VI) has been discussed previously sanz1 . The fluid-VI-VII triple point is located at 301K and 50742 bar, to be compared with the experimental value which is located at a temperature of 355 K and a pressure of about 22000 bar. Thus, it seems that to bring the phase diagram of TIP4P/2005 into closer agreement with experiment the stability of ice VII should increase. In this way the fluid-VI-VII triple point would occur at lower pressures and the re-entrant portion of the melting curve of ice VI would occur in the metastable part of the melting curve. In Fig. 9 the equation of state of ices VIII and VII at 300K are plotted as a function of pressure. For pressures below 35000 bar ice VIII (as described by TIP4P/2005) is not mechanically stable and melts into a liquid phase. For pressures below 40000 bar ice VII (as described by TIP4P/2005) is not mechanically stable and melts into a liquid phase. As it can be seen for a certain temperature and pressure ice VIII yields a slightly higher density than ice VII (the densities are quite similar anyway as also pointed out by Bartok and Baranyaibartok_baranyai ). As it can be seen the TIP4P/2005 model is not able to describe accurately the experimental values of the densities of ice VII. In fact it tends to underestimate the experimental values of the densities by about 5 per cent. This is striking since the TIP4P/2005 is able to describe the densities of ices Ih, II, III, IV, V, VI, IX and XII (for pressures up to 20000 bar ) within an error of about 1 per cent and for liquid water up to pressures of about 40000 bar with an error of about 1 per cent. Thus it seems that there is something wrong in the model which prevents of describing accurately the densities of ices VIII and VII at high pressures. Notice that other water models as SPC, SPC/E and TIP4P do also underestimate significantly the density of ice VII at high pressures. Further work is needed to understand the origin of that. One may suggest that the absence of polarisability, or the use of a non very accurate description of the repulsive part of the potential (by the LJ potential), or even the absence of LJ sites located on the hydrogen atoms (to introduce a further degree of anisotropy) may be responsible. The only model that reproduces the experimental densities of ice VII is TIP5P. This is shown in Table 8. However, this is not for free since this model overestimates by about 5-8 per centpccpgdr the densities of ices Ih, II, III, IV, V, VI, IX and XII. Thus TIP5P reproduces the densities of ice VII, but fails completely in describing the densities of the other polymorphs of water JCP_1993_99_5369 ; bookPhysIce ; fortes_jac05 .
Let us finish by presenting the value of the dielectric constant of the plastic crystal phase. It should be pointed out that standard computer simulations (MD or standard MC) can not be used to determine the dielectric constant of ices. Typical lengths of the simulations (several ns or hundred of thousands of cycles) are not sufficient to sample the fluctuations of the polarisation of the solid. To compute dielectric constants of ices it is necessary either to introduce special moves within the Monte Carlo program, as those proposed by Rick and Haymet JCP_2003_118_09291 ; rick05 or to use special techniques as that proposed recently by Lindberg and Wangdielectric_constant_ice . Thus from our study we could not report the dielectric constant of ices VIII and VII. However we could compute the dielectric constant for the plastic crystal since the molecules are able to rotate rather quickly provoking important fluctuations of the total polarisation. We obtained a value of about 96(10) for the plastic crystal phase at 400K and 70000 bar. The dielectric constant of the plastic crystal phase (assuming it exists in real water) has not been reported. The experimental valuejohari_whalley of the dielectric constant of ice VII at room temperature and for a pressure of 23300 bar is of 105. Although it is difficult to compare dielectric constants obtained for somewhat different structures (ice VII and the plastic crystal phase are not the same solid), and somewhat different thermodynamic conditions, the comparison between both values appears as reasonable. For liquid water at room temperature and pressure the TIP4P/2005 predicts a dielectric constant of about 60, whereas the experimental value is of 78. Thus the model underestimates the dielectric constant of liquid water by about 20 per cent. Also for ice Ih, TIP4P models seriously underestimate the dielectric constantdielectric_constant_ice ; JCP_2003_118_09291 ; rick05 . Assuming that similar behaviour could be found for liquid water and the plastic ice, the prediction of the model for the plastic crystal phase seems to be lower than the experimental value of ice VII. The absence of polarisability is likely to be responsible for this deviation.
IV Conclusions
In this work the high pressure region of the phase diagram of water has been determined by computer simulation by using the TIP4P/2005 model. By performing free energy calculations the relative stability of ices VIII and VII, and the melting curve of ice VII was obtained. When compressing water at 440K, the freezing of water into a solid phase occurred in a few ns. The analysis of the solid allows to conclude that it is formed by a body center cubic lattice of oxygens, with the molecules rotating significantly. In summary a plastic crystal phase. It has also been found that ices VIII and VII transform into a plastic crystal phases at temperatures above 390K and pressures below 70000 bar. By performing free energy calculations the melting curve of the plastic crystal phase and the coexistence lines between the plastic crystal phase and ice VII could be determined. In this way a rather extensive region of the phase diagram for the TIP4P/2005 could be reported by the first time. The possible existence of other solid phases or even of other plastic crystal phases for the model should not be discarded yet. The TIP4P/2005 is able to describe qualitatively the phase diagram of water. The model (in common with the popular SPC/E and TIP4P models) fails to describe the density of ice VII along the room temperature isotherm, and underestimates with respect to experiment the stability of ice VII. This is in contrast with the excellent description provided for other coexistence lines and for the densities of other polymorphs appearing at pressures below 20000 bar. Thus the model does not allow to describe quantitatively the behaviour of water at high pressures. Further work is needed to understand the origin of that. On the other hand the model predicts the existence of a new phase, a plastic crystal phase. Notice that all transitions found between the plastic crystal phase and other phases (liquid or ice VII) were found to be first order, so that if the plastic crystal phase exists in real water there should be a first order phase transition separating it from ice VII. Interestly Takii, Koga and Tanaka suggested that the two set of melting curves reported experimentally at 100000 bar could be due to the fact that these two groups were indeed measuring two different transitions, namely the ice VII to plastic crystal (that would correspond to the temperature of 600K given by Mishima and Endomishima78 ) and the plastic crystal to liquid phase (that would correspond to the temperature of 687K given by Datchi, Loubeyre and LeToullec frenchgroup ). Further experimental work is needed to clarify this point.
It would be of interest to study if such a plastic crystal phase does indeed exist for real water. If so it would corresponds to ice XV (the precise roman numeral may change if other solid phases of water are found experimentally before ), and would probably be one of the few cases where computer simulation anticipates an experimental result. In case it exists it may dominate the melting curve of water at high temperatures. The nearly spherical shape of water makes possible the formation of a plastic crystal phase at high temperatures where the strength of the hydrogen bond in units is rather small and where the molecular shape (i.e repulsive forces) play the leading role in the process of freezing. For hard dumbbells or spherocylinders the maximum anisotropy (as given by the ratio between the bond length and the width of the molecule) which allows the formation of a plastic crystal phase is of about vega92b ; vega92c ; MP_1992_77_0803_photocopy ; JCP_1997_107_02696 ; JCP_1997_106_00666 ; ACP_2000_115_0113_nolotengo . Molecules with higher anisotropy freeze into an orientally ordered solid. Thus the formation of plastic crystal phases requires moderate anisotropy in the repulsive part of the potential (the importance of the attractive part decreases substantially at high temperatures). This seems to be the case of water, at least when described as a LJ center plus charges. Besides the experimental importance of finding a plastic crystal phase for water, its presence or absence should also have an impact on the community performing computer simulations of water. Its presence would indicate that current water models are able to predict qualitatively this new feature of the phase diagram of water. Its absence would also be significant since it would indicate that current water models are too spherical and they should be modified so as to predict the disappearance of the plastic crystal phase.
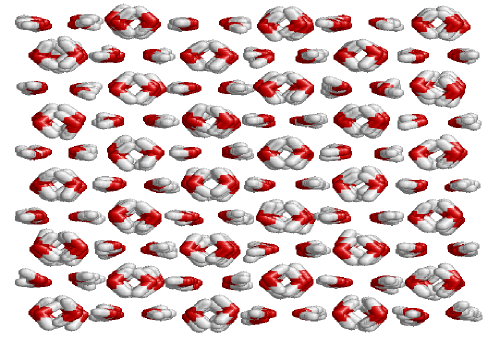
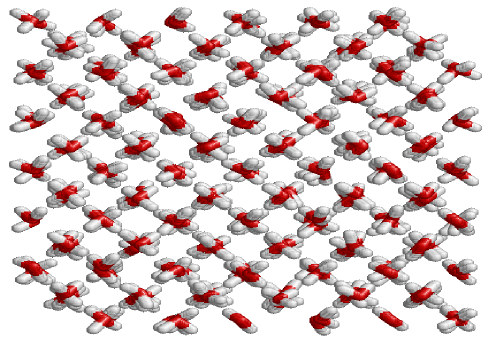
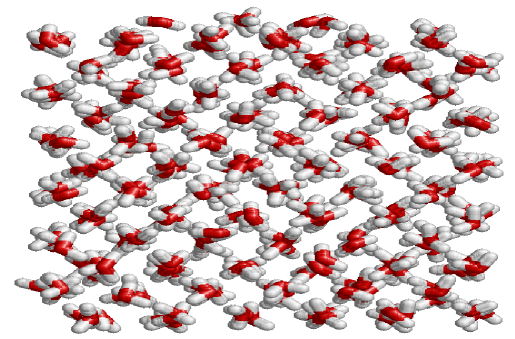
Since a picture is worth a thousand words let us finish by presenting an instantaneous snapshot of ices VII, VIII and of the plastic crystal. This is done in Fig. 10. The orientational disorder of the plastic crystal phase is shown clearly in the figure.
V acknowledgements
This work was funded by grants FIS2007-66079-C02-01 from the DGI (Spain), S-0505/ESP/0229 from the CAM, and 910570 from the UCM. M.M.Conde would like to thank Universidad Complutense by the award of a PhD grant. J. L. Aragones would like to thank the MEC by the award of a pre-doctoral grant. E.G.N. wishes to thank the Ministerio de Educación y Ciencia and the Universidad Complutense de Madrid for a Juan de la Cierva fellowship. Helpful discussions with L.G.MacDowell and J.L.F.Abascal are gratefully acknowledged.
References
- (1) G. Tammann, Kristallisieren und Schmelzen (Johann Ambrosius Barth, Leipzig, 1903).
- (2) G. Tammann, Z.Phys.Chem. 68, 205 (1910).
- (3) P. W. Bridgman, Proc. Am. Acad. Sci. Arts 47, 441 (1912).
- (4) P. W. Bridgman, J. Chem. Phys. 3, 597 (1937).
- (5) P. W. Bridgman, J. Chem. Phys. 5, 964 (1937).
- (6) C. Lobban, J. L. Finney, and W. F. Kuhs, Nature 391, 268 (1998).
- (7) C. G. Salzmann, P. G. Radaelli, A. Hallbrucker, E. Mayer, and J. L. Finney, Science 311, 1758 (2006).
- (8) P. H. Poole, F. Sciortino, U. Essmann, and H. E. Stanley, Nature 360, 324 (1992).
- (9) O. Mishima and H. E. Stanley, Nature 396, 329 (1998).
- (10) P. G. Debenedetti, J. Phys. Cond. Mat. 15, R1669 (2003).
- (11) C. Lobban, J. L. Finney, and W. F. Kuhs, J. Chem. Phys. 112, 7169 (2000).
- (12) P. Ball, Life’s Matrix. A biography of Water (University of California Press, Berkeley, 2001).
- (13) F. Franks, Water a matrix of life (Royal Society of Chemistry, Cambridge, 2000).
- (14) J. L. Finney, Phil.Trans.R.Soc.Lond.B 359, 1145 (2004).
- (15) J. A. Barker and R. O. Watts, Chem. Phys. Lett. 3, 144 (1969).
- (16) A. Rahman and F. H. Stillinger, J. Chem. Phys. 55, 3336 (1971).
- (17) M. D. Morse and S. A. Rice, J. Chem. Phys. 76, 650 (1982).
- (18) H. J. C. Berendsen, J. R. Grigera, and T. P. Straatsma, J. Phys. Chem. 91, 6269 (1987).
- (19) W. L. Jorgensen, J. Chandrasekhar, J. D. Madura, R. W. Impey, and M. L. Klein, J. Chem. Phys. 79, 926 (1983).
- (20) E. Sanz, C. Vega, J. L. F. Abascal, and L. G. MacDowell, Phys. Rev. Lett. 92, 255701 (2004).
- (21) C. Vega, E. Sanz, and J. L. F. Abascal, J. Chem. Phys. 122, 114507 (2005).
- (22) C. Vega, J. L. F. Abascal, E. Sanz, L. G. MacDowell, and C. McBride, J. Phys. Cond. Mat. 17, S3283 (2005).
- (23) C. McBride, C. Vega, E. Sanz, L. G. MacDowell, and J. L. F. Abascal, Molec. Phys. 103, 1 (2005).
- (24) J. L. F. Abascal and C. Vega, J. Chem. Phys. 123, 234505 (2005).
- (25) J. L. F. Abascal, E. Sanz, R. G. Fernández, and C. Vega, J. Chem. Phys. 122, 234511 (2005).
- (26) J. L. Aragones, E. G. Noya, J. L. F. Abascal, and C. Vega, J. Chem. Phys. 127, 154518 (2007).
- (27) E. G. Noya, C. Menduina, J. L. Aragonés, and C. Vega, J. Phys. Chem. C 111, 15877 (2007).
- (28) M. Martin-Conde, L. G. MacDowell, and C. Vega, J. Chem. Phys. 125, 116101 (2006).
- (29) C. Vega, J. L. F. Abascal, and I. Nezbeda, J. Chem. Phys. 125, 034503 (2006).
- (30) C. Vega and E. de Miguel, J. Chem. Phys. 126, 154707 (2007).
- (31) I. Svishchev and P. G. Kusalik, Phys. Rev. Lett. 73, 975 (1994).
- (32) M. Matsumoto, S. Saito, and I. Ohmine, Nature 416, 409 (2002).
- (33) L. Vrbka and P. Jungwirth, J. Phys. Chem. B 110, 18126 (2006).
- (34) D. Quigley and P. M. Rodger, J. Chem. Phys. 128, 154518 (2008).
- (35) A. Laio and M. Parrinello, Proc. Natl. Acad. Sci. 99, 12562 (2002).
- (36) D. H. Dolan, J. N. Johnson, and Y. M. Gupta, JCP 123, 64702 (2005).
- (37) D. H. Dolan, M. D. Knudson, C. A. Hall, and C. Deeney, Nature Physics 3, 339 (2007).
- (38) Y. Takii, K. Koga, and H. Tanaka, J. Phys. Chem. 128, 204501 (2008).
- (39) R. Hemley, A. P. Jephcoat, H. K. Mao, C. S. Zha, L. W. Finger, and D. E. Cox, Letters to Nature 330, 737 (1987).
- (40) M. Somayazulu, J. Shu, C. Zha, A. F. Goncharov, O. Tschauner, H. Mao, and R. Hemley, JCP 128, 64510 (2008).
- (41) C. Vega, J. L. F. Abascal, M. M. Conde, and J. L. Aragones, Faraday Discussions 141 in press (2009).
- (42) J. Kolafa, F. Moucka, and I. Nezbeda, Collect. Czech. Chem. Commun. 73, 481 (2008).
- (43) P. Dyer, H. Docherty, and P. Cummings, J. Chem. Phys. 129, 024508 (2008).
- (44) A. Ghoufi, F. Goujon, V. Lachet, and P. Malfreyt, J. Chem. Phys. 128, 154716 (2008).
- (45) A. Bartok and A. Baranyai, J.of on Crystalline Solids 353, 2698 (2007).
- (46) C. Vega, J. L. F. Abascal, M. M. Conde, and J. L. Aragones, Faraday Discussions 141, in press (2009).
- (47) V. F. Petrenko and R. W. Whitworth, Physics of Ice (Oxford University Press, Oxford, 1999).
- (48) D. Eisenberg and W. Kauzmann, The Structure and Properties of Water (Oxford University Press, London, 1969).
- (49) W. F. Kuhs, J. L. Finney, C. Vettier, and D. V. Bliss, J. Chem. Phys. 81, 3612 (1984).
- (50) B. Kamb and B. L. Davis, Proc. Natl. Acad. Sci. 52, 1433 (1964).
- (51) G. P. Johari, A. Lavergne, and E. Whalley, JCP 61, 4292 (1974).
- (52) J. D. Bernal and R. H. Fowler, J. Chem. Phys. 1, 515 (1933).
- (53) L. Pauling, J. Am. Chem. Soc. 57, 2680 (1935).
- (54) V. Buch, P. Sandler, and J. Sadlej, J. Phys. Chem. B 102, 8641 (1998).
- (55) M. P. Allen and D. J. Tildesley, Computer Simulation of Liquids (Oxford University Press, 1987).
- (56) D. van der Spoel, P. J. van Maaren, and H. J. C. Berendsen, J. Chem. Phys. 108, 10220 (1998).
- (57) M. Lísal, J. Kolafa, and I. Nezbeda, J. Chem. Phys. 117, 8892 (2002).
- (58) S. W. Rick, J. Chem. Phys. 120, 6085 (2004).
- (59) D. Frenkel and B. Smit, Understanding Molecular Simulation (Academic Press, London, 2002).
- (60) M. Parrinello and A. Rahman, J. Appl. Phys. 52, 7182 (1981).
- (61) S. Yashonath and C. N. R. Rao, Molec. Phys. 54, 245 (1985).
- (62) J. K. Johnson, J. A. Zollweg, and K. E. Gubbins, Molec. Phys. 78, 591 (1993).
- (63) D. Frenkel and A. J. C. Ladd, J. Chem. Phys. 81, 3188 (1984).
- (64) C. Vega and E. G. Noya, J. Chem. Phys. 127, 154113 (2007).
- (65) C. Vega, E. Sanz, J. L. F. Abascal, and E. G. Noya, J. Phys. Condens. Matter 20, 153101 (2008).
- (66) D. A. Kofke, J. Chem. Phys. 98, 4149 (1993).
- (67) D. A. Kofke, in Monte Carlo Methods in Chemical Physics, edited by D. M. Ferguson, J. I. Siepmann, and D. G. Truhlar (John Wiley and Sons, 1998), vol. 105, p. 405.
- (68) D. V. der Spoel, E. Lindahl, B. Hess, G. Groenhof, A. E. Mark, and H. J. C. Berendsen, J. Comput. Chem. 26, 1701 (2005).
- (69) S. Nosé, Molec. Phys. 52, 255 (1984).
- (70) W. G. Hoover, Phys. Rev. A 31 (1985).
- (71) M. Parrinello and A. Rahman, J. Appl. Phys. 52, 7182 (1981).
- (72) S. Nosé and M. L. Klein, Molec. Phys. 50, 1055 (1983).
- (73) U. Essmann, L. Perera, M. L. Berkowitz, T. Darden, H. Lee, and L. G. Pedersen, J. Chem. Phys. 103, 8577 (1995).
- (74) G. E. Lindberg and F. Wang, J. Phys. Chem. B 112, 6436 (2008).
- (75) A. J. C. Ladd and L. Woodcock, Chem. Phys. Lett. 51, 155 (1977).
- (76) A. J. C. Ladd and L. Woodcock, Molec. Phys. 36, 611 (1978).
- (77) J. Cape and L. Woodcock, Chem. Phys. Lett. 59, 271 (1977).
- (78) J. Q. Broughton and G. H. Gilmer, J. Chem. Phys. 84, 5749 (1986).
- (79) R. L. Davidchack and B. B. Laird, J. Chem. Phys. 108, 9452 (1998).
- (80) J. R. Morris and X. Song, J. Chem. Phys. 116, 9352 (2002).
- (81) P. M. Agrawal, B. M. Rice, and D. L. Thompson, J. Chem. Phys. 119, 9617 (2003).
- (82) O. A. Karim and A. D. J. Haymet, J. Chem. Phys. 89, 6889 (1988).
- (83) T. Bryk and A. D. J. Haymet, J. Chem. Phys. 117, 10258 (2002).
- (84) R. G. Fernandez, J. L. F. Abascal, and C. Vega, J. Chem. Phys. 124, 144506 (2006).
- (85) J. L. F. Abascal, R. G. Fernandez, C. Vega, and M. A. Carignano, J. Chem. Phys. 125, 166101 (2006).
- (86) T. J. Frankcombe and G. J. Kroes, J.Phys.Chem.C 111, 13044 (2007).
- (87) J. Wang, S. Yoo, J. Bai, J. R. Morris, and X. C. Zeng, J. Chem. Phys. 123, 036101 (2005).
- (88) J. Vatamanu and P. G. Kusalik, J. Phys. Chem. B 110, 15896 (2006).
- (89) E. G. Noya, C. Vega, and E. de Miguel, J. Chem. Phys. 128, 154507 (2008).
- (90) C. Vega, C. McBride, E. Sanz, and J. L. Abascal, Phys. Chem. Chem. Phys. 7, 1450 (2005).
- (91) Y. Fei, H.-K. Mao, and R. J. Hemley, J. Chem. Phys. 99, 5369 (1993).
- (92) V. F. Petrenko and R. W. Whitworth, Physics of Ice (Oxford University Press, 1999).
- (93) A. D. Fortes, I. G. Wood, M. Alfredsson, L. Vočadlo, and K. S. Knight, J. Appl. Cryst. 38, 612 (2005).
- (94) S. W. Rick and A. D. J. Haymet, J. Chem. Phys. 118, 9291 (2003).
- (95) S. W. Rick, J. Chem. Phys. 122, 094504 (2005).
- (96) G. P. Johari, A. Lavergne, and E. Whalley, J. Chem. Phys. 61, 4292 (1974).
- (97) O. Mishima and S. Endo, J. Chem. Phys. 68, 4417 (1978).
- (98) F. Datchi, F. P. Loubeyre, and R. LeToullec, Phys. Rev. B 61, 6535 (2000).
- (99) C. Vega, E. P. A. Paras, and P. A. Monson, J. Chem. Phys. 96, 9060 (1992).
- (100) C. Vega, E. P. A. Paras, and P. A. Monson, J. Chem. Phys. 97, 8543 (1992).
- (101) E. P. A. Paras, C. Vega, and P. A. Monson, Molec. Phys. 77, 803 (1992).
- (102) C. Vega and P. A. Monson, J. Chem. Phys. 107, 2696 (1997).
- (103) P. Bolhuis and D. Frenkel, J. Chem. Phys. 106, 666 (1997).
- (104) P. A. Monson and D. A. Kofke, in Advances in Chemical Physics, edited by I. Prigogine and S. A. Rice (John Wiley and Sons, 2000), vol. 115, p. 113.
| ( Å) | H-O-H | ( Å) | (K) | (e) | ( Å) |
|---|---|---|---|---|---|
| 0.9572 | 104.52 | 3.1589 | 93.2 | 0.5564 | 0.1546 |
| p/bar | Ice VII-plastic crystal (heating) | Plastic crystal-ice VII (cooling) |
| 70000 | 390 | 350 |
| 65000 | 380 | 340 |
| 60000 | 360 | 310 |
| Phase | T/K | p/bar | A/NkBT | G/NkBT | |
|---|---|---|---|---|---|
| Ice VIII | 300 | 70000 | 1.709 | -9.36 | 20.23 |
| Ice VII | 300 | 70000 | 1.707 | -9.75 | 19.87 |
| Ice VII∗ | 300 | 70000 | 1.707 | -9.74 | 19.88 |
| Plastic | 400 | 70000 | 1.638 | -6.46 | 16.69 |
| Water | 300 | 1292 | 1.050 | -15.45 | -14.56 |
| T/K | p/bar | ||||
|---|---|---|---|---|---|
| fluid-plastic crystal | |||||
| 340.00 | 60193 | -10.45 | -10.03 | 1.574 | 1.622 |
| 360.00 | 60486 | -10.24 | -9.85 | 1.572 | 1.613 |
| 380.00 | 61135 | -10.04 | -9.73 | 1.565 | 1.610 |
| 400.00 | 62000 | -9.87 | -9.58 | 1.562 | 1.609 |
| 420.00 | 63108 | -9.75 | -9.43 | 1.565 | 1.607 |
| 440.00 | 64390 | -9.52 | -9.30 | 1.564 | 1.608 |
| 460.00 | 66042 | -9.35 | -9.12 | 1.560 | 1.607 |
| T/K | p/bar | ||||
|---|---|---|---|---|---|
| fluid-VI | |||||
| 244.97 | 8540 | -12.23 | -12.96 | 1.245 | 1.359 |
| 254.39 | 10000 | -12.02 | -12.91 | 1.265 | 1.365 |
| 265.14 | 12000 | -11.98 | -12.84 | 1.286 | 1.373 |
| 278.27 | 15000 | -11.77 | -12.76 | 1.316 | 1.385 |
| 293.67 | 20000 | -11.55 | -12.64 | 1.365 | 1.406 |
| 303.39 | 25000 | -11.38 | -12.55 | 1.396 | 1.427 |
| 309.21 | 30000 | -11.26 | -12.47 | 1.435 | 1.447 |
| 311.52 | 35000 | -11.21 | -12.39 | 1.464 | 1.467 |
| 311.39 | 40000 | -11.15 | -12.32 | 1.492 | 1.485 |
| 308.14 | 45000 | -11.03 | -12.26 | 1.518 | 1.503 |
| 302.87 | 50000 | -10.98 | -12.20 | 1.542 | 1.520 |
| 293.92 | 55000 | -10.97 | -12.15 | 1.572 | 1.537 |
| 281.74 | 60000 | -10.89 | -12.11 | 1.596 | 1.553 |
| fluid-VII | |||||
| 352.00 | 60375 | -10.30 | -10.46 | 1.578 | 1.663 |
| 340.00 | 58066 | -10.42 | -10.57 | 1.570 | 1.658 |
| 320.00 | 54276 | -10.74 | -10.74 | 1.565 | 1.651 |
| 300.00 | 50988 | -10.90 | -10.90 | 1.549 | 1.646 |
| T/K | p/bar | ||||
|---|---|---|---|---|---|
| VII-plastic crystal | |||||
| 440.00 | 101354 | -8.99 | -8.49 | 1.749 | 1.728 |
| 420.00 | 90168 | -9.44 | -8.81 | 1.729 | 1.698 |
| 400.00 | 80146 | -9.76 | -9.19 | 1.707 | 1.674 |
| 390.00 | 75596 | -9.82 | -9.33 | 1.693 | 1.659 |
| 377.00 | 70000 | -10.04 | -9.53 | 1.681 | 1.645 |
| 360.00 | 63292 | -10.27 | -9.79 | 1.666 | 1.623 |
| 350.00 | 59665 | -10.40 | -9.95 | 1.656 | 1.617 |
| VII-VIII | |||||
| 69.70 | 55000 | -11.97 | -12.01 | 1.719 | 1.718 |
| 69.00 | 70000 | -11.67 | -11.71 | 1.758 | 1.758 |
| 69.49 | 80000 | -11.45 | -11.48 | 1.781 | 1.782 |
| VI-VII | |||||
| 301.00 | 50742 | -12.19 | -10.85 | 1.523 | 1.642 |
| 280.00 | 51549 | -12.29 | -11.03 | 1.529 | 1.655 |
| 240.00 | 52454 | -12.50 | -11.23 | 1.538 | 1.669 |
| 100.00 | 54767 | -13.15 | -11.85 | 1.567 | 1.712 |
| 50.00 | 55369 | -13.38 | -12.06 | 1.576 | 1.726 |
| VI-VIII | |||||
| 69.00 | 55000 | -12.14 | -12.02 | 1.594 | 1.719 |
| 35.00 | 32974 | -12.90 | -12.58 | 1.519 | 1.660 |
| Phase boundary | T/K | p/bar | ||
|---|---|---|---|---|
| fluid-VI-VII | 301 | 50742 | ||
| fluid-VII-plastic | 352 | 60375 | ||
| VI-VII-VIII | 69 | 55000 |
| Phase | T/K | p/bar | /(gcm | ||
| Expt | TIP4P/2005 | TIP5P | |||
| VII | 300 | 45000 | 1.718 | 1.625 | 1.729 |
| VII | 300 | 70000 | 1.810 | 1.707 | 1.814 |
| Ih | 250 | 0 | 0.920 | 0.921 | 0.976 |
| II | 123 | 0 | 1.190 | 1.199 | 1.284 |
| III | 250 | 2800 | 1.165 | 1.160 | 1.185 |
| IV | 110 | 0 | 1.272 | 1.293 | 1.371 |
| V | 223 | 5300 | 1.283 | 1.272 | 1.331 |
| VI | 225 | 11000 | 1.373 | 1.380 | 1.447 |
| IX | 165 | 2800 | 1.194 | 1.190 | 1.231 |
| XII | 260 | 5 | 1.292 | 1.296 | 1.340 |
CAPTION TO THE FIGURES
b) as a function of angle for ices VII (solid line) and VIII (dashed-dotted line) at 300K and 70000bar and for the plastic crystal phase (dotted line) at 400K and 70000bar. For clarity the function of ice VIII has been shifted by 90 degrees to illustrate the similarity with that of ice VII.