A Holistic Approach to Information Distribution
in Ad Hoc Networks
Abstract
We investigate the problem of spreading information contents in a wireless ad hoc network with mechanisms embracing the peer-to-peer paradigm. In our vision, information dissemination should satisfy the following requirements: (i) it conforms to a predefined distribution and (ii) it is evenly and fairly carried by all nodes in their turn. In this paper, we observe the dissemination effects when the information moves across nodes according to two well-known mobility models, namely random walk and random direction. Our approach is fully distributed and comes at a very low cost in terms of protocol overhead; in addition, simulation results show that the proposed solution can achieve the aforementioned goals under different network scenarios, provided that a sufficient number of information replicas are injected into the network. This observation calls for a further step: in the realistic case where the user content demand varies over time, we need a content replication/drop strategy to adapt the number of information replicas to the changes in the information query rate. We therefore devise a distributed, lightweight scheme that performs efficiently in a variety of scenarios.
I Introduction
It is commonly acknowledged that user devices are rapidly becoming tantamount to a communication hub, sporting arrays of GPS navigators, web browsers, videogame consoles and screens flashing the latest news or local sightseeing information. In this context, most pieces of information are likely to be of general use, and therefore a sensible dissemination and caching policy would be desirable.
In this work, we focus on such an environment: few and far between access points, or gateway nodes, in a highly-populated network area where user devices are equipped with a data cache and communicate through the ad hoc networking paradigm. Users create a cooperative environment where information is exchanged among nodes in a peer-to-peer fashion. In particular, they form a pure peer-to-peer system, whose nodes may simultaneously act as both “clients” and “servers” to the other nodes in the network. Also, we envision a system that achieves a desired distribution over the network of the information that users may be interested in. By information distribution, we mean the distribution according to which the information copies should be cached in the network. The nodes storing an information copy will act as providers for this content.
Traditional approaches to information caching in communication networks [1, 2, 3, 4] are based on the solution of linear programming problems, which often require global knowledge of the network condition, or lead to quite complex solutions that involve significant communication overhead. Unlike previous approaches, our solution is fully distributed and it comes at a very low cost in terms of communication overhead. Our goal is to achieve the desired content distribution by properly letting the information move across the network.
More specifically, while developing our solution, we identify a number of issues that need to be addressed.
-
•
Achieving the desired distribution of the information: regardless of how the information is distributed at the outset, the system should be able to identify where the information should be stored in the network.
-
•
Fair distribution of information burden: as mentioned above, a node storing the information acts as provider for that information; of course, this role may exact a high toll from nodal resources in terms of bandwidth or power consumption; it is therefore advisable that the role of content provider be handed over to neighboring nodes quite frequently, without altering the information distribution.
-
•
Dynamic adaptation to time-varying content demands: given an initial number of information replicas, which implies a fair load distribution among the provider nodes, the system should be able to adapt to the varying information query rate, by increasing or decreasing the number of information copies in the network as needed.
We deal with the above issues and develop a solution that features the following advantages:
-
•
it is fully distributed;
-
•
it is content-transparent, i.e., it does not require knowledge of the contents stored by the neighboring users;
-
•
it works with minimum overhead.
In particular, motivated by the need of a balanced load distribution among the provider nodes and of an equal quality of service provisioning to the users, we target a uniform distribution of contents, either over the network spatial area or over the network nodes. With this aim in mind, in Section III we investigate the applicability of two well-known mobility models, namely the random walk and the random direction model, to disseminate the information across the network. Both strategies, using the experimental setup in Section IV, are proven to yield a distribution of the information copies that is close to the target distribution, regardless of the considered network scenario (Section V). Also, the obtained results show that the level of fairness in distributing the burden among provider nodes depends on the number of information copies stored in the network. Thus, when the user query rate for a content varies over time, we address the problem of how to let the number of content replicas adapt to the changing content demand. To address this issue, in Section VI we devise a content replication/drop algorithm that controls the number of information copies in the network, taking into account the time-varying behavior of the contents popularity level. The performance of our scheme is presented in Section VI-A.
II Related work
Our study is related to the problem of optimal cache placement in wireless networks. Several works have addressed this issue by exploiting its similarity to the facility location and the -median problems. Both these problems are NP-hard and a number of constant-factor approximation algorithms have been proposed for each of them [5, 1, 3]; these algorithms however are not amenable to an efficient distributed implementation.
Distributed algorithms for allocation of information replicas are proposed, among others, in [6, 4, 7, 8]. These solutions typically involve significant communication overhead, especially when applied to mobile environments, and focus on minimizing the information access cost or the query delay. In our work, instead, we consider a cooperative environment and aim at a uniform distribution of the information copies, while evenly distributing the load among the nodes acting as providers.
Relevant to our study is also the work in [9], which computes the (near) optimal number of replicas of video clips in wireless networks, based on the bandwidth required for clip display and their access statistics. However, the strategy proposed in [9] requires a centralized implementation and applies only to strip or grid topologies. In the context of sensor networks, the study in [10] analytically derives the minimum number of sensors that ensure full coverage of an area of interest, under the assumption of a uniform sensor deployment.
Again in the context of sensor networks, approaches based on active queries following a trajectory through the network, or agents propagating information on local events have been proposed, respectively, in [11] and [12]. Note that both these works focus on the forwarding of these messages through the network, while our scope is to make the desired information available by letting it move through nodes caches.
III Achieving the desired information distribution
We start by addressing the problem of where the information copies should be cached in the network so as to obtain the desired content distribution.
We consider a tagged111I.e., we assume information to be uniquely identifiable. information and we take the desired distribution to be uniform, over either the network area (spatial uniformity) or the network nodes (nodal uniformity). Spatial uniformity is motivated by the need of providing the same quality of service (e.g., probability of finding the content and information delivery delay) to all network users, while nodal uniformity fosters load balancing among the nodes acting as content providers.
To achieve the target distribution, we let the information move across nodes according to two well-known mobility models, namely the random walk [13] and the random direction [14] models, which are often used to represent the movement of user nodes in ad hoc networks. In our context, a mobile entity is not a network node but, rather, a copy of the tagged information which “hops” from a user node that just stopped being a provider for that information onto another node which will become the new content provider. We apply the two mobility models and develop the dissemination strategies detailed below.
-
•
The random walk dissemination (RWD) strategy: we consider the simplest random walk possible, in which each mobile entity, i.e., an information copy, roams the network by moving from one node to a one-hop neighbor selected with equal probability. Each node caches the information before handing it over to the next hop in the information copy visit pattern. This approach requires trivial node operations and introduces minimal overhead, thus representing a lower-bound benchmark for more advanced information mobility models.
-
•
The random direction dissemination (RDD) strategy: it implies that each mobile entity alternates periods of movement (move phase) to periods during which it pauses (pause phase). In our context, the pause phase corresponds to the time period during which the information copy is stored at a provider node. The move phase starts at the time instant when the current information provider hands over the content to one of its one-hop neighbors, and it ends when the new provider is reached by the information copy. At the beginning of a move phase, the current provider independently selects the direction and the distance222Note that randomly selecting a travel distance is equivalent to randomly selecting speed and travel time. for the movement of the information copy, thus identifying a target location whose position is included in the content messages. An application-driven routing allows the information to be moved towards the target location, with each forwarder selecting as a next hop the neighbor that best fits the ideal trajectory designed by the original provider. The neighbor selection process is performed in a reactive manner, as it involves an exchange of advertisement (by the forwarder) and reply (by candidate next hop neighbors) messages at each movement hop. When a node has no neighbors closer than itself to the target position, it elects itself as the new provider, and the pause phase starts again. Some remarks are in order. First, this scheme requires that user nodes be capable to estimate their position (i.e., through GPS), a fair assumption in most practical scenarios. Second, the information moves across user nodes, thus it may be transmitted along a direction that just approximates the planned trajectory, or it may be stored at a node that is nearby (but not exactly at) the selected geographical destination. Third, geographical areas devoid of nodes that can support the information movement may be encountered during move phases: in that case, the current forwarder assumes a boundary has been hit, and applies a reflection to the movement angle.
As already mentioned, using the RWD and RDD strategies translates into a fully-distributed, low-overhead solution. Furthermore, in the literature there are results showing that the random walk and the random direction mobility models can lead to a uniform distribution of the mobile entities. Indeed, if the network topology can be represented as an undirected, connected, non-bipartite graph, then the distribution of entities moving according to the random walk model converges to a unique stationary distribution regardless of the initial distribution, and this stationary distribution is uniform in the case of regular graphs333A graph is regular if each of its vertices has the same number of neighbors. [15]. As for the random direction model, in [14] it has been shown that, if at time the position and the orientation of mobile entities are independent and uniform over a finite square area, they remain uniformly distributed over the area for all time instants , provided that the entities move independently of each other.
However, in practice: (i) wireless ad hoc networks often have an irregular structure, even changing over time if the users are mobile, thus the results in [15] for the random walk model do not directly apply; (ii) in the case of the RDD strategy, the information only approximately reaches its geographical destination, as noted above; (iii) we need to address both spatial and nodal uniformity. Therefore, in the following, we investigate the actual distribution of the information that is obtained through our approach and how far it is from the target distribution.
IV Experimental set-up and methodology
Before delving into the evaluation of the techniques we propose for information dissemination, we first describe our experimental settings.
We use the ns-2 network simulator, where all nodes are equipped with standard 802.11b interfaces, with 11 Mbps fixed data transmission rate. We enhanced the simulator with the random walk and the random direction dissemination algorithms, described in Section III. We also implemented a simple application that allows mobile nodes to query provider nodes. Any node wishing to access a copy of the information maintained in the network executes a limited-scope flooding of a query message. Queries can traverse a maximum number of hops, , before being discarded. We improve the query propagation process by adopting the PGB technique [20] to select forwarding nodes that relay queries to their destinations. Sequence numbers are used to detect and discard duplicate queries and avoid the broadcast storm phenomenon [16]. Upon reception of a query, a provider replies with a probability that is inversely proportional to the number of hops traversed by the query message. Note that it is out of the scope of this paper to design an optimized application to access information: nevertheless, our simple design is sufficient to evaluate the information dissemination algorithms discussed in Section III.
In the following, we define the simulation settings we analyze in this work. Note that all results presented in the remainder of this paper are averaged out over 10 simulation runs, each with a randomized selection of initial information providers. Simulation time is set to 10,000 seconds, unless specified otherwise. Moreover, we assume a network composed of nodes that are spatially distributed on a square area of m side. Each node has a transmission range of 20 m. When employing the RDD scheme, providers characterize the information move phase by randomly choosing angles that are uniformly distributed in , and exponentially distributed distances, with mean 100 m. We study both static and mobile cases, as will be detailed below.
IV-A Static node spatial distribution
We define the following static node deployments, samples of which are depicted in Fig. 1:
-
•
Uniform distribution: nodes are uniformly placed on ;
-
•
Stationary distribution: we consider a deployment, where, as discussed in [17], nodes are more often located towards the center of the network area;
-
•
Clustered distribution: we assume nodes to be deployed in four equally sized clusters. Each cluster corresponds to a “point of interest” around which nodes are located. Nodes are also placed in-between clusters so as to ensure network connectivity. In practice, we implement the random trip model as defined in [18] and take a snapshot of the network topology as our initial node distribution.
 (a) Uniform
|
 (b) Stationary
|
 (c) Clustered
|
IV-B Node mobility
The impact of node mobility on the dissemination mechanisms we designed is analyzed for the following mobility models:
-
•
Stationary Random Waypoint: as discussed in [17], we enhance the basic random waypoint model so as to reduce the transient phase of our analysis. In this setting, the initial node distribution is the same as the stationary distribution described for the static case; each node selects a random destination in and moves towards it at a constant speed selected uniformly at random from a distribution with a mean of 3 m/s. The pause time is set to 10 s.
-
•
Random trip: following the definition in [18], nodes revolve around four “points of interest”. The initial node deployment conforms to the clustered distribution defined for the static case. The stationary random waypoint model defined above guides node movements inside a cluster. Inter-cluster mobility is allowed with probability 0.3.
IV-C Parameter space
We now define the parameters used in our evaluation, accounting for the initial distribution and number of information providers in the network, as well as the query behavior of mobile nodes.
-
•
Number of information providers: at the beginning of each simulation run, a predefined number of providers is randomly chosen among all nodes in the network. is the number of providers available at time ; we choose .
-
•
Information caching time: when taking up the role of information provider, a node keeps a local copy for a time . In this work, we assume with . In the following we present results for seconds.
-
•
Information demand: we assume nodes to issue queries to information providers using the simple application defined above. Without loss of generality, we focus on one information content (of size 1KB) that is made available in the network. Users’ demand for the available information is modeled through a query rate which we assume to be common to all users, with . The aggregate query rate over all nodes depends on the number of information providers currently active in the network444Indeed, providers do not issue requests to access the content, i.e., . While our analysis mainly focuses on a constant user demand, we also introduce a more realistic scenario in which varies over time.
IV-D Evaluation metrics
To understand to which extent the information distribution achieved by our dissemination techniques resembles the desired content diffusion, we employ the well-known goodness-of-fit test on the inter-distance between information copies. As a matter of fact, we can compare the measured inter-distance distribution against the theoretical distribution of the distance between two points, whose position is a random variable following the target distribution. Using inter-distances instead of actual coordinates allows us to handle a much larger number of samples (e.g., instead of just samples) thus making the computation of the index more accurate. As discussed before, we consider the following two reference distributions:
-
•
Spatial uniformity: since we consider a square area where nodes are deployed and we seek a uniform dissemination of content over the network area, the target distribution is the solution to the bidimensional case of the hypercube line picking problem [19], which is known to be:
with .
-
•
Nodal uniformity: in order to test the uniformity over the network nodes, we take as a reference distribution the empiric distribution of node inter-distances measured in simulation.
 (a) Static scenario
|
 (b) Mobile scenario
|
 (a) Static scenario
|
 (b) Mobile scenario
|
Then, we provide a basic performance evaluation of the information query process achieved by our application, and focus on the following metrics.
-
•
Cumulative provider time: we evaluate the load balancing properties of the different information dissemination strategies by computing the cumulative time each node spends as an information provider. Given that the cache time is deterministic, we can compute , where accounts for the number of times node takes up the role of information provider during the simulation time.
-
•
Served queries at each information provider: we measure the cumulative number of served queries for each information provider . Note that this metric is also useful to understand the impact of the hop-based reply policy implemented by provider nodes (i.e., the likelihood of replies decreases with the increase of hops traversed by the query).
-
•
Euclidean distance to access information: we measure the cumulative Euclidean distance from a node to its closest information provider, every seconds. The distance to access information is the result of the spatial distribution of information in the network and can be used to measure how “fair” our algorithms are toward to each querying node.
V The Logistics of Information
In this section, we look at how the RWD and RDD algorithms we designed can achieve the first two objectives outlined in the introduction of the paper: a desirable distribution of the information and a fair distribution of information burden across the provider nodes. In the set of results we present, no information drop is allowed; indeed, for both the RWD and RDD strategies, a provider that hands the information over to another node considers the transfer as successful only if it receives an acknowledgment message, otherwise it repeats the procedure by selecting a different neighbor. The duplication probability we obtained by implementing such an application was negligible (order of ). Thus, we can consider that the overall number of providers does not change during the simulation time (i.e., ); additionally, the query rate is set to a constant value equal to 0.0025 req/s, resulting, as discussed in Sec. IV-C, in req/s.
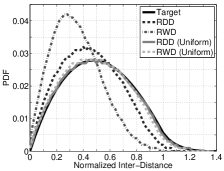
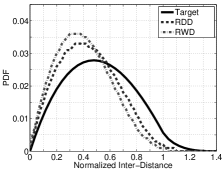
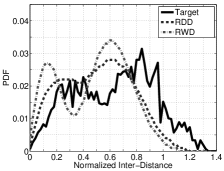
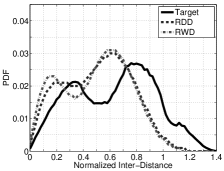
Spatial information distribution. We give an overview of the complete set of results for different static node deployments (uniform, stationary and clustered) and node mobility models (random waypoint and random trip models), and compare the behavior of the RWD and RDD policies. In Fig. 2 and Fig. 3, the target probability density functions (PDF) correspond to different desired information distributions: in the former the target is spatial uniformity, while in the latter the objective is nodal uniformity.
Fig. 2 shows the PDF of the inter-distance between information copies, for both dissemination policies, when nodes are deployed according to the stationary distribution and move according to the random waypoint model. Similarly, Fig. 3 shows the PDF of the inter-distance between information copies in the static and mobile case when nodes are deployed in clusters and move according to the random trip model. Results are derived for and caching time s. The PDFs are computed from the samples collected over all the simulation time.
In Fig. 2 (a), for the static uniform node deployment, both the RWD and the RDD algorithms yield an information distribution that perfectly matches the reference distribution (overlapping it in the plot). Under the static stationary scenario, the reference PDF is better approximated by the RDD policy than by the RWD policy. As for the mobile scenario, not only does node mobility not alter the “quality” of the approximation achieved by the RDD policy, but it also considerably helps the RWD policy in achieving a better information distribution across the geographical area, as shown in Fig. 2 (b). Similar observations can be done when we consider a clustered scenario, depicted in Fig. 3: in the static case, the RDD policy outperforms the RWD policy in better approximating the target distribution, while, in the mobile case, the RWD and the RDD perform similarly.
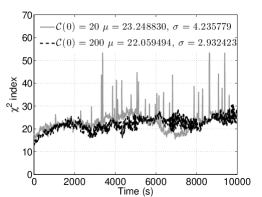
Further insights can be gained by observing more closely the behavior of the two information dissemination techniques in a simple case: we therefore focus on static stationary scenarios and emphasize, using the index, the differences between the target information distribution and the distribution achieved by the RWD and RDD policies. As a target information distribution we take the spatial uniformity.
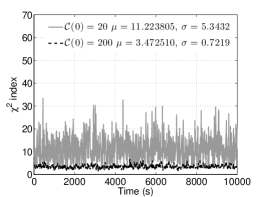
The index is computed considering the measured and the objective probability density function: the smaller the index, the better the fit. The evolution of the index is plotted over time when the RWD and the RDD are applied, respectively, in Fig. 4 and Fig. 5. We considered the number of information copies concurrently moving through the network to sum to and the caching time to be equal to s; also, each measured PDF is obtained from a 10 s observation. The mean () and standard deviation () of the index are reported in the legend of the figures.
By looking at the plots, we observe that varying the number of information providers in the network dramatically affects the results: increasing the number of copies from 20 to 200, the divergence from the theoretical uniform distribution greatly decreases. Furthermore, when compared, the time evolutions of the index of the RWD and RDD algorithms show that the latter better approximates the target information distribution.
Load balancing. We now turn our attention to the important question of load balancing across providers. For brevity, below we present just a subset of the results we derived. In particular, since the RDD manages to provide a better approximation to the desired information distribution than RWD, we only show the performance of the RDD policy. Also, we present results only for the static uniform scenario and the mobile network with random waypoint mobility, since a similar performance is achieved under clustered network topologies.
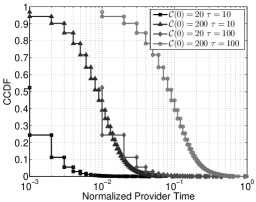
In Fig. 6 we plot the complementary distribution function (CCDF) of the cumulative time a node is serving as an information provider (i.e., the provider time) over the whole duration of our experiments, that is, we normalize the provider time to the simulation time. The results are presented for the RDD policy in a static uniform scenario, for different values of the caching time and when the initial number of information providers sums to and to (which correspond, respectively, to 1% and 10% of the total number of nodes).
Looking at the figure, we observe that when we increase from 20 to 200, the load is spread more uniformly across the nodes since there is an increased opportunity for being (randomly) selected as information provider. The effect of an increased caching time from 10 s to 100 s, is, instead, a translation of the CCDF to higher values, without affecting the load distribution.
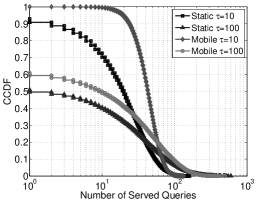
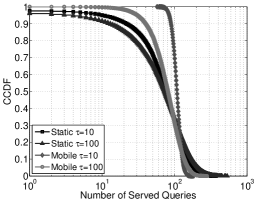
We now look deeper at the impact of different scenarios and simulation parameters on the effective load that an information provider supports in terms of number of served queries. Note that the number of served queries is not equal to the number of queries a provider receives because of the reply behavior described in Section IV.
Figs. 7 a) and b) present the CCDF of the number of queries served by the provider nodes, respectively, when and . Both the static uniform scenario and the mobile scenario with random waypoint mobility are considered. Looking at the plots, we note that an increased number of initial providers is effective in spreading the query load more evenly, especially in the static case. In the case of the static topology, when , roughly 50% of providers never get a chance to satisfy a user request, whereas with , about 60% of providers are serving a number of queries comprised in the interval . The combined effect of node mobility and an increased number of initial providers is striking: Fig. 7 b) indicates that approximately 95% of providers serve roughly the same amount of queries. Thus, node mobility, that at a first sight could be considered harmful to information distribution mechanisms, turns out to be a good ally in terms of load balancing.
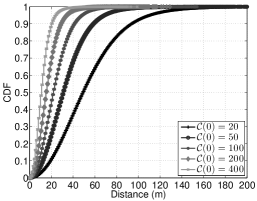
Clients’ perspective. Lastly, we take the perspective of users issuing queries to access information held by providers. In Fig. 8 we plot the cumulative distribution function (CDF) of the Euclidean distance from a querying node to the closest provider, for the mobile scenario with random waypoint mobility and s. More specifically, we study the impact of an increasing number of initial providers , when we let this simulation parameter grow from 20 to 400 providers (i.e., from 1% to 20% of the total number of nodes). Both the mean distance to access information, ranging from 50 m to 15 m, and the variance of the CDF, shrink considerably when increasing the number of initial providers. Given that the node radio range is set to 20 m, the implications of this result are the following: when a sufficient number of initial providers is injected into the network (i.e., 200–400), nodes may access the information within one hop, whereas an insufficient number of initial information copies (i.e., 20–100) may constrain a node to use routing to access information that is more than one hop away.
Summary. The evaluation we carried out showed that, despite their simplicity and low overhead, the proposed algorithms for information dissemination (RWD and RDD) achieve the first two objectives defined in this work. Indeed, as long as enough providers are injected into the network (namely, 10% of the total number of nodes), we have that:
-
(i)
under static scenarios, the information distribution yielded by RWD and RDD well approximates the uniform distribution; in particular the match is excellent with uniform node deployment for both strategies, while RDD outperforms RWD in stationary and clustered topologies;
-
(ii)
under mobile scenarios, the approximation is still good for both cases of random waypoint and random trip mobility and, interestingly, mobility significantly improved the RWD performance;
-
(iii)
in terms of load balancing, both dissemination strategies evenly distribute the service load across the provider nodes; again, mobility has a beneficial effect.
VI Information replication and drop
In this section, we factor in a new source of dynamic behavior, i.e., a variable information demand. We thus address the following question: provided the information demand is uniformly distributed among the nodes, how can we enhance the basic information dissemination schemes to cope with a time-varying query rate and, thus, ?
We propose the following simple modification that applies to both dissemination policies illustrated in Sec. III. Whenever the caching time of an information provider expires, the node decides whether the information should be dropped, replicated or if the legacy policy (RWD or RDD) should be applied. In this work we study a simple heuristic for an information provider to take replication or dropping decisions.
During the bootstrap of the network, the content manager selects an initial number of information providers and a reference query load that each provider is expected to support. Assuming , the relationship between and can be expressed as:
| (1) |
where is the initial per-node query rate, and is the cumulative query rate, as predicted by the content manager. The choice of is less straightforward, but, as shown in the previous section, a sufficiently high number of copies ought to be selected (e.g., 10% of the total number of nodes).
During the caching period, provider keeps track of the number of served queries, . When the caching time expires, is compared to and the following actions are taken.
-
•
Replication: if the measured load is higher than the reference load plus a tolerance factor , the information will be replicated and two (as opposed to one) new providers are chosen.
-
•
Drop: if the measured load is lower than the reference load minus a tolerance factor , the information will be dropped and no new provider is selected.
-
•
Handover: if the absolute value of the difference between measured load and reference load is less than , the legacy behavior is adopted, i.e., the information is handed over to another node selected according to the RWD or RDD algorithm.
Depending on the current query rate, we would like the number of providers to converge to the ideal value which would approximately maintain the constant reference load derived in (1). The number of information providers should converge to:
| (2) |
Below, we evaluate the RWD and RDD algorithms enhanced with the replication/drop heuristic just outlined.
VI-A Results
Here we focus on a static network composed by nodes deployed according to the stationary distribution defined in Sec. IV, in which the only source of dynamics is due to a time-varying query rate .
In the following, we set the simulation parameters to , s, , req/s while the simulation time is 20000 seconds. We simulate a time-varying per node query rate by dividing the simulation time in four phases:
-
1.
increases by % every second when s;
-
2.
req/s when s;
-
3.
decreases by % every second when s;
-
4.
req/s when s.
Given providers, using (1) we set req/s as the reference query load that each information provider is requested to satisfy.
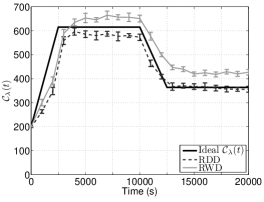
Equation (2) helps in predicting the ideal number of providers that should emerge from the replication/drop process: in phase 2), the ideal number of providers should add up to , whereas in phase 4) providers.
Fig. 9 refers to the static stationary scenario and presents the time evolution of the number of providers in the network collected at 1,000 s intervals, each point averaged over 10 simulation runs. A 95% confidence interval is also shown. We observe that, as the query rate increases, the replication process takes place and the number of information providers increases, following the ideal number of providers reported in the figure. During steady state, providers shift to the legacy handover behavior, whereas when the query rate starts its descent, the dropping process is selected and the number of providers decreases, until a new steady state regime is reached.
When the query rate settles to a steady state (phase 2) and 4)), the replication/drop heuristic behaves differently if applied to the RWD or the RDD mechanisms. The RWD policy consistently overestimates by roughly 10 % the number of ideal providers; instead, the RDD policy is very accurate. The discrepancy between the RDD and RWD policies can be attributed to the poorer ability of the latter mechanism to approximate a uniform distribution of the information, as pinpointed in Sec. V. The consequence is that the replication/drop process will be altered due to an uneven query load at providers, hence the better performance of the RDD mechanism.
We also performed a series of experiments for a scenario in which nodes move according to the random waypoint mobility model. The behavior of the replication/drop heuristic is comparable to that of a static scenario: however, similarly to our findings in Sec. V, we observe that mobility helps in spreading the query load among providers, hence the number of providers that emerge in the replication/drop process is a better approximation of the ideal value.
VII Conclusions
We considered a peer-to-peer wireless network, where nodes may act as both clients and providers to other network nodes. In such a cooperative environment, we addressed the problem of achieving a desired distribution of information and a fair load distribution among the provider nodes. We designed low-overhead, content-transparent, distributed algorithms that regulate the information storage at the network nodes and allow a fair selection of the nodes acting as providers.
Our experimental results indicated that under a variety of scenarios including static, mobile, and clustered network topologies, our simple mechanisms were effective in approximating a desired information distribution. Mobility appeared to be a useful ally, instead of a problematic phenomenon, since it helped to achieve an even distribution of the load on providers.
We also challenged our dissemination mechanisms with a time-variant information demand, and proposed a simple enhancement to achieve a constant, predefined load imposed at each provider despite this additional source of dynamics. Experiments showed that a quick convergence to an ideal number of providers can be achieved in a simple, distributed way.
References
- [1] I. Baev, R. Rajaraman, “Approximation Algorithms for Data Placement in Arbitrary Networks,” SCM-SIAM SODA, 2001.
- [2] S. Prabh, T. Abdelzaher, “Energy-Conserving Data Cache Placement in Sensor Networks,” ACM Transactions on Sensor Networks, vol. 2, no. 1, pp. 178–203.
- [3] P. Nuggehalli, V. Srinivasan, C.-F. Chiasserini, and R.R. Rao, “Efficient Cache Placement in Multi-hop Wireless Networks,” IEEE/ACM Transactions on Networking, vol. 14, no. 5, pp. 1045–1055, Oct. 2006.
- [4] B. Tang, H. Gupta, S. Das, “Benefit-based Data Caching in Ad Hoc Networks,” Trans. on Mobile Computing, vol. 7, no. 3, pp. 208–217, Mar. 2008.
- [5] K. Jain, V. V. Vazirani, “Approximation Algorithms for Metric Facility Location and -Median Problems Using the Primal-Dual Schema and Lagrangian Relaxation,” J. ACM, vol. 48, no. 2, 2001.
- [6] T. Hara, “Effective Replica Allocation in Ad Hoc Networks for Improving Data Accessibility,” IEEE INFOCOM, 2001.
- [7] L. Yin, G. Cao, “Balancing the Tradeoffs between Data Accessibility and Query Delay in Ad Hoc Networks,” IEEE SRDS, 2004.
- [8] J. Holliday, R. Steinke, D. Agrawal, A. E. Abbadi, “Epidemic Algorithms for Replicated Databases,” IEEE Transactions on Knowledge and Data Engineering, vol. 15, no. 3, pp. 1–21, May-June 2003.
- [9] A. Aazami, S. Ghandeharizadeh, T. Helmi, “Near Optimal Number of Replicas for Continuous Media in Ad-hoc Networks of Wireless Devices,” Proc. Intl. Workshop on Multimedia Information Systems, 2004.
- [10] S. Kumar, T. H. Lai, J. Balogh, “On k-coverage in a Mostly Sleeping Sensor Network,” ACM Mobicom, Philadelphia, PA, 2004.
- [11] N. Sadagopan, B. Krishnamachari, and A. Helmy, “Active Query Forwarding in Sensor Networks,” Ad Hoc Networks Journal, Elsevier, vol. 3, no. 1, pp. 91-113, Jan. 2005.
- [12] D. Braginsky and D. Estrin, “Rumor Routing Algorithm For Sensor Networks,” First Workshop on Sensor Networks and Applications (WSNA), Atlanta, GA, Sept. 2002.
- [13] A. Einstein, “Investigations on the Theory of the Brownian Motion,” ed. R. Forth, translated by A.D. Cowper (1926, reprinted 1956), Einstein, Collected Papers, vol. 2, pp. 170–82, pp. 206-22.
- [14] P. Nain, D. Towsley, B. Liu, and Z. Liu, “Properties of Random Direction Model,” IEEE INFOCOM, Mar. 2005.
- [15] S. Bandyopadhyay, E. J. Coyle, T. Falck, “Stochastic Properties of Mobility Models in Mobile Ad Hoc Networks,” IEEE Transactions on Mobile Computing, vol. 6, no. 11, pp. 1218–1229, Nov. 2007.
- [16] S.Y. Ni, Y.C. Tseng, Y.S. Chen and J.P. Sheu, “The Broadcast Storm Problem in a Mobile Ad Hoc Network,” ACM Mobicom, 1999.
- [17] J.-Y. Le Boudec, M. Vojnovic, “Perfect Simulation and Stationarity of a Class of Mobility Models,” IEEE Infocom, Mar. 2005.
- [18] J.-Y. Le Boudec, M. Vojnovic, “The Random Trip Model: Stability, Stationary Regime, and Perfect Simulation,” ACM /IEEE Trans. on Networking, vol. 14, no. 6, pp. 1153–1166, Dec. 2006.
- [19] M. Trott, “The Mathematica Guidebooks Additional Material: Average Distance Distribution,” 2004.
- [20] V. Naumov, R. Baumann, T. Gross “An Evaluation of Inter-vehicle Ad Hoc networks Based on Realistic Vehicular Traces,” ACM MobiHoc, 2006.