Study of Solid State Photon Detectors Read Out of Scintillator Tiles
Abstract
We present preliminary results on efficiency and light collection uniformity read out performances of different assemblies of scintillator tiles, coupled with solid state photon detectors of different make. Our test beam data suggest that the use of 2 mm tiles without wavelength shifting fibers may be possible in an ILC hadron calorimeter.
1 Introduction
The present work is part of an ongoing R&D activity on ILC calorimetry at INFN Laboratori Nazionali di Frascati motivated by several issues pointed out by previous experiences, particularly the CALICE hadron calorimeter which is discussed elsewhere [2] in these proceedings.
The CALICE prototype [3] is made of , 5 mm thick, scintillator tiles each with a wavelength shifter (WS) fiber delivering green-shifted scintillation light to a MEPhI/Pulsar silicon photo-multiplier (SiPM) [4] attached to one of its ends. The WS fiber is positioned in an arc shaped groove individually milled in each tile, and its function is to shift the wavelength of the scintillation light toward the green where the quantum efficiency of the MEPhI SiPM is highest, and to improve the light collection efficiency.
One question investigated here regards the use of WS fibers, which may become an engineering and cost challenge for the construction of a full scale, several million tiles, ILC calorimeter. This prompted the study of alternative readout solutions, without the use of WS fibers, to simplify the detector construction. Several companies [5] are now building solid state photon devices similar to the original MEPhI SiPM (i.e. Hamamatsu MPPC’s, ITC-IRST SRD’s, SenSL SPM’s), which are also sensitive to blue light and make the WS fiber even less necessary. As the cost of an ILC detector scales up with size, a second aspect of this work relates to the performances of thinner scintillator tiles, which could reduce the total detector volume.
2 Test Set Up and Calibrations
We exposed to a beam of MeV electrons, of about (105) mm2 RMS transverse size, produced at the Frascati Beam Test Facility(BTF) [6], seven different assemblies of scintillator tiles coupled to different silicon photon detectors (PD).
Config. Scint. Type Tile Thick. PD (tot. area) # of pxl pxl size Vbrk(V) Vbias(V) G(106) 1 BC400 5 mm Hamam. (1 mm2) 400 50m 68.1 2.6 1.3 2 BC400 5 mm Hamam. (1 mm2) 1,600 25m 69.6 2.1 0.5 3 Vladimir 5 mm Hamam. (1 mm2) 400 50m 68.9 1.8 1.1 4 EJ212 2 mm Hamam. (1 mm2) 400 50m 69.0 1.6 2.2 5 EJ212 2 mm Hamam. (1 mm2) 1,600 25m 68.5 3.3 0.5 6 BC400 5 mm Hamam. (9 mm2) 3,600 50m 67.3 1.1 0.6 7 Vladimir 5 mm MEPhI (1 mm2) 1,156 20m 68.4 4.8 0.5
We cut and polished a total of 6 (33) cm2 plastic scintillator tiles with 2 and 5 mm thickness, and wrapped them in aluminized mylar and black tape; the scintillators used were the BC400 from Saint Gobain and the EJ212 from Eljen Technology which have almost identical characteristics and a similar scintillator made in Vladimir (Russia). We also studied, as a reference, a CALICE tile made with the Vladimir scintillator and a 1 mm diameter Kuraray Y11 wavelength shifter fiber. We used as photon detectors three Hamamatsu MPPC types, differing in the total number of square pixels and individual sizes: three 400, 50 m2 pixels, two 1600, 25 m2 pixels and one 3600, 50 m2 pixels; the CALICE tile was read out with a MEPhI/Pulsar SiPM with 1156, 20 m2 pixels. Other configurations with the ITC-IRST and SensL PD’s are currently under study, and will be presented in a future paper. The characteristics of the configurations discussed in this paper are summarized in Tab. 1.
The PD was attached with optical glue directly to the middle of one side of the tile in all the different configurations except for the (33 mm2), 3600 pixel Hamamatsu MPPC which was instead glued to the center of a face, and the CALICE tile, which has the MEPhI/Pulsar SiPM mechanically coupled, without glue or optical grease, to one of the ends of the WS fiber.
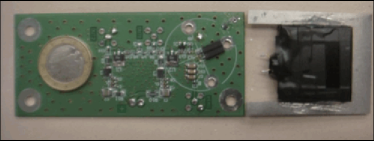
The PD’s were read out with a low noise 10 amplifier built in Frascati, an INFN-Pisa design based on the GALI-5 chip, which was connected to the tile-PD assembly as shown in Fig. 1. The seven tiles were then mounted in a test box where they were aligned to each other and kept in a fixed position. The box was cabled to provide low voltage power to the amplifiers, voltage bias to the PD’s and to extract the amplified signals. It was also equipped with a temperature probe to monitor the operating temperature with a typical resolution of .
Over the whole period of data taking the temperature in the experimental hall was regulated to C, and the air temperature inside the box has been kept constant at C using a Peltier cell in thermal contact with the box to extract some of the heat produced by the amplifiers (about 1 W/channel).
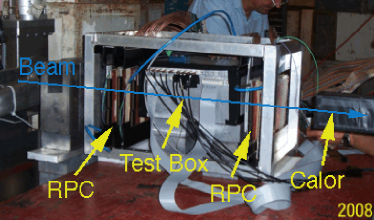
To measure the impact point of the beam on the tile we used an external tracker including 5 glass RPC [7], 3 of which were placed in front and 2 behind the test box on the beam line. The RPC were equipped with orthogonal planes of strips 8 mm wide, digitally read out, providing X-Y measurement in each plane with a point resolution of 2.3 mm. As the beam at the Frascati BTF can provide a tunable number of particles per pulse (1-1000) [6], the test setup included a lead glass calorimeter module to measure the beam total energy on a pulse by pulse basis and allowing the selection of events containing any number of electrons (0,1,…n).
A picture of the set up in the beam line is shown in Fig. 2.
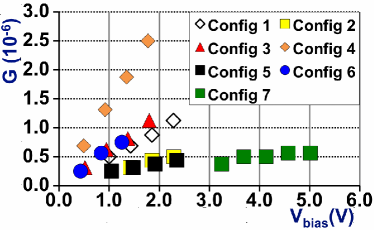
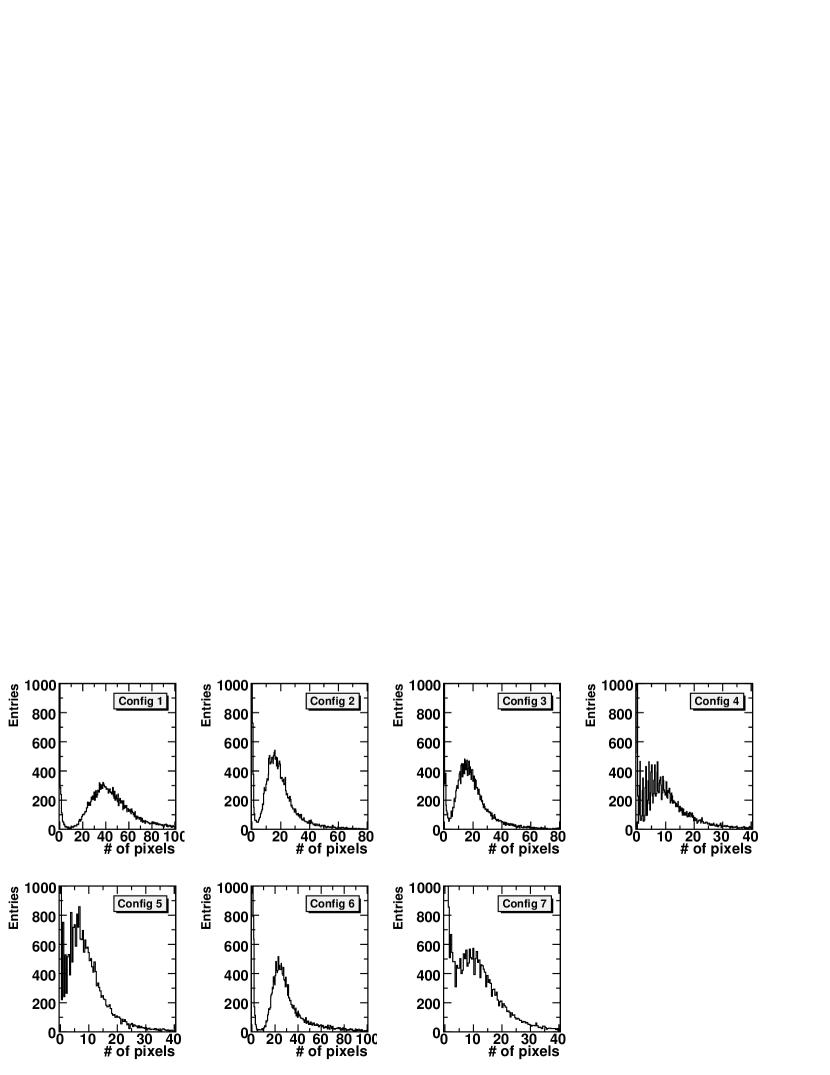
The response of the tiles under test to 1 MIP, in terms of the number of fired pixels, is given in Fig. 3. To obtain these distributions, the integrated charge corresponding to one pixel (PD gain) must be measured. Such measurement can be obtained from the charge distributions of background events selected requiring a pedestal reading from the lead-glass calorimeter (0 MIPs). In these distributions a large pedestal peak is accompanied by smaller but distinguishable charge peaks corresponding to 1 or occasionally 2 pixels, fired due to the thermal noise of the devices (typical singles rate being a few 100 kHz to 1 MHz); the gain is measured by the distance of these peaks from the pedestal. We repeated this measurement for different bias voltages and found the breakdown voltage of each device, defined as the voltage corresponding to zero gain. In Fig. 4 we show the plot of the gain as a function ; as expected all the PD’s show good linearity. All the data shown in this paper were taken with the same values for listed in Tab. 1, which also shows the corresponding gain expressed in number of electrons ().
3 Results and Conclusions
We have collected several million events containing exactly 1 MIP, and studied the performances of the various devices as a function of the beam particle impact point on the tiles. In Fig. 5 we show the amplitude of the PD signal (number of pixels), which is proportional to the amount of scintillation light collected, as a function of one coordinate, whereas in the four leftmost plots of Fig. 6 we show the efficiency in two dimensions. The efficiency is defined by the number of times a signal above 2 pixels is observed in the PD over the number of times a particle has crossed the corresponding tile; the chosen threshold corresponds to about 1/8 to 1/4 of a MIP signal, depending on the configuration.
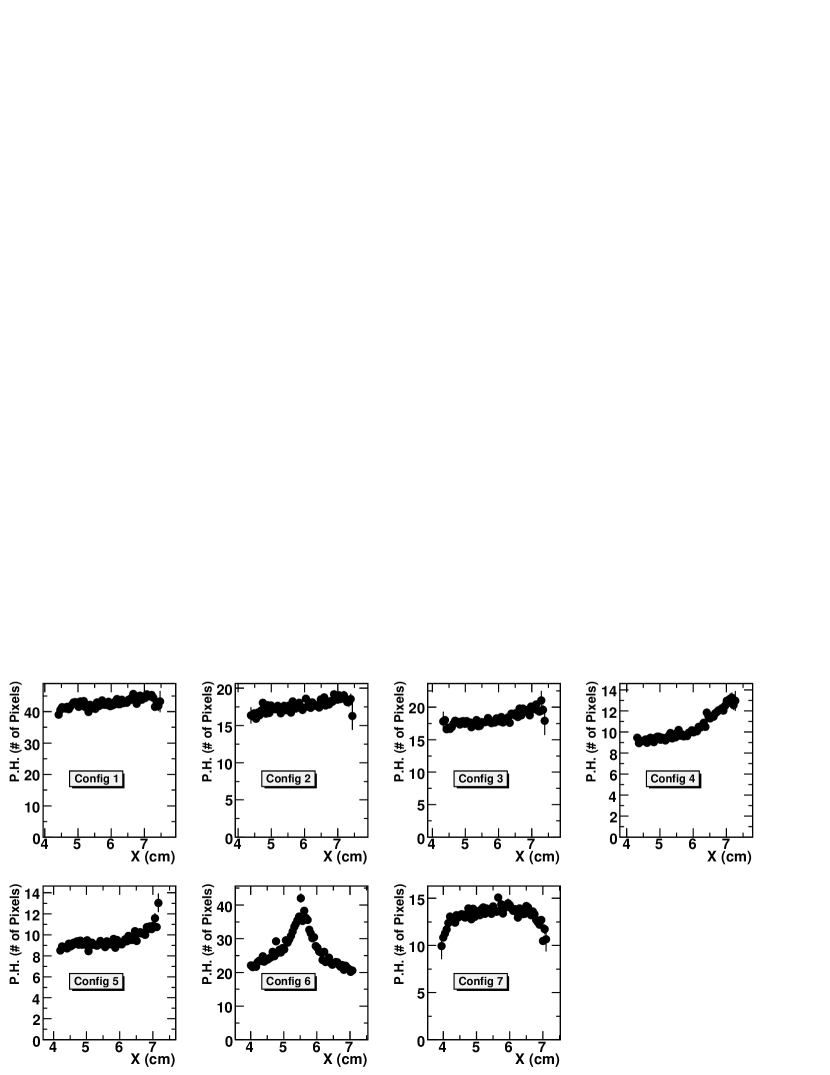
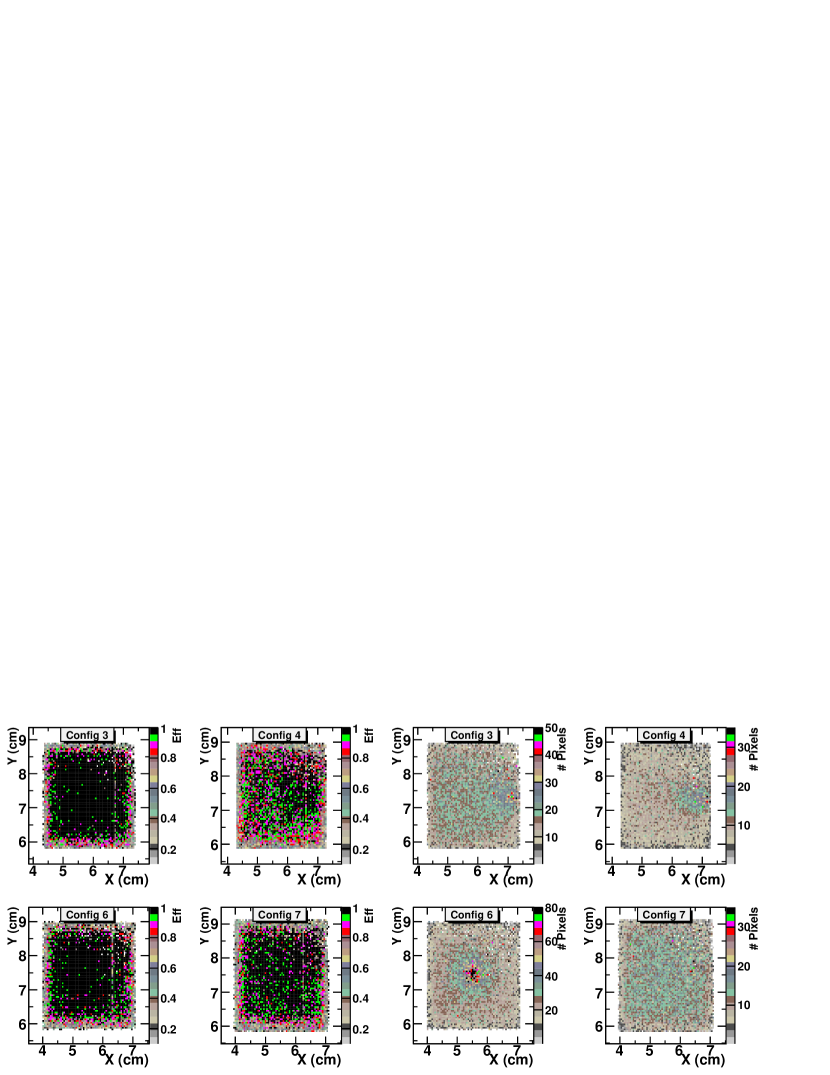
From Fig. 5, we can see that all the tiles read out without using the fiber show a somewhat higher non-uniformity in light collection, but without loss of efficiency. Is evident that the signal amplitude is maximal when the impinging particle is closest to the PD, and decreases with distance. This effect is also visible for the CALICE tile, where the light is collected by the fiber, and where a degradation of light collection is observed near the edges . We estimate a rather high non-unifomity of when the PD is attached to the face of the tile (config. 6), while config. 3 and 4 are more uniform ( and respectively). The latter two values are small compared to the intrinsic fluctuations of a MIP energy deposit, therefore their effect on an energy measurement should also be small. In the four rightmost plots of Fig. 6 we show the X,Y distribution of the pulse height for configurations number 3,4,6 and 7. As one can see, the largest response variation is restricted to a small region near the position of the PD, being quite uniform elsewhere. This means that only a small fraction of all particles crossing a tile is affected by this non-uniformity. The difference in efficiency between the 5 mm and the 2 mm tile is evident from the two upper leftmost plots of Fig. 6 (config. 3 vs 4); nevertheless, an efficiency greater than over a large portion of the tile is observed even with the thinner scintillator.
These preliminary results suggest that direct read out of scintillator tiles with silicon PD for an ILC hadron calorimeter application is possible even using very thin tiles, and prompt for detailed Monte Carlo studies to estimate their performances in a detector.
This R&D program will continue in the future with the study of more PD and configurations. The tunability of the number of particles in the beam, peculiar to the Frascati BTF, will also allow studies of the dynamic range of each tile-PD read out configuration. Future studies will include measurements of the timing performances of these read out schemes.
4 Acknowledgments
We would like to thank Dr. V. Rusinov, ITEP Moscow, for many useful suggestions on the use of the CALICE tile assembly; L. Daniello and G. Mazzenga for their technical skills and G. Papalino for the assembly of the test box and associated electronics.
References
-
[1]
This paper presented by R. de Sangro at LCWS08:
http://ilcagenda.linearcollider.org/contributionDisplay.py?contribId=118&sessionId=22&confId=2628 -
[2]
See:
http://ilcagenda.linearcollider.org/contributionDisplay.py?contribId=50&sessionId=2&confId=2628 - [3] See for example B. Dolgoshein et al., Nucl.Inst.Meth. A 540 (2005), 368-380.
- [4] A. Akindinov et al., Nucl. Instr. Meth. A 387 (1997) 231; M. Danilov, arXiv:0812.1098 [physics.ins-det].
- [5] Hamamatsu Photonics, Japan. http://jp.hamamatsu.com; SensL Technologies Ltd., Cork, Ireland. http://www.sensl.com; ITC-IRST, Trento, Italy. http://www.itc.it/irst
- [6] A. Ghigo et al., Nucl. Instrum. Meth. A 515 (2003) 524.
- [7] A. Calcaterra et al., IEEE Trans. Nucl. Sci. 53 (2006) 341.