Dust Formation Observed in Young Supernova Remnants with Spitzer
Abstract
We present dust features and masses observed in young supernova remnants (SNRs) with Spitzer IRS mapping and staring observations of four youngest supernova remnants: SNR 1E102.2-7219 (E0102) in the SMC, Cas A and G11.2-0.3 in our Galaxy, and N132D in the LMC. The spectral mapping data revealed a number of dust features which include 21 micron-peak dust and featureless dust in Cas A and 18-micron peak dust in E0102 and N132D. The 18 micron-peak feature is fitted by a mix of MgSiO3 and solid Si dust grains, while the 21-micron peak dust is by a mix of silicates and FeO; we also explore dust fitting using Continuous Distribution of Ellipsoid grain models. We report detection of CO fundamental band from Cas A in near-infrared. We review dust features observed and identified in other SNRs. The dust emission is spatially correlated with the ejecta emission, showing dust is formed in SN ejecta. The spectra of E0102 show rich gas lines from ejecta including strong ejecta lines of Ne and O, including two [Ne III] lines and two [Ne V] lines which allow us to diagnostic density and temperature of the ejecta and measure the ejecta masses. E0102 and N132D show weak or lacking Ar, Si, and Fe ejecta, whereas the young Galactic SNR Cas A show strong Ar, Si, and S and weak Fe. We discuss compositions and masses of dust and association with those of ejecta and finally, dust contribution from SNe to early Universe.
1. Introduction
Meteoritic and astronomical stuides show that presolar, cosmic grains condense in the dense, warm stellar winds of evolved stars and in supernova explosions. Mantles of the pre-existing dust in molecular clouds are vaporized as the forming stars and planetary system heat them. A small fraction of the dust survived solar system formation without alteration, protected inside asteroids. The most abundant presolar grains are SiC, nanodiamonds, amorphous silicates, forsterite and enstatite, and corundum (Al2O3) (Messenger et al. 2006). Some isotopic anomalies of heavy elements in meteorites have been attributed to the dust that had condensed deep within expanding supernovae.
Recent deep sub-mm observations have also shown there to be galaxies and QSOs with very large dust masses (108 ) at z (Bertoldi et al. 2003). The timescales for low-mass stars to release their dust are too long to explain these high redshift systems. In contrast, supernovae produce copious amounts of heavy elements and release them on short timescales (Morgan & Edmunds 2003; Dwek et al. 2008). Theoretical modeling of the conditions in the supernova ejecta indicate that Type-II SNe are sources of dust formation and should be able to produce substantial quantities of dust, on the order of a solar mass per explosion (Deneault, Clayton, & Heger 2003; Todini & Ferrara 2001; Nozawa et al. 2003). Yet until very recently, there existed little observational evidence that this actually occurs.
There is now clear evidence for dust formation in core-collapse supernovae, but the quantity of dust formed within SNe ejecta is still a subject of debate. For SN1987A, this includes dust emission, dust absorption and a drop in line intensities for the refractory elements that signals that dust is being formed (Kozasa et al. 1989). Detections of SiO and CO fundamentals with Spitzer observations futher provide evidence of dust formation in SNe (Kotak et al. 2006). For the young Galactic SNR, Cas A, ISO observations gave evidence for the association of the dust with the ejecta by requiring a mixture of dust grains that are not typical of the ISM. Submillimeter observations of Cas A and Kepler with SCUBA (Dunne et al. 2003; Morgan et al. 2003) suggest the presence of large amounts of cold dust ( at 15–20 K), but with some controversy related to foreground material. Krause et al. (2004) showed that much of the 160m emission observed with Spitzer is foreground material, suggesting there is no cold dust in Cas A. Wilson & Batrla (2005), however, used CO emission towards the remnant to show that up to about a solar mass of dust could still be associated with the ejecta rather than with the foreground material.
We present Spitzer IRS spectral mapping of the entire SNRs of Cas A, E0102, and N132D and an IRS staring mode data of G11.2-0.3, and near-infrared observations of Cas A for the first overtone CO detection. We identify the dust composition associated with the ejecta and discuss dust formation in SNe with an estimate of the total mass of freshly formed dust.
2. Cas A
Cas A is one of the youngest Galactic SNRs, with an age of 335 yr attributed to a SN explosion in AD 1671. The progenitor of Cas A is believed to be a Wolf-Rayet star with a mass of 15-30 M⊙ (Young et al. 2006) We present a short summary of Spitzer Infrared Spectrograph (IRS) mapping observations of Cas A which were published in Rho et al. (2008), and we added spectral fitting with the dust models of continuous distributions of ellipsoidals (CDE).
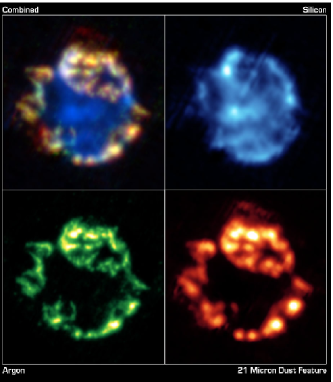
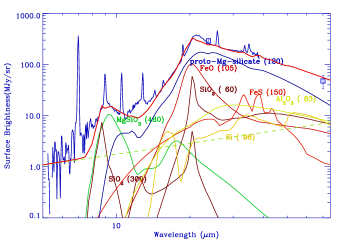
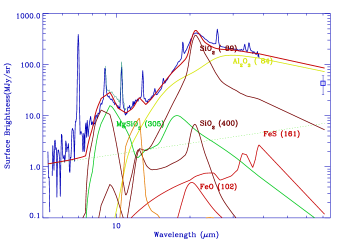
Gas lines of Ar, Ne, O, Si, S and Fe, and dust continua were strong for most positions. We identify three distinct ejecta dust populations based on their continuum shapes. The dominant dust continuum shape exhibits a strong peak at 21 m. A line-free map of 21 m-peak dust made from the 19-23 m range closely resembles the [Ar II], [O IV], and [Ne II] ejecta-line maps as shown in Fig. 1a, implying that dust is freshly formed in the ejecta. We identify three distinct classes of dust associated with the ejecta as shown in Fig. 1b. Spectral fitting of the 21m-peak dust implies the presence of SiO2, Mg protosilicates, and FeO grains in these regions in Fig. 2a. The silicate composition is responsible for the 21 m peak, suggesting that the dust forms around the inner-oxygen and S-Si layers and is consistent with Ar being one of the oxygen burning products. We also include amorphous MgSiO3 (480 K) and SiO2 (300 K) to account for the emission feature around the 9.8 m. The composition of the low temperature (40-90 K) dust component necessary for reproducing 70 m is rather unclear. Either Al2O3 (80 K) (Model A in Table 1 of Rho et al. 2008) or Fe (100 K) (Model B in Table 1) can fit equally well.
The second dust type exhibits a rising continuum up to 21 m and then flattens thereafter. This “weak 21 m” dust is likely composed of Al2O3 and C grains. The third dust continuum shape is featureless with a gently rising spectrum and is likely composed of MgSiO3 and either Al2O3 or Fe grains (Fig. 1c). Using the least massive composition for each of the three dust classes yields a total mass of 0.02 M⊙. Using the most-massive composition yields a total mass of 0.054 M⊙. The primary uncertainty in the total dust mass stems from the selection of the dust composition necessary for fitting the featureless dust as well as 70 m flux. The freshly formed dust mass derived from Cas A may be able to explain the lower limit on the dust masses in high redshift galaxies when assuming there is no significant dust destruction.
We also performed spectral fitting of the 21m-peak dust with CDE models for SiO2 and MgSiO3 and the spherical model for the rest of dust composition. The 21m peak dust is reasonably well fit by with SiO2 and Al2O3 in Fig. 2b without the composition of Mg proto-silicate and with much less contribution of FeO. In addition, previously unidentified 11-12.5m feature can be fit with the CDE model of SiC, which is one of the important pre-solar grains. Slight excess of model at 10m absorption feature can be compensated when we use the extinction of Chiar & Tielen (2007) in Fig. 2b. The estimate of dust mass using the CDE fittting of SiO2 slightly increases the mass, but within the range of the previous estimate of Rho et al. (2008).
3. SNR 1E0102.2-72.3 (E0102)
We present Spitzer IRS and IRAC observations of the young supernova remnant E0102 (SNR 1E0102.2-7219) in the Small Magellanic Cloud. We performed an IRS staring observation toward the southeastern shell of E0102 (R.A. and Dec. 02, J2000) as a part of our Young SNR Spitzer GO program (PI: Rho). The Long Low (LL: 15-40 m) IRS data were taken on 2005 August 14 with 6 cycles of 30 sec exposure time; this yields a total exposure time of 360 sec for the first and second staring positions. The Short Low (SL: 5-15 m) IRS observations were made with 3 cycles of 60 sec exposure time; this yields a total exposure time of 360 sec per sky position. We also used archival IRS mapping data from the IRS Legacy SMC program, which data were 6 times shallower than our GO IRS staring mode data, but still helpful to generate line maps.
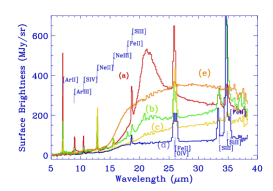
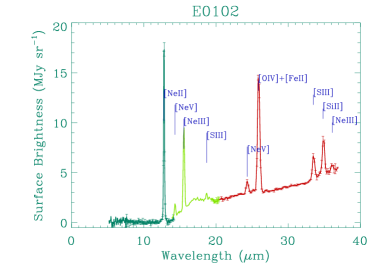
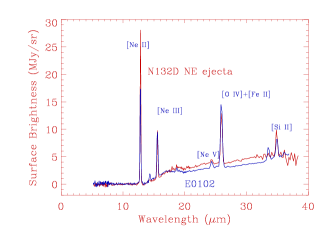
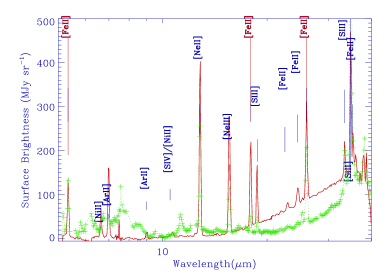
The infrared spectra in Figure 3 show both line and continuum. The detected lines include strong ejecta lines of Ne and O, including two [Ne III] lines at 15.5 and 36.0 m, and two [Ne V] lines at 14.3 and 24.3 m and weak Si and S lines. Unlike the young Galactic SNR Cas A, E0102 lacks emission from Ar and Fe, both in the infrared and at other wavelengths. The [Ne II] line at 12.8 m is broad, with a velocity dispersion of 2,000-4,500 km s-1, showing that it originates in fast-moving ejecta.
3.1. Dust Spectral Fitting and Dust Mass of E0102
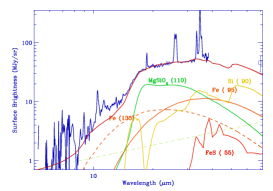
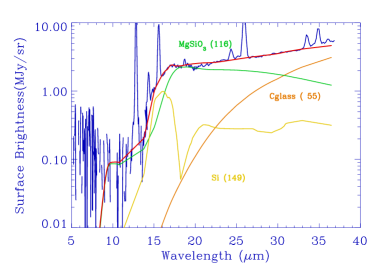
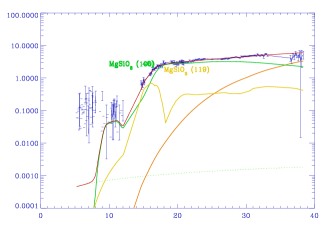
The IRS spectra of E0102.2-7219 have a prominent dust feature peaking at 18 m which coincides spatially with the emission from the infrared-emitting ejecta. This is clear evidence that dust is forming in the ejecta of the supernova remnant E0102. To determine the dust composition and mass, we performed spectral fitting to the IRS dust continuum using the deep IRS spectra shown in Figure 3. The spectrum shows a 18m-peak in the continuum which we attribute to dust. First, we estimated the contribution of the synchrotron emission to the infrared spectrum using the radio fluxes (0.65 Jy at 408 MHz) and spectral index (-0.70) (Amy & Ball 1993). The expected synchrotron fluxes are (1.4 - 5.5) MJy sr-1 between 5-40 m, which is a very small contribution to the infrared continuum (1%, see Fig.4).
We performed spectral fitting to the IRS continua with the Planck function multiplied by the absorption efficiency () for various dust compositions and the detailed dust fitting technique and mass estimation method is described in Rho et al. (2008). The dust compositions, temperatures, and masses obtained from the best fits are summarized in Table 1.
| Model () | Dust Compositions (temperature [K], mass [M⊙]) | Mass (M⊙) |
|---|---|---|
| A (2.41) | MgSiO3 (116, 3.80E-5), Si (150, 6.20E-5), C (55, 5.00E-3) | 0.015 (a5.12) |
| B (1.98) | MgSiO3 (117, 3.21E-5), Si (114, 4.4E-4), Al2O3 (55, 2.06E-3) | 0.007 (a2.53) |
| C (2.16) | MgSiO3 (124, 2.34E-5), Si (149, 6.3E-5), | |
| Al2O3 (60, 3.33eE-4), C (55, 4.350E-3), Mg2SiO4 (100, 1.10E-5) | 0.014 (a4.80) |
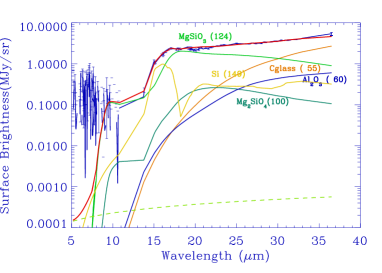
The 18m-peak dust feature is fitted by a mix of MgSiO3 and Si dust grains, while the rest of the continuum requires either carbon (Model A; Figure 4) or Al2O3 grains (Model B). The temperature of Al2O3 cannot be constrained by our spectra, which lack long-wavelength data, so we set the same temperature as the carbon in Model A. We favor carbon or Al2O3 over solid Fe dust, because we expect carbon or Al2O3 dust to be present where the Ne and O ejecta lines are dominant: Ne, Mg, and Al are all carbon-burning nucleosynthesis products (Woosley 1995). MgSiO3 and Al2O3 are condensed in the ejecta of Ne, Mg, and Al, which are also carbon-burning products; the O and Al are found in the outer layers of ejecta, which is where Si and carbon dust grains condense. The dust and ejecta compositions seen in E0102 are similar to those of the weak 21m dust layer in Cas A (Rho et al. 2008). To explore the effect of including many minerals, in Model C (Figure 4) we performed fit including MgSiO3, Si, Al2O3, carbon and Mg2SiO4 (the most commonly expected dust compositions from Ne and O ejecta; see e.g.T01, N03). Note that presolar Al2O3 grains from meteorites have been inferred to be among most abundant isotopically-enriched materials ejected by Type II SNe (Clayton et al. 2004). The mass is relatively well constrained by the observations (within 20-40%).
The estimated dust masses within the IRS observed slit are 5.010-3 and 5.510-3 M⊙ for Models A and D, respectively. To estimate the total dust mass, we correct a factor of 2.9, the observed (within the high-sensitivity spectral slit) mass for the fraction of the SNR covered by the IRS slit using a continuum map. The total dust masses for the entire SNR are then 0.015, and 0.014 M⊙ for Models A, and D, respectively. Our estimation exceeds previous estimates (810-4 M⊙; Stanimirovic et al. 2005) by more than an order of magnitude because we have accounted for dust compositions.
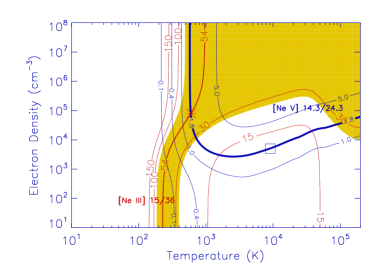
3.2. Ne Line Diagnostics and Shock Models
The ions Ne III and Ne V ions offer pairs of lines in the IR that are suitable diagnostics for the density and temperature in emitting regions. The measured line flux ratios are [Ne V] 14.3/24.3m = 0.11, and [Ne III] 15.6/36m 27.4. To constrain temperatures and densities, we calculate the line intensities and ratios of [Ne V] and [Ne III]. We solve the level population equations for collisional excitation as a matrix using 5 energy levels for Ne V and 3 levels for Ne III. The input atomic data were taken from Griffin & Badnell (2000). The line diagnostics are shown in Figure 4. The electron density and temperature jointly obtained from the ratios of [Ne V] and [Ne III] are 7104 cm-3 and 610 K, when assuming that both Ne III and Ne V gas come from the same gas. Such a high density seems to be characteristic of SN ejecta as observed in optical lines; Chevalier & Kirshner (1978), for example, suggested that the optical [S II] line in Cas A originated from ejecta with a density of 105 cm-3. Blair et al. (2000), however, find considerably lower densities when matching optical lines observed in bright optically emitting knots in E0102.
We run radiative shock model with a velocity range of 50 - 500 km s-3, and use basic parameters quoted in Blair et al. (2000) and Hughes et al. (1998) including the abundances. To calculate the hot, non-radiative region of the shock, we calculate the steady shock profile, integrating the energy equation and including the magnetic field, radiative cooling and non-equilibrium ionization. The cooled photoionized region of the shock requires a code that can calculate the thermal balance at the low temperatures and high densities of that gas and for this purpose we use Cloudy (Ferland 2006). We use the EUV/X-ray flux generated in the hot post-shock region as the input ionizing flux and use the results from Cloudy on the Ne ionization to explore the parameters needed to match the observed [Ne II], [Ne III], and [Ne V] lines. The shock model indicates that the [Ne II] and [Ne III] lines are mainly from photoinization zone with a cold temperature of 400 - 1000 K, while the [Ne V] comes from hotter density region. Following Blair et al. (2000) we calculate a series of shocks with the same ram pressure but shock speeds ranging from 50 - 500 km s-1 such that cm km s. Also following Blair et al. (2000) we assume a magnetic field strength of G. The derived [Ne II] column densities of (2-40)1014 cm-2 are a factor of a few larger than those of [Ne III] and [Ne I], and the total infrared Ne ejecta (from [Ne I] to [Ne V]) are a few 10-3 - 10-2 M⊙. The uncertainty in the Ne mass is due to uncertainties in the pressure and magnetic field in ejecta clumps.
4. N132D
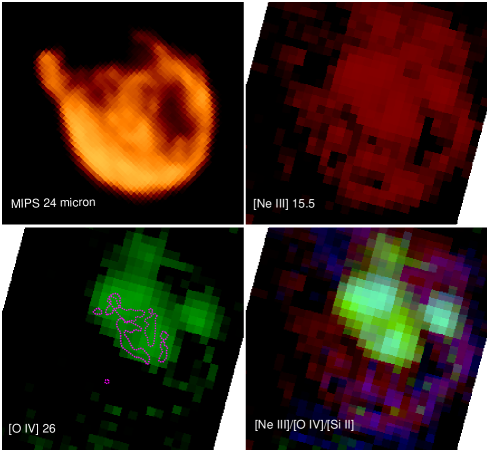
N132D is the youngest SNR known in the Large Magellanic Clouds (LMC) with a diameter of 100′′ (physical size of 25 pc) and an age of 3200 yr. N132D shows two types of emission, ejecta and ISM emission. Optical observations identified O-rich ejecta (like Cas A) emission, an inner ring morphology, which shows elevatered abundances and red and blue-shifted oxygen ejecta with a velocity as high as 4400 km s-1 (Morse, Winkler, & Kirshner 1995). Ejecta are oxygen-rich like in Cas A. The progenitor is suggested to be Type Ib, a Wolf-Rayet (W/O) star with a mass between 30 and 35 M⊙ (Blair et al. 2000). Recently, X-ray observations identified highly ionized oxygen ejecta (Borkowski, Hendrick, & Reynolds 2007). The bright shell is dominated by shocked ISM, particulary bright in the southeastern shell (Blair et al. 2000). Our previous Spitzer observations revealed PAH emission from the dominant component of 15-20 PAH hump which is interpreted as PAHs with a relatively large number of carbon atoms (Tappe, Rho & Reach 2006).
We made follow-up observations (PI: Tappe, PID: 30372) with Spitzer for IRS-LL mapping covering the entire SNR, and IRS staring of SL observations toward 4 positions. Staring mode was 12 cycles of 60 sec exposure for SL. IRS-LL mapping is 2 cycle of 30 s exposure for 10′′ stepsize, resulting in 4 minutes integration per position. The observations took place on 2007 Jun 23.
We present detection of infrared ejecta in N132D as shown in Fig. 5a. The line maps of [Ne III] at 15.5m and [O IV] 26 m, and [Si II] 34.8m maps show strong emission at the central ring, which coincides with the known optical and X-ray ejecta. Fig. 5b shows comparison between N132D and E0102 ejecta spectra; showing remarkably similar lines of Ne and O and the continuum shapes. The lines at the ejecta positions are a few ten times stronger than those in the shocked ISM position, and N132D shows a higher ratio of [Ne II]/[Ne III] than that of E0102, indicating that Ne is less ionized. We performed spectral fitting to the IRS dust continuum as for E0102 (see Fig. 3). The spectrum in Fig. 5c was fit best with the composition of MgSiO3 and solid Si and C, and the derived dust mass for the ejecta emitting within one IRS slit is 8(3)10-3 M⊙. We can also fit the spectrum with a combination of MgSiO3, Si, carbon and/or Al2O3, but the mass could not be well constrained. This will be a lower limit of freshly formed mass, since the rest of the ejecta and fresh dust has been mixed with shocked ISM material.
5. G11.2-0.3
G11.2-0.3 is the remnant of the historic supernova of AD 386 (Reynolds et al. 1994). An X-ray emitting 65 ms pulsar is located at the center of the remnant (Kaspi et al. 2001) with an age of 1600 yr. The pulsar wind nebula shows elongated, hard X-ray structures. The distance is 4.4 kpc, based on H I absorption (Radhakrishnan et al. 1972). Radio observations show bright radio emission, a circular shell of mean diameter of 4.4′, 22 Jy at 1 GHz with an spectral index of 0.6 (Green et al. 1988).
We observed IRS spectra in staring mode toward two positions (, Dec. 26; , 27). The observations took place on 2007 October 4, and the Long Low (LL: 15-40 m) IRS data were taken with 3 cycles of 30 sec exposure time; this yields a total exposure time of 180 sec for the first and second staring positions. The Short Low (SL: 5-15 m) IRS observations were made with 8 cycles of 14 sec exposure time; this yields a total exposure time of 224 sec per sky position. Reference positions were taken with IRS mapping toward nearby positions of 30′ away. We also conducted near-infrared observations using Palomar telescope using narrow-filters of Fe and H2 images. The observations were conducted on 2007 October 22 and October 18.
Fig. 6 shows the IRS spectrum of G11.2-0.3 towards Fe-rich knots, showing strong [Fe II] and Ne lines, and weak Ar, Ni, Si and S lines. Diagnostics of the [Fe II] lines use excitation rate equations which are presented in Rho et al. (2001) and we updated atomic data (Ramsbottom et al. 2007). Figure 6b shows contours of line ratios of 17.9/5.35m and 17.9/26m; the former ratio is mainly sensitive to density and the latter ratio changes depending on both density and temperature. The two ratios imply that Fe emission of G11.2-0.3 has a temperature of 80,000 K, and an electron density of 6000 cm-3; such as high density is a characteristics of ejecta. In comparison, the [Fe II] line implied electron density from the SNR Kes 17 is 100 cm-3 (Hewitt et al. 2009). Fe is a rare element in the circumstellar medium, but it is rich element of nucleosynthetic yields. The continuum of G11.2 shows smooth featureless shape indicates possible Fe dust. Detection of Ni lines also implies that they are ejecta from nucleosynthetic yields.

6. Carbon Monoxide in the Cassiopeia A Supernova Remnant
We report the likely detection of near-infrared 2.29 m first overtone Carbon Monoxide (CO) emission from the young supernova remnant Cassiopeia A (Cas A). The continuum-subtracted CO filter map reveals CO knots within the ejecta-rich reverse shock. We compare the first overtone CO emission with that found in the well-studied supernova, SN 1987A and find 30 times less CO in Cas A. The presence of CO suggests that molecule mixing is small in the SN ejecta and that astrochemical processes and molecule formation may continue at least years after the initial explosion. This section is a summary of a Journal paper (Rho et al. 2009a).
Introduction and Observations Supernovae (SNe) are suggested to be the first molecular factories in the early Universe (Cherchneff & Lilly 2008). Understanding the chemistry within the ejecta, and the abundance and mixing of CO and SiO molecules, is particularly important in studying dust formation processes since this controls how much carbon is available to form amorphous C grains and how much oxygen available beyond that bound in CO and SiO molecules to form MgSiO3 and Mg2SiO4.
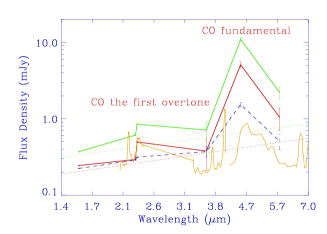
We observed Cas A on 2006, September 3 and 4 with the Wide field InfraRed Camera (WIRC) on the Hale 200 inch (5 m) telescope at Mount Palomar. We took narrow-band images using filters centered on CO(2-0) at 2.294 m, K-band and H-band continuum at 2.270 and 1.570 m, and P at 1.182 m (see Figure 7). The exposure time of CO, K-cont and P is a has a total on-source integration time of 8100 sec for CO, 7290 sec for K-cont and 810 sec for P image.
Results and Discussion Fig. 7a shows a color composite image of Cas A, combining the P line (blue), 2.27 m continuum (green), and CO (2-0) 2.29 m line (red). The 2.27 m continuum consists mostly of non-thermal synchrotron radiation and delineates the shell structure (see Rho et al. 2003). Finally, the CO (2-0) overtone emission traces the dense knots of gas along the shell and interior interface. The molecular emission is evident as red in Figure 7 and more easily seen in the continuum-subtracted CO image, revealing the line emission towards the northern parts of bright rings and an eastern filament of the Minkowski knots in the southeast. The CO emission is highly clumpy and distributed in a collection of knots. The locations where CO emission is detected coincide with the ejecta at the reverse shock (Hwang et al. 2004; Rho et al. 2008). It indicates that the CO gas was formed in the ejecta. We compiled spectral energy distributions (SEDs) of near-infrared H, K-continuum, CO bands and Spitzer IRAC Bands 1, 2 and 3 (3.6 - 5.8 m) for bright knots; Fig. 7 shows three representative SEDs after correcting for the extinction. The SEDs show a sudden jump at 2.294 m toward the CO detection positions, with no such jump toward the NW ejecta position. The SEDs of the CO knots also show a larger IRAC Band 2 (4.5 m) excess than that of the NW ejecta knot.
We estimated the mass of CO in Cas A by comparing the CO flux density in Cas A with that found in the supernova SN 1987A. Fig. 7 compares the CO emission from Cas A and SN 1987A (Meikle et al. 1989). After accounting for the distance differences, the CO (2-0) first overtone flux density of Cas A is a factor of smaller than that of SN1987A on day 255. Assuming the same gaseous conditions as seen in the CO emitting regions in SN1987A (a temperature of 1800-2800 K and a velocity of 2000 km s-1), we estimated the CO mass in Cas A to be . The CO detections in SNe have been within a few years after the initial explosion. Our CO detection suggests that either the CO layer is not macroscopically mixed with ionised helium or that the helium is not ionised. Typical electron density of C- and O-rich regions during formation of CO is shown to be 5108 cm-3 (Gearhart, Wheeler & Swartz 1999). Travaglio et al. (1999) assumed that mixing occurs at the molecular level, prior to dust condensation, while Clayton & Nittler (2004), Deneault, Clayton & Heger (2003) suggest that gases are unlikely to be mixed at the molecular level within a few years. Our CO detection suggests that molecular mixing is small (at least smaller than previously thought) in the SN ejecta and during the development of the reverse shock.
7. Conclusion We present unambiguous evidence of dust formation in young SNRs. The dust map is almost identifical to the ejecta map, showing that dust is formed in the ejecta. Identified dust composition in SNRs include the features of SiO2 [21 and 9 m], MgSiO3 [17 and 9.5 m], Si [15 m], SiC [11.3 m] and the featureless dust of carbon, Al2O3, and Fe. We also show that dust and ejecta compositions are closely correlated. E0102 shows dominant ejecta of Ne and O, while Cas A shows Ar, Si and Fe ejecta in additional to Ne and O. A total mass of freshly formed dust is 0.02- 0.054 M⊙ for Cas A, and 0.015 M⊙ for E0102. G11.2 also shows similar order of dust mass including Fe dust. The dust mass is more than one order higher than previous estimates but slightly lower than theoretical predictions. CO molecule detection from Cas A indicates on-going processes of astro-chemisty.
Acknowledgments.
This work is based on observations made with the Spitzer Space Telescope, which is operated by the Jet Propulsion Laboratory, California Institute of Technology. Support for this work was provided by NASA and through LTSA grant NRA-01-01-LTSA-013 and Spitzer GO awards issued by JPL/Caltech.
References
- Amy & Ball (1993) Amy, S. W., & Ball, L., 1993, ApJ, 411, 761
- Blair et al. (2000) Blair, W. P. et al. 2000, ApJ, 537, 667
- Borkowski, Hendrick, & Reynolds (2007) Borkowski, K. J., Hendrick, S. P., & Reynolds, S. P., 2007, 671L, 45
- Chevalier & Kirshner (1978) Chevalier, R. A. & Kirshner, R. P., 1978, ApJ, 219, 931
- Chiar & Tielen (2007) Chiar, J. E.; Tielens, A. G. G. M., 2007, ApJ, 637, 774
- Clayton et al. (2004) Clayton, D.D. & Nittler, L. R., 2004, ARA&A, 42, 39
- Cherchneff & Lilly (2008) Cherchneff, I. & Lilly, S., 2008, ApJ, 683, L123
- Deneault, Clayton, & Heger (2003) Deneault, Ethan A.-N., Clayton, Donald D., & Heger, A., 2003, ApJ, 594
- Dunne et al. (2003) Dunne, L., Eales, S., Ivison, R., Morgan, H., & Edmunds, M. 2003, Nat, 424, 285
- Dwek et al. (2008) Dwek., E. et al., 2008, ApJ, 676, 1029
- Ferland (2006) Ferland, G., 2006, Hazy, A Brief Introduction to Cloudy (http://www.nublado.org/)
- Gearhart, Wheeler & Swartz (1999) Gearhart, R. A., Wheeler, J. C., Swartz, D. A., 1999, ApJ, 510, 944
- Green et al. (1988) Green, D. A., Gull, S.F., Tan, S.M., Simo, A. J. B., 1988, MNRAS, 231, 735
- Griffin & Badnell (2000) Griffin, D. C. & Badnell, N. R., 2000, Atomic Mol. Opt. Physics, 33, 4389
- Hewitt et al. (2009) Hewitt, J., Rho, J., Andersen, M., & Reach, W. T., 2009, ApJ, in press
- Hilditch, Howarth & Harries (2005) Hilditch, R. W., Howarth, I. D., & Harries, T. J. 2005, MNRAS, 357, 304
- Hofmeister et al. (2003) Hofmeister et al. 2003, MNRAS 345, 16
- Hughes et al. (1998) Hughes,J. P., Hayashi, I. & Koyama,K., 1998, ApJ, 515, 732
- Hughes et al. (2000) Hughes, J.P., Rakowski, C.E. & Decourchelle, 2000, ApJL, 543, 61
- Hwang et al. (2004) Hwang, U., et al., 2004, ApJ, 615, 117
- Jones et al. (1994) Jones A. P., Tielens A. G. M., Hollenbach D.J., McKee C.F., 1994, ApJ, 433, 797
- Kaspi et al. (2001) Kaspi, V. M., Roberts, M. E., Vasisht, G., Gotthelf, E.V., Pivovaroff, M., & Kawai, N., 2001, ApJ, 560, 371
- Kotak et al. (2006) Kotak, R. et al. 2006, ApJ, 651, L117
- Kozasa & Hasegawa (1988) Kozasa, T., & Hasegawa, H. 1988, Icarus, 73, 180
- Krause et al. (2004) Krause, O., et al., 2004, Nature, 432, 596
- Meikle et al. (1989) Meikle, W.P.S., Spyromilio, J., Varani, G.-F., & Allen, D.A., 1989, MNRAS, 238 193
- Messenger et al. (2006) Messenger, S., Sandford, S., & Brownlee, D. 2006, in Meteorites and the Early Solar System II, eds. D. S. Lauretta & H. Y. McSween, Jr. ( U. Arizona Press), 187
- Morgan et al. (2003) Morgan, H. L., Dunne, L., Eales, S. A., Ivison, R. J., & Edmunds, M. G. 2003, ApJ, 597, L33
- Morgan & Edmunds (2003) Morgan, H. L. & Edmunds, M. G. 2003, MNRAS, 343, 427
- Morse, Winkler, & Kirshner (1995) Morse, J. A., Winkler, P. F., & Kirshner, R. P., 1995, ApJ, 109, 2104
- Nomoto et al. (1997) Nomoto, K., Hashimoto, M., Tsujimoto, T., Thielemann, F.-K., Kishimoto, N., Kubo, Yl, Nakasato, N., 1997, Nuclear Physics, 616, 79
- Nozawa et al. (2003) Nozawa, T., Kozasa, T., Umeda, H., Maeda, K., & Nomoto, K. 2003, ApJ, 598, 785 (N03)
- Radhakrishnan et al. (1972) Radhakrishnan, V., Goss, W. M., Murray, J.D, Brooks, J.W, 1972, ApJS, 24, 49
- Ramsbottom et al. (2007) Ramsbottom, C. A., Hudson, C. E., Norrington, P. H., & Scott, M. P. 2007, A&A, 475, 765
- Reynolds et al. (1994) Reynolds, S. P., Lyutikov, M., Blandford, R. D., & Seward, F. D., 1994, MNRAS, 271, L1
- Rho et al. (2008) Rho, J., Kozasa, T., Reach, W. T., Smith, J. D., Rudnick, L., DeLaney, T., Ennis, J. A., & Gomez, H., 2008, ApJ, 673, 271
- Rho et al. (2001) Rho, J., Jarrett, T., Cutri, R., & Reach, W. T. 2001, ApJ, 547, 885
- Rho et al. (2009a) Rho, J., Jarrett, T., H, Reach, W. T., Gomez, H., & Andersen, M., 2008, ApJL, submitted.
- Rho et al. (2009b) Rho, J., Reach, W. T., Tappe, T., Hwang, U., Slavin, J., Kozasa, T., & Dunne, L., 2009, in preparation
- Stanimirovic et al. (2006) Stanimirovic, S. et al., 2005, ApJ, 632,103
- Tappe, Rho & Reach (2006) Tappe, A., Rho, J., Reach, W. T., 2006, 653, 267
- Todini & Ferrara (2001) Todini, P. & Ferrara, A., 2001, MNRAS, 325, 726 (TF)
- Travaglio et al. (1999) Travaglio, C., Gallino, R., Amari, S., Zinner, E., Woosley, S., Lewis, R.S., 1999, ApJ,510, 325
- Wilson & Batrla (2005) Wilson T.L., & Batrla W., 2005, A & A, 430, 561
- Woosley (1995) Woosley, S. E., & Weaver, T. A., 1995, 101, 181
- Young et al. (2006) Young, P. A., et al. 2006 ApJ, 640, 891