An Ultra Compact Dwarf around the Sombrero galaxy (M104): the Nearest Massive UCD
Abstract
We report the discovery of an Ultra Compact Dwarf (UCD) associated with the Sombrero galaxy (M104). This is the closest massive UCD known and the first spectroscopically verified massive UCD which is located in a low density environment.
The object, we name SUCD1, was identified in HST/ACS imaging and confirmed to be associated with the Sombrero galaxy by its recession velocity obtained from Keck spectra. The light profile is well fitted by a Wilson model. We measure a half light size of pc, an absolute magnitude of = mag ( = mag) and an internal velocity dispersion of . Such values are typical of UCDs. From Lick spectral indices we measure a luminosity-weighted central age of Gyrs, of dex and of dex. The lack of colour gradients suggests these values are representative of the entire UCD. The derived stellar and virial masses are the same, within errors, at 3.3 107 M⊙. Thus we find no strong evidence for dark matter or the need to invoke a non-standard IMF.
We also report arguably the first X-ray detection of a bona fide UCD, which we attribute to the presence of Low-Mass X-ray Binaries (LMXBs). The X-ray luminosity of is consistent with the values observed for GCs of the same metallicity. Overall we find SUCD1 has properties similar to other known UCDs and massive GCs.
keywords:
1 Introduction
Ultra Compact Dwarfs (UCDs) are compact stellar systems that are more luminous than typical globular clusters (GCs). They were discovered in the cores of galaxy clusters (Hilker et al. 1999; Drinkwater et al. 2000). They have properties intermediate between globular clusters (GCs) and dwarf ellipticals (dEs) and may represent a transitional population between the two (Haşegan et al 2005). The four main hypotheses for UCD formation are: 1) extra luminous GCs (Mieske et al. 2002) 2) the products of the merger of super star clusters (Fellhauer & Kroupa 2002); 3) the stripped nuclei of dwarf ellipticals (Bekki et al. 2003) and 4) primordial dwarf galaxies (Drinkwater et al. 2004). The recent work of Forbes et al. (2008) and references therein indicate that UCDs share many of the properties of massive star clusters.
As the UCDs identified so far reside mainly in clusters, the cluster environment is thought to be important in UCD formation. Clearly the discovery of UCDs in isolated environments or associated with individual galaxies will provide challenges to any hypothesis that requires a cluster environment. Evstigneeva et al. (2007a) found 1 definite and 4 possible UCD candidates in a photometric search in 6 galaxy groups. All of these are intergalactic and not associated with any particular galaxy. Mieske, West & Mendes de Oliveira (2007) searched for UCDs photometrically in the NGC 1023 group ( = 11 Mpc) yielding 21 candidates, which have not been spectroscopically confirmed. Perhaps the most promising candidate so far has been the brightest globular cluster HCH99-18 (Rejkuba et al. 2007) of NGC 5128 (Cen A; = 3.8 Mpc), which has a mass of (Mieske et al. 2008). Here we present HST/ACS and Keck/DEIMOS and Keck/LRIS observations to establish the association between a massive UCD with the Sombrero galaxy, which is located in a low density environment. We adopt a Sombrero distance of 9.0 Mpc (Spitler et al. 2006); parameters from the literature have been automatically converted to this system.
2 UCD identification and kinematic parameters
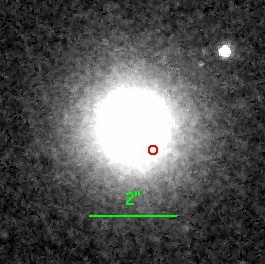
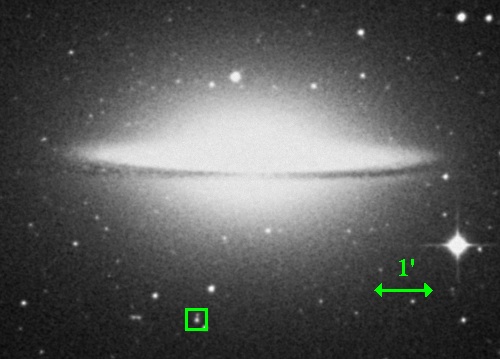
A mosaic of HST/ACS images of the Sombrero galaxy in the F435W (B), F555W (V) and F625W (R) bands were taken as part of the Hubble Heritage program. Spitler et al. (2006) have presented photometry of the Sombrero GC system based on this data. We identified a candidate UCD based on its angular size (FWHM 0.15"), apparent magnitude () and colour (). It is magnitudes brighter than the brightest Sombrero GCs in the V band (Spitler et al. 2006). An image of the UCD, as well as its location 3′ (7.9 kpc) South of the Sombrero, is shown in Fig. 1. The observed properties of the UCD, which we name SUCD1, are summarised in Table 1.
A spectrum of SUCD1 was taken in 2006 April using the DEIMOS instrument on the Keck telescope, with 12037 seconds exposure, GG400 order blocking filter, 0.8" slit width and the 900 lines/mm grating. The spectral range is 5500–7250 Å and the resolution is or in sigma. The spectrum is plotted in Fig. 2. A lower resolution spectrum ( or 74 in sigma) was taken using with the blue arm of the LRIS instrument in 2008 April. A total of 1800 seconds exposure was taken, with 1.0" slit width and the 600/4000 grism. The spectral range is 3600–5600 Å.
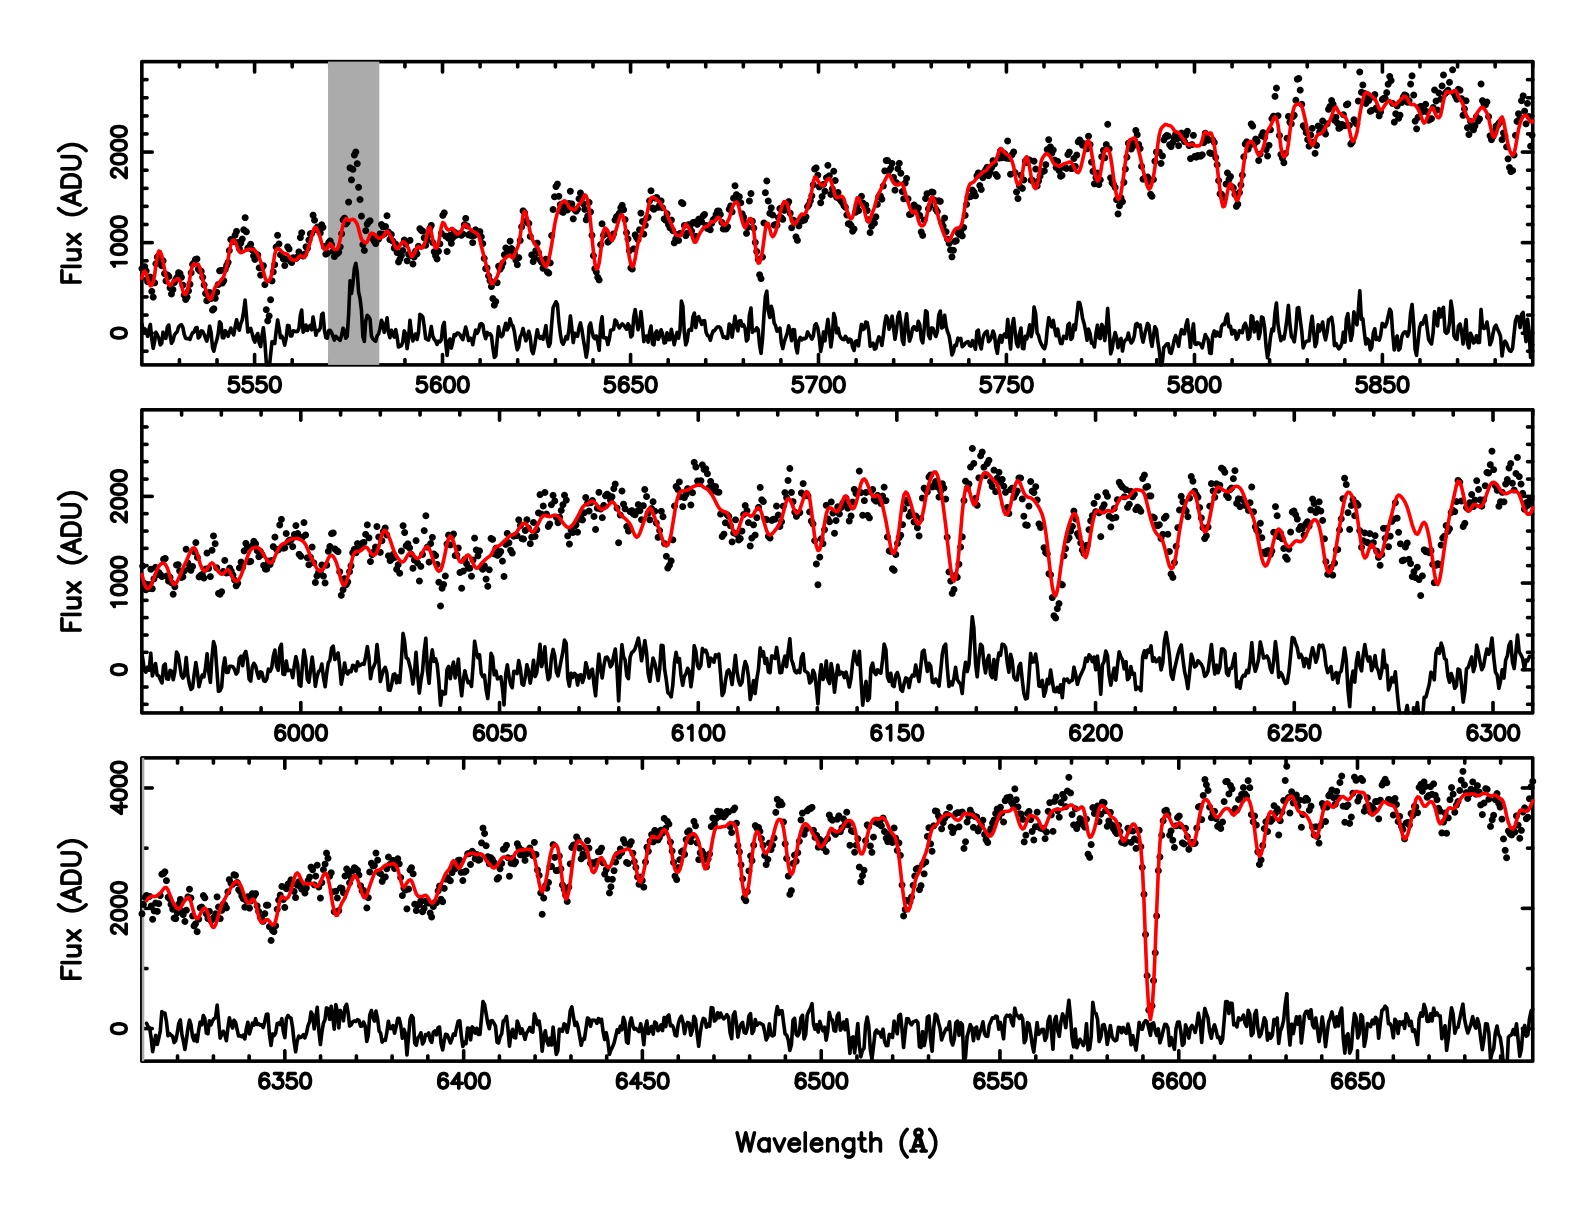
The recession velocity and velocity dispersion were measured from the DEIMOS spectrum using a direct fitting program pixfitgau, described in van der Marel & Franx (1993). The region containing the NaI line at 5890 Å was excluded from the fits since it is affected by interstellar absorption. Four template star spectra taken with DEIMOS were available for the modelling. We find that no single star gives the best fit for the entire spectrum, and that the best-fit template changes with wavelength. We therefore performed the spectral fitting separately on 3 separate ranges corresponding to 5520–5890 Å, 5960–6310 Å, 6310–6700 Å. For each region, the best fitting parameters are taken for the broadened template which gives the least between the model and the data. We find that this method works well and the fits are displayed in Fig. 2. The final parameters are taken as the average obtained from the 3 regions, with the standard deviation taken as the error.
The measured heliocentric recession velocity of confirms SUCD1’s association with Sombrero, since the recession velocity of the latter is (Smith et al. 2000). Bridges et al. (2007) found a dispersion of in the GC population within 5′ radius. Given that SUCD1 is from the Sombrero, its relative velocity of is slightly larger than one standard deviation of the GC velocity distribution.
The measured internal velocity dispersion is , similar to other UCDs (Drinkwater et al 2003; Haşegan et al. 2005; Evstigneeva et al. 2007b; Hilker et al 2007). This is backed up by our Monte Carlo simulations which show that velocity dispersions as low as 4 can be measured without significant bias (see also Bedregal 2006). We also measured the recession velocity from the LRIS spectrum with a cross-correlation program fxcor (Tonry & Davis 1979), and obtained . The agreement between instruments and techniques is reassuring.
| Sombrero UCD (SUCD1) | Value |
|---|---|
| (J2000) | 12 40 03.13 |
| (J2000) | -11 40 04.3 |
| Distanceb | Mpc |
| Projected scaleb | 44 pc arcsec-1 |
| g | mag |
| g | mag |
| g | mag |
| g | mag |
| e | 15.6 mag |
| e | 14.9 mag |
| e | 14.7 mag |
| mc | 14.2 mag |
| mag | |
| mag | |
| f | |
| d | 0.22 mag |
Notes: a from ACS image calibrated using 2MASS catalogue; b Spitler et al. (2006); c Spitler et al. (2008); d Schlegel et al. (1998); e 2MASS; f Di Stefano et al. (2003); g Extinction corrected.
3 Stellar populations
The wavelength range of 4300–6300 Å covered by the LRIS spectrum includes 16 Lick/IDS indices (Worthey et al. 1994). The indices were used to derive luminosity-weighted log (), iron abundance and -abundance ratio using the method described in Proctor & Sansom (2002). The extraction aperture is pc. Thomas et al. (2003) SSP models and Trager et al. (1998) index definitions have been adopted. The measured log (), and are dex (12.6 Gyrs), dex and dex respectively. These are consistent with the values gleaned from photometric colour-colour analysis (Spitler et al. 2008). The is comparable to those of very metal-rich GCs (Beasley et al. 2008; Proctor et al. 2008; Norris et al. 2008). It is generally consistent with UCDs of similar mass or luminosity (e.g. Evstigneeva et al. 2007b; Chilingarian & Mamon 2008; Dabringhausen, Hilker & Kroupa 2008, Mieske et al. 2008). It is higher than dE nuclei which have dex in the Virgo cluster (Geha et al. 2003), or dex in the Fornax cluster (Mieske et al. 2006). SUCD1’s age is comparable to those of very metal-rich GCs and some Virgo UCDs, but is higher than the average age of 5 3 Gyr for Virgo dE nuclei.
4 Photometric properties
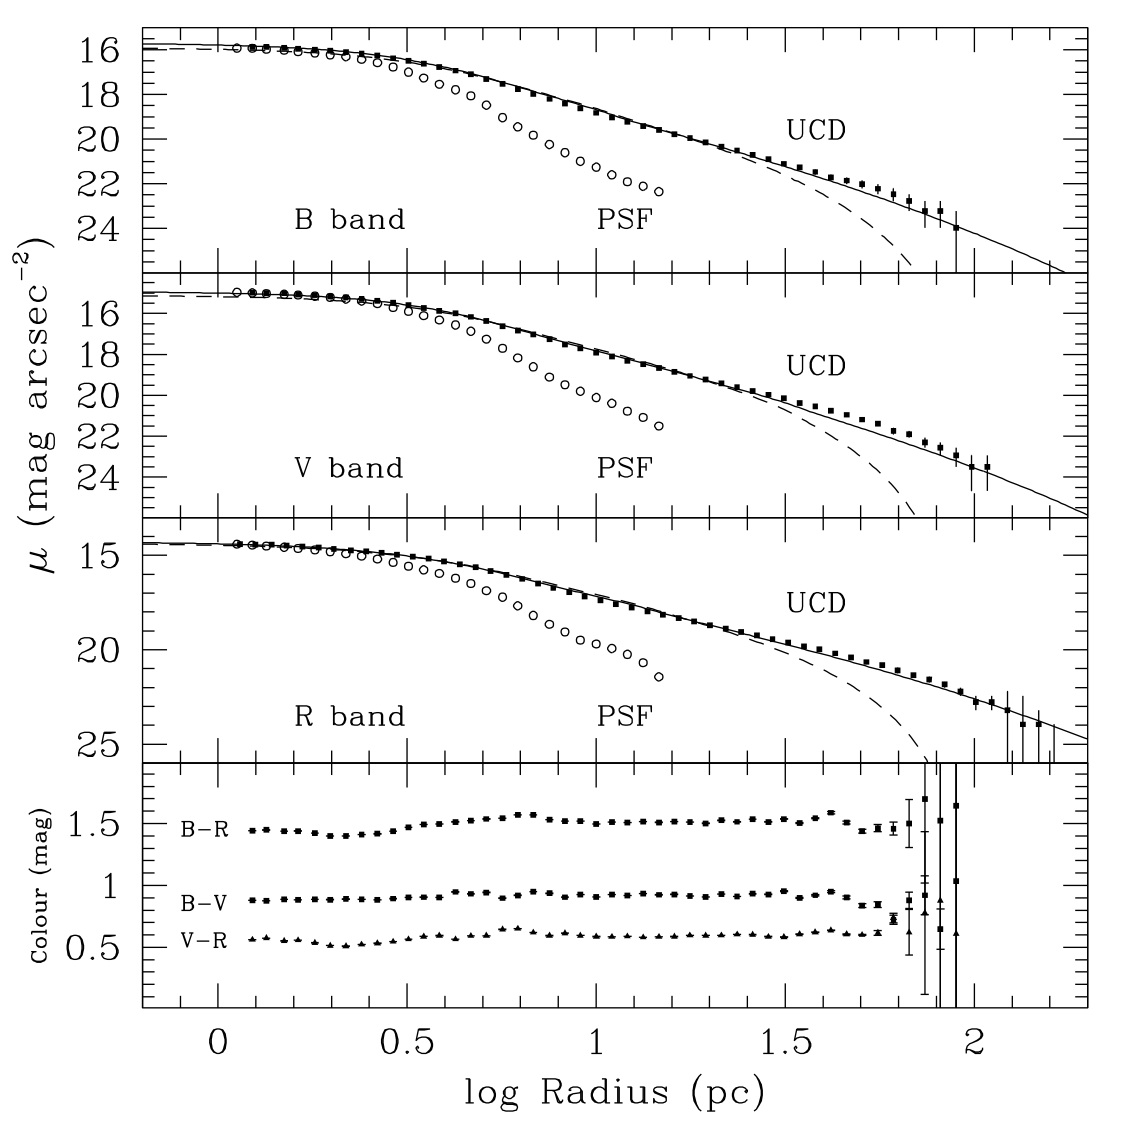
We have also carried out profile fitting using the equilibrium dynamical models of King (1966) and Wilson (1975) in the form described by McLaughlin & van der Marel (2005), convolved with the PSF in each case. STSDAS/ELLIPSE was used to measure the surface brightness of SUCD1 out to large radii, and the two nearest moderately bright stars were used to define the PSF in each of B, V, R bands. The observed profiles are shown in Figure 3. In all three cases SUCD1 was found to be quite round () and so the assumption of a one-dimensional circularly symmetric profile for the convolved fits is reasonable. The technique is described in McLaughlin et al. (2008).
The best-fitting Wilson-type models are in every case far superior to the King-type models. The reasons for this are well described in McLaughlin & van der Marel (2005) and McLaughlin et al. (2008), but are due essentially to the different assumption the Wilson model makes to treat the stars near the escape energy, leading to a larger envelope and larger formal tidal radius. The solutions from the three filters are entirely self-consistent, giving Wilson parameters of central potential , concentration , and scale radius pc. The equivalent projected half-light radius (of the intrinsic profile after deconvolution) found from direct integration of the intrinsic surface brightness curve is pc. We do not find any substructure or tidal tails in the residual image.
SUCD1’s colour profiles are also plotted in Fig. 3. The stellar population analysis above predicts 1.61, 1.01 and 0.69 for , and respectively. The measured colours in this work agree with the predictions to within 0.1 mag. The lack of colour gradients is largely consistent with the findings for other UCDs (Evstigneeva et al. 2008), and suggests that the stellar population is largely uniform out to 50 pc, i.e. SUCD1 is globally old with slightly subsolar metallicities and near solar element ratio.
5 Mass and mass-to-light ratio
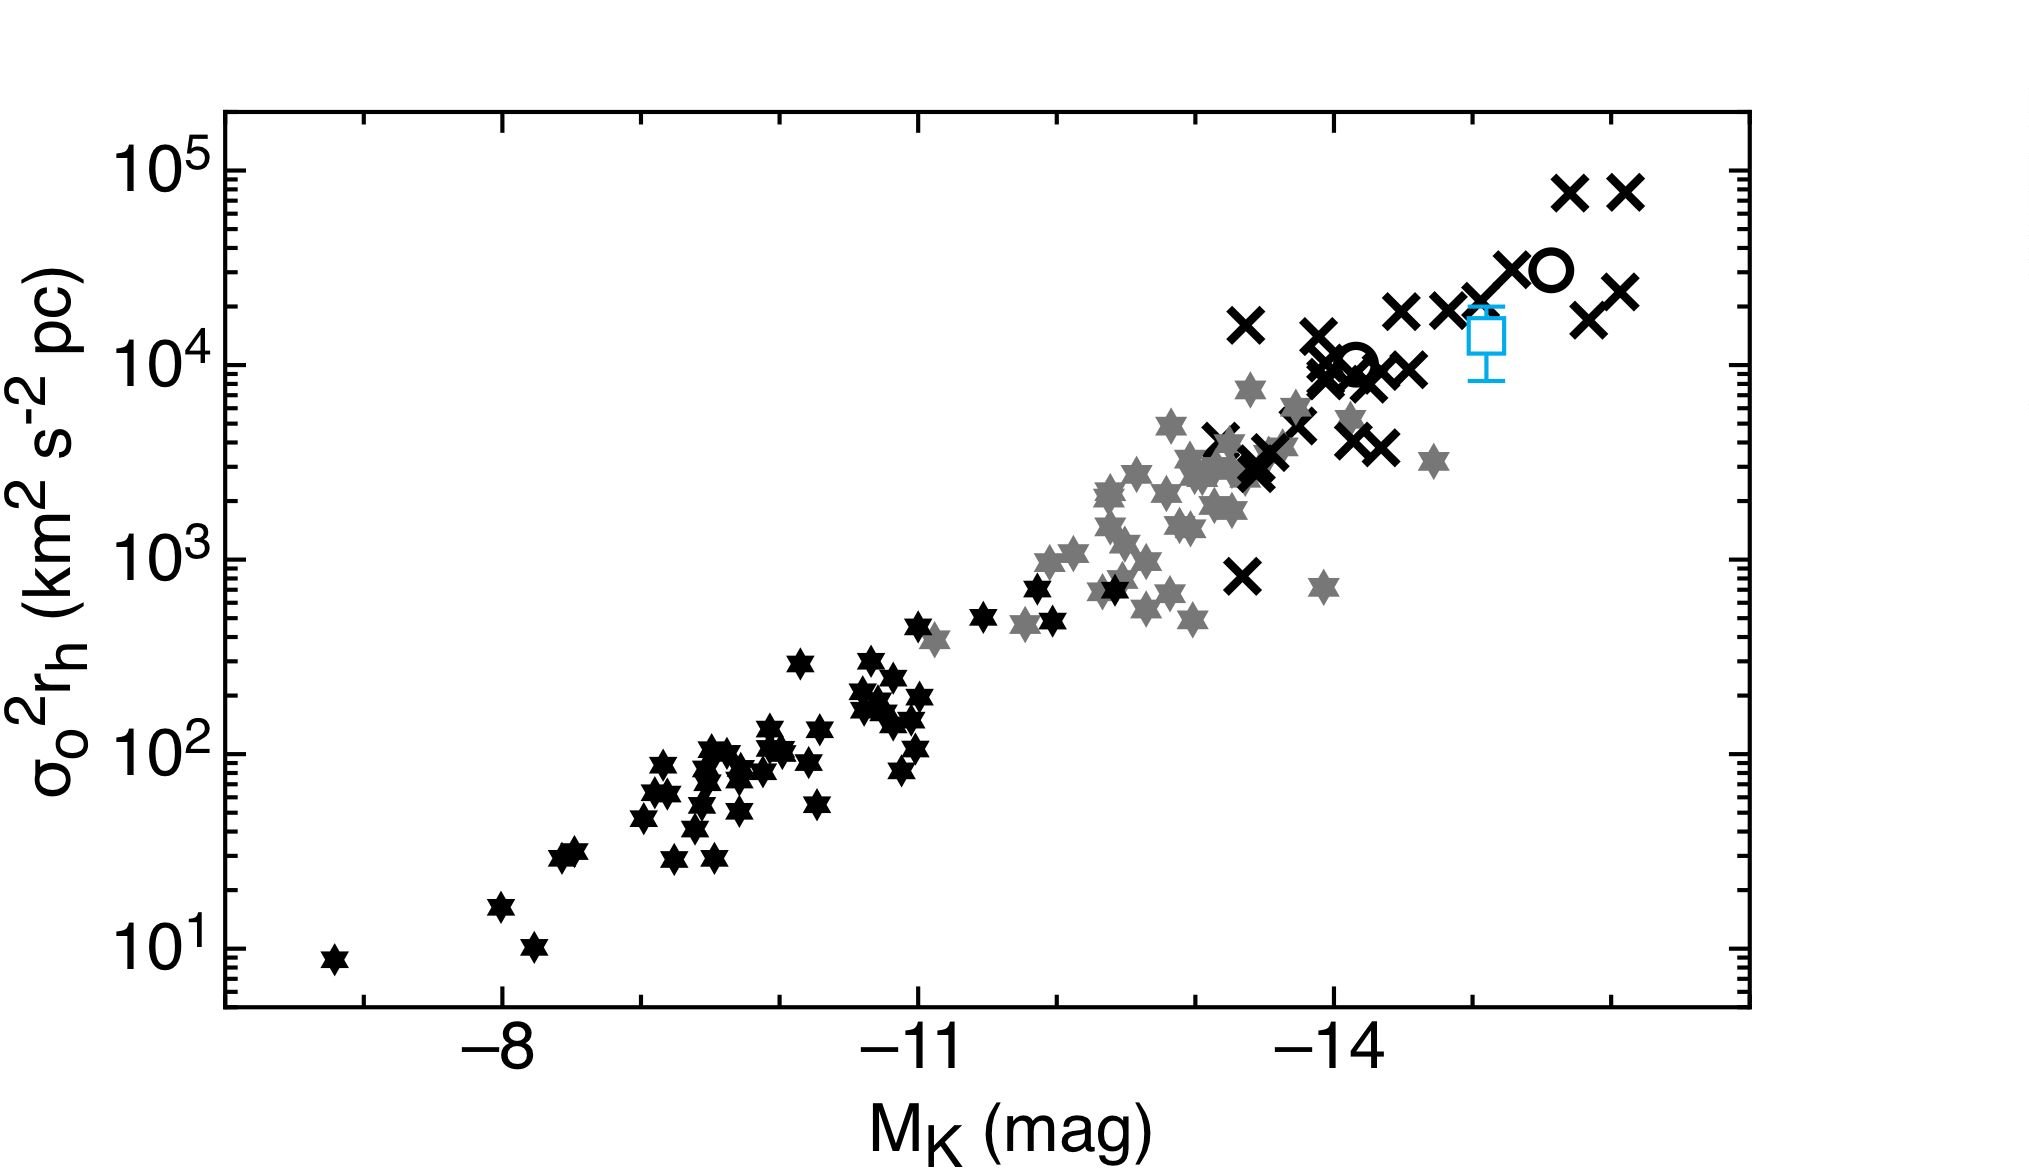
To convert the measured to , the central value, we use the conversion factor calculated by Hilker et al. (2007) who modelled 5 Fornax UCDs. What is important in this conversion is ratio of the slit width to . By coincidence this quantity is the same for SUCD1 as for the UCDs in the Hilker et al. sample. Thus we calculate . In Fig. 4 we show the location of SUCD1 with respect to other UCDs, dE,N nuclei, GCs and massive star clusters in terms of their (a measure of dynamical mass) versus their K-band magnitude (a good proxy for stellar mass). SUCD1 falls in the location of other UCDs and the continuation of the massive GC trend.
Assuming a Kroupa IMF, the stellar mass calculated from the K-band luminosity (using from the stellar population analysis), is , while that from the V-band (using ) is . The virial mass , where G is the universal gravitational constant, and is the virial coefficient (for more details see Forbes et al. 2008). Using the calculated above, and pc, we calculate . This agrees with those derived from the stellar populations. The resulting dynamical is similar to those of UCDs (Mieske et al. 2008) and massive GCs (McLaughlin et al. 2008), and follows the trend of increasing with mass. These results suggest that SUCD1 is not heavily dark matter dominated (e.g. Dabringhausen et al. 2008; Forbes et al. 2008), nor does it require an exotic IMF (Mieske & Kroupa 2008; Murray 2008), and it has not been strongly influenced by the host galaxy (Fellhauer & Kroupa 2006).
6 X-ray detection
SUCD1 is detected in X-rays with Chandra by di Stefano et al. (2003) and Li, Wang & Hameed (2007), with IDs X95 and XA-143 respectively. di Stefano et al. identified X-ray counterparts using a list of Sombrero GCs known at that time, and listed SUCD1 as a star with (0.3-0.7 keV) of . The X-ray position is 0.7"(31 pc) from the centre of SUCD1. The two nearest stars are 2.7"and 5.4"from the X-ray position and can be ruled out as the source of the X-ray emission at the 9 level.
SUCD1 is arguably the first bona fide UCD detected in the X-ray. Hempel et al. (2007) found an optically bright X-ray source in the proximity of the field galaxy NGC 3585 (ID 18), with and = 3.79 mag. Lacking spectroscopic confirmation, if indeed it is at the distance of NGC 3585, this object will have mag, similar to SUCD1. Mieske et al. (2008) identified X-ray counterparts of Fornax compact stellar systems up to mag, the arbitrary ‘boundary’ between GCs and UCDs (Haşegan et al. 2005; Mieske et al. 2006). With mag ( mag), SUCD1 is firmly in the UCD regime. Its is similar to those of Low-Mass X-ray Binaries (LMXBs) in GCs (Kundu, Maccarone & Zepf 2007; Mieske et al. 2008), and about 1.5 dex lower than that of the most X-ray luminous GCs. This is consistent with the finding that, in general, X-ray luminous GCs tend to be massive, but the brightest X-ray source is not necessarily the most massive GC. The preference of LMXBs to be located in metal-rich GCs (Jordán et al. 2004; Kundu, Maccarone & Zepf 2007; Mieske et al. 2008; Woodley et al. 2008) is thought to be due to an increased number of neutron stars per unit mass.
7 Discussion and conclusions
The observations reported here establish SUCD1 as a bona fide UCD ( = , = 14.7 pc) associated with the Sombrero galaxy. Sombrero is in a low-density environment, and is listed as either an isolated galaxy or the dominant member of a small group in the literature, depending on the group-finding algorithm adopted. The close association of SUCD1 with a relatively isolated galaxy suggests that some UCDs are formed in low-density environments.
However our findings do not favor a recently stripped dwarf origin. Although simulations of a dwarf galaxy being tidally stripped as it orbits the Milky Way are able to produce objects which look like Cen (Bekki & Freeman 2003), the failure to find any tidal extension or tails rules out that SUCD1 is the nucleus of a recently stripped dwarf. If SUCD1 is the nucleus of a stripped dwarf, the stripping must have happened very early on. SUCD1’s stellar populations are also somewhat incompatible with those of currently studied dE nuclei which tend to be younger on average.
Our findings favor a massive metal-rich GC scenario. SUCD1’s velocity and location with respect to Sombrero are consistent with it being part of its GC system. The , old age and near-solar metallicity of SUCD1 are similar to very metal-rich GCs. SUCD1’s photometric properties are also consistent with the average properties of the Sombrero metal-rich GC subpopulation (Spitler et al. 2008). The first discovery of X-ray emission in a spectroscopically confirmed UCD and its agreement with LMXBs in GCs also supports the GC association, although it is possible that LMXBs also exist in dE nuclei. Our finding suggests that SUCD1 is largely consistent with a purely stellar population and is not heavily dark mater dominated, in agreement with the finding for some UCDs by other works (Hilker et al. 2007; Dabringhausen, Hilker & Kroupa 2008; Forbes et al. 2008). We note that SUCD1 is 1.2 mag brighter in the V band than the next brightest Sombrero GC, which may argue that SUCD1 is not part of the GC system. However it is unclear whether this is due to low number statistics or incompleteness due to the limited ACS FOV coverage.
High-resolution cosmological simulations predict that, if GCs were formed in the cores of supergiant molecular clouds at high-redshifts, then the maximum GC mass should correlate with the mass of its host galaxy (Kravtsov & Gnedin 2005). To explore the possibility that SUCD1 is just a very massive GC formed during the formation of the Sombrero galaxy, we use equation 8 of Kravtsov & Gnedin (2005) to calculate the mass of the most massive star cluster to be , which compares favourably with SUCD1’s mass. A Sombrero mass of was adopted (Bridges et al. 2007). It is unclear, however, whether this model is applicable to SUCD1, since it predicts low metallicities. Clearly further simulation work is required.
Recently, Bailin & Harris (2008) consider the self enrichment of globular clusters at high-redshifts. They find that metal retainment becomes efficient at high masses ( ), and predict that the red and blue GC sequences should converge there. With a 0.4 star formation efficiency, their model is able to generate a of dex for a GC, consistent with that of SUCD1 and other UCDs (Dabringhausen et al. 2008) of that mass.
The similarity of SUCD1’s properties to those of cluster UCDs raises the intriguing possibility that some cluster UCDs could have been formed first in low-density environs together with the GC population, and were then incorporated into the cluster later. It may be possible that UCDs form from multiple routes, as hinted by the different stellar populations of the Virgo and Fornax UCDs found by others, and individual circumstances need to be examined to study the relative importance of different channels. Clearly the discovery of more UCDs associated with isolated galaxies will help to shed light on their formation.
8 Acknowledgements
GKTH and DAF thank the Australian Research Council for financial support. This work is supported by NSF grant AST 05-07729. We thank Warrick Couch, Alister Graham and Paul Lasky and for useful comments.
References
- [] Bailin J., Harris W.E., 2008, ApJ, submitted
- [\citeauthoryearBeasley et al.2008] Beasley M. A., Bridges T., Peng E., Harris W. E., Harris G. L. H., Forbes D. A., Mackie G., 2008, MNRAS, 386, 1443
- [\citeauthoryearBedregal et al.2006] Bedregal A. G., Aragón-Salamanca A., Merrifield M. R., Milvang-Jensen B., 2006, MNRAS, 371, 1912
- [\citeauthoryearBekki et al.2003] Bekki K., Couch W. J., Drinkwater M. J., Shioya Y., 2003, MNRAS, 344, 399
- [Bekki & Freeman(2003)] Bekki, K., Freeman, K. C. 2003, MNRAS, 346, L11
- [\citeauthoryearBridges et al.2007] Bridges T. J., Rhode K. L., Zepf S. E., Freeman K. C., 2007, ApJ, 658, 980
- [\citeauthoryearChilingarian & Mamon2008] Chilingarian I. V., Mamon G. A., 2008, MNRAS, 385, L83
- [Dabringhausen et al.(2008)] Dabringhausen J., Hilker M., Kroupa P., 2008, MNRAS, 386, 864
- [\citeauthoryearDi Stefano et al.2003] Di Stefano R., Kong A. K. H., VanDalfsen M. L., Harris W. E., Murray S. S., Delain K. M., 2003, ApJ, 599, 1067
- [\citeauthoryearDrinkwater et al.2000] Drinkwater M. J., Jones J. B., Gregg M. D., Phillipps S., 2000, PASA, 17, 227
- [\citeauthoryearDrinkwater et al.2003] Drinkwater M. J., Gregg M. D., Hilker M., Bekki K., Couch W. J., Ferguson H. C., Jones J. B., Phillipps S., 2003, Nature, 423, 519
- [\citeauthoryearDrinkwater et al.2004] Drinkwater M. J., Gregg M. D., Couch W. J., Ferguson H. C., Hilker M., Jones J. B., Karick A., Phillipps S., 2004, PASA, 21, 375
- [\citeauthoryearEvstigneeva et al.2007] Evstigneeva E. A., Drinkwater M. J., Jurek R., Firth P., Jones J. B., Gregg M. D., Phillipps S., 2007a, MNRAS, 378, 1036
- [\citeauthoryearEvstigneeva et al.2007] Evstigneeva E. A., Gregg M. D., Drinkwater M. J., Hilker M., 2007b, AJ, 133, 1722
- [Evstigneeva et al.(2008)] Evstigneeva, E. A., et al. 2008, AJ, 136, 461
- [\citeauthoryearFellhauer & Kroupa2002] Fellhauer M., Kroupa P., 2002, MNRAS, 330, 642
- [\citeauthoryearFellhauer & Kroupa2006] Fellhauer M., Kroupa P., 2006, MNRAS, 367, 1577
- [Forbes et al.(2008)] Forbes, D. A., Lasky, P., Graham, A. W., Spitler, L. 2008, MNRAS, 993
- [Geha et al.(2003)] Geha, M., Guhathakurta, P., van der Marel, R. P. 2003, AJ, 126, 1794
- [\citeauthoryearHaşegan et al.2005] Haşegan M., et al., 2005, ApJ, 627, 203
- [\citeauthoryearHempel et al.2007] Hempel M., Zepf S., Kundu A., Geisler D., Maccarone T. J., 2007, ApJ, 661, 768
- [\citeauthoryearHilker et al.1999] Hilker M., Infante L., Vieira G., Kissler-Patig M., Richtler T., 1999, A&AS, 134, 75
- [\citeauthoryearHilker et al.2007] Hilker M., Baumgardt H., Infante L., Drinkwater M., Evstigneeva E., Gregg M., 2007, A&A, 463, 119
- [\citeauthoryearKing1966] King I. R., 1966, AJ, 71, 64
- [Kravtsov & Gnedin(2005)] Kravtsov, A. V., Gnedin, O. Y. 2005, ApJ, 623, 650
- [Kundu et al.(2007)] Kundu, A., Maccarone, T. J., Zepf, S. E. 2007, ApJ, 662, 525
- [Li et al.(2007)] Li, Z., Wang, Q. D., Hameed, S. 2007, MNRAS, 376, 960
- [McLaughlin & van der Marel(2005)] McLaughlin, D. E., van der Marel, R. P. 2005, ApJS, 161, 304
- [McLaughlin et al.(2008)] McLaughlin, D. E., Barmby, P., Harris, W. E., Forbes, D. A., Harris, G. L. H. 2008, MNRAS, 384, 563
- [\citeauthoryearMieske, Hilker, & Infante2002] Mieske S., Hilker M., Infante L., 2002, A&A, 383, 823
- [Mieske et al.(2006)] Mieske S., Hilker M., Infante L., Jordán A., 2006, AJ, 131, 2442
- [Mieske et al.(2007)] Mieske, S., West, M. J., de Oliveira, C. M. 2007, Groups of Galaxies in the Nearby Universe, 103
- [Mieske & Kroupa(2008)] Mieske, S., Kroupa, P. 2008, ApJ, 677, 276
- [\citeauthoryearMieske et al.2008] Mieske S., Hilker M., Bomans D. J., Rey S.-C., Kim S., Yoon S.-J., Chung C., 2008, A&A, 489, 1023
- [\citeauthoryearMieske et al.2008] Mieske S., et al., 2008, A&A, 487, 921
- [Murray (2008)] Murray, N., arXiv:0809.4320v1
- [Norris et al.(2008)] Norris, M. A., et al. 2008, MNRAS, 385, 40
- [\citeauthoryearProctor & Sansom2002] Proctor R. N., Sansom A. E., 2002, MNRAS, 333, 517
- [\citeauthoryearProctor et al.2008] Proctor R. N., Forbes D. A., Brodie J. P., Strader J., 2008, MNRAS, 385, 1709
- [\citeauthoryearSchlegel, Finkbeiner, & Davis1998] Schlegel D. J., Finkbeiner D. P., Davis M., 1998, ApJ, 500, 525
- [\citeauthoryearSmith et al.2000] Smith R. J., Lucey J. R., Hudson M. J., Schlegel D. J., Davies R. L., 2000, MNRAS, 313, 469
- [\citeauthoryearSpitler et al.2006] Spitler L. R., Larsen S. S., Strader J., Brodie J. P., Forbes D. A., Beasley M. A., 2006, AJ, 132, 1593
- [\citeauthoryearSpitler, Forbes, & Beasley2008] Spitler L. R., Forbes D. A., Beasley M. A., 2008, MNRAS, 928
- [\citeauthoryearThomas, Maraston, & Bender2003] Thomas D., Maraston C., Bender R., 2003, MNRAS, 339, 897
- [\citeauthoryearTonry & Davis1979] Tonry J., Davis M., 1979, AJ, 84, 1511
- [\citeauthoryearTrager et al.1998] Trager S. C., Worthey G., Faber S. M., Burstein D., Gonzalez J. J., 1998, ApJS, 116, 1
- [\citeauthoryearvan der Marel & Franx1993] van der Marel R. P., Franx M., 1993, ApJ, 407, 525
- [\citeauthoryearWilson1975] Wilson C. P., 1975, AJ, 80, 175
- [\citeauthoryearWoodley et al.2008] Woodley K. A., et al., 2008, ApJ, 682, 199
- [\citeauthoryearWorthey1994] Worthey G., 1994, ApJS, 95, 107