A complete 12CO 2–1 map of M51 with HERA:
II. Total gas surface densities and gravitational stability
Abstract
Context. To date the onset of large-scale star formation in galaxies and its link to gravitational stability of the galactic disk have not been fully understood. The nearby face-on spiral galaxy M51 is an ideal target for studying this subject.
Aims. This paper combines CO, dust, H i, and stellar maps of M51 and its companion galaxy to study the H2/H i transition, the gas-to-dust ratios, and the stability of the disk against gravitational collapse.
Methods. We combine maps of the molecular gas using 12CO 2–1 map HERA/IRAM-30m data and H i VLA data to study the total gas surface density and the phase transition of atomic to molecular gas. The total gas surface density is compared to the dust surface density from 850 m SCUBA data. Taking into account the velocity dispersions of the molecular and atomic gas, and the stellar surface densities derived from the 2MASS -band survey, we derive the total Toomre Q parameter of the disk.
Results. The gas surface density in the spiral arms is higher compared to that of the interarm regions. The ratio of molecular to atomic surface density shows a nearly power-law dependence on the hydrostatic pressure . The distribution in M51 shows an underlying exponential distribution with a scale length of h kpc representing 55% of the total gas mass, comparable to the properties of the exponential dust disk. In contrast to the velocity widths observed in H i, the CO velocity dispersion shows enhanced line widths in the spiral arms compared to the interarm regions. The contribution of the stellar component in the Toomre Q-parameter analysis is significant and lowers the combined Q-parameter Qtot by up to 70% towards the threshold for gravitational instability. The value of Qtot varies from 1.5-3 in radial averages. A map of Qtot shows values around 1 on the spiral arms indicating self-regulation at play.
1 Introduction
To understand the evolution and appearance of galaxies it is crucial to study the interplay between stars and the interstellar gas and dust. Stars are made within the dense and cold interiors of molecular clouds. It is generally believed that molecular clouds form from the densest regions of more widely distributed, diffuse atomic clouds. During their lifetimes, stars seed the gas with heavy elements, energy, and momentum, all of which strongly affects their parental environment, the subsequent formation of new stars, and their host galaxy. The photo-destruction of molecular clouds leads to their dispersal and the formation of diffuse atomic clouds, thereby recycling the material. The processes governing the phase transition from the cold neutral medium to dense, molecular gas, and back again, are however still unclear (Rosolowsky et al. 2007; Knapen et al. 2006; Heitsch et al. 2008). Studies combining maps of CO, the traditional tracer of molecular gas, H i, and the cold dust will form the basis for any understanding of their interrelation. The spatial distribution of the various galactic components is best studied in nearby face-on galaxies, like M51, which lies at a distance of 8.4 Mpc (Feldmeier et al. 1997).
Two empirical laws describe star formation in galaxies. First, stars are observed to only form efficiently above a critical gas surface density that appears to be determined by the Toomre (Toomre 1964) criterion for gravitational stability. This star formation threshold has been observed in many galaxies (e.g. Martin & Kennicutt 2001). Note, however the exceptions discussed e.g. by Wong & Blitz (2002). Second, a tight relation has been found between the star formation rate and the surface density of the total gas, i.e. the molecular and atomic gas, the Schmidt law. In this paper, we will focus on the Toomre criterion.
In its original version it considers a dynamical stability analysis of a thin, gaseous, differentially rotating, single-component disk against axisymmetric gravitational perturbations. Observational studies of the Toomre threshold have usually assumed a constant velocity dispersion of the gas, while Schaye (2004) questions this assumption, arguing that the drop of velocity dispersion associated with the transition from the warm to a cold phase of the interstellar medium causes the disk to become gravitationally unstable. In addition, recent studies have shown that the stellar component contributes significantly to the gravitational stability and cannot be neglected (Boissier et al. 2003; Yang et al. 2007).
In Schuster et al. (2007, hereafter Paper I), we combined new CO 2–1 data of M51 obtained at the IRAM-30m telescope using HERA, with H i, and radio continuum data from the literature to discuss radial profiles of the molecular and atomic gas mass surface densities and star formation rates, averaged over azimuth as a function of radius in the disk of M51. In the following, we will simply speak of radial averages.
In the present paper, we combine the CO 2–1 data with H i VLA data from the THINGS survey (Walter et al. 2005, 2008), 850 m SCUBA dust continuum data (Meijerink et al. 2005), and a -Band 2MASS image. We use the CO and H i data to derive maps of the mass surface densities of the molecular and atomic gas, and maps of their velocity dispersions. Maps of the total gas and of the ratio of molecular to atomic gas are then discussed. We separate the total gas mass surface density map into an underlying exponential disk and the spiral arm structure. The results are then compared with the dusty exponential disk found by Meijerink et al. (2005) in their SCUBA map of M51. This allows us to study the variation of the gas-to-dust ratios in the disk and in the arms.
In preparation for the Toomre analysis, we discuss the velocity dispersions of the molecular and atomic gas. Combining the data of the molecular and atomic gas with the map of stellar mass surface density derived from the 2MASS data, we then present the radial average and a map of the total Toomre Q parameter describing the gravitational stability of the disk.
2 Observations and Data
Observations of the 12CO 2–1 emission from M51 were conducted with the IRAM 30m telescope in February 2005. The half power beam width (HPBW) is . For detailed information of the observations we refer to Paper I.
Additionally, we use data of the H i Nearby Galaxy Survey (THINGS) (Walter et al. 2005, 2008). M51 was observed in the VLA D, C, and B array configurations and presented in Kennicutt et al. (2007). In D-configuration the interferometer is sensitive to scales of 15′ allowing to detect almost the total flux for M51. The angular resolution in the integrated intensity image is 5.86′′ 5.56′′. The sensitivity of the THINGS data is 0.44 mJy beam-1 for 5.2 km/s channel width (Walter et al. 2008), which is about a factor 4 deeper than the VLA data of Rots et al. (1990) used in Paper I.
To derive stellar densities, we used the -Band images of the Two Micron All Sky Survey (2MASS) Large Galaxy Atlas (Jarrett et al. 2003).
3 Molecular and atomic gas
3.1 The total gas surface density
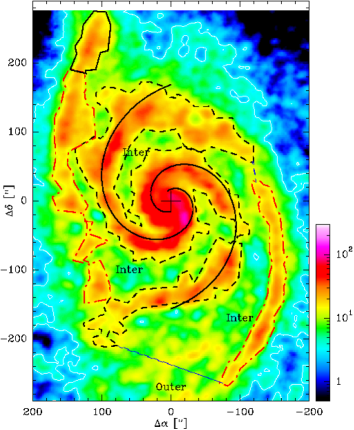
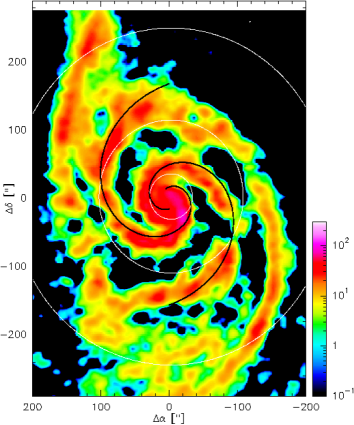
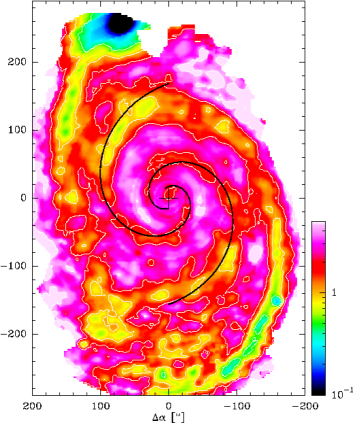
In Fig.2 we present a map of the total gas surface density . This map is a major ingredient of the gravitational stability analysis we will discuss later in this paper.
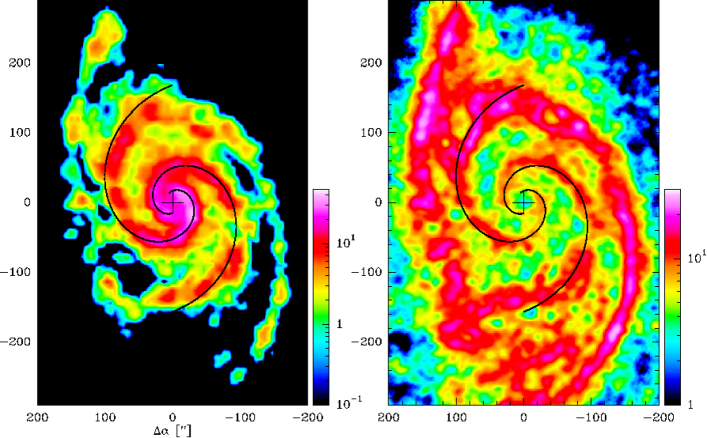
To convert from the observed integrated intensities to the total gas surface densities, we use the relation ) taking into account the mass contribution from He (cf. Paper I). The atomic surface density was calculated from the THINGS H i column density image of M51 (Fig.1), smoothed to 11′′ resolution. Two logarithmic spirals (shown in black) serve as a guide to delineate the inner spiral arms. They are adopted from Shetty et al. (2007) who identified them from a BIMA 12CO 1-0 map of M51.
The total gas surface density in Fig.2 peaks at 127 M⊙ pc-2. The inner spirals showing the densest peaks just south-west of the center show total gas surface densities of 80-100 M⊙ pc-2.
We subdivided the total gas map (Fig. 2) into five different regions: the inner and outer spiral arms, the interarm regions, the outer disk, and the companion galaxy. All regions above a threshold surface density of 20 M⊙ pc-2 were attributed to the spiral arms. The outer border of the outer disk of M51 was defined by the 3 level of M⊙ pc-2 (= 0.36 K km s-1, = 0.44 K km s-1). The threshold for the arms leads to the identification of spiral arms which correspond roughly with the arms seen in interferometric CO maps Shetty et al. (2007), and those seen in H-, and in 20 cm radio-continuum emission (Scoville et al. 2001; Patrikeev et al. 2006).
Table 1 lists the average total gas density and the average H2 over H i density ratio for the five subregions. The average of the inner spiral arm region, is 26.8 M⊙ pc-2.
The outer spiral arms show less gas surface density, with an average total gas density of 18.8 M⊙ pc-2, including the south western spiral arm and the north eastern spiral arm. This is approximately a factor of 1.5 weaker than the spiral arms in the central region. Few high density regions on the outer spiral arms reach of 40–50 M⊙ pc-2 e.g. to the south-west at () and the north-east at (). This is signifcantly weaker compared to the peaks in the center.
| / | ||
| [M⊙ pc-2] | ||
| inner spiral arms | 26.8 | 2.3 |
| outer spiral arms | 18.8 | 0.21 |
| interarm region | 9.4 | 0.71 |
| outer disk | 6.4 | - |
| NGC 5195 - companion | 20.2 | 0.4 |
| ratio inner/outer spiral | 1.4 | 11.0 |
| inner arm/interarm | 2.9 | 3.2 |
| outer arm/interarm | 2.0 | 0.3 |
The interarm regions show surface densities of 5-15 M⊙ pc-2. The average value is 9.4 M⊙ pc-2. The averaged inner arm/interarm contrast in the total gas surface density is 2.9 confirming the results of Garcia-Burillo et al. (1993b) in the integrated CO 2–1 intensities.
There are several spur-like structures bridging the gap between the inner spiral structure and the outer spiral arms e.g. in the north-western area at () at a surface density of 20-30 M⊙ pc-2. Also, in the north-east at () there is a strong bridge between inner and outer spiral arms with a total gas surface density of 20–40 M⊙ pc-2. The gaps or minima in total gas density seen in the spiral arms e.g. at () and at () are interpreted as the signature of 4:1 ultra-harmonic resonances by Elmegreen et al. (1989) applying density wave theory.
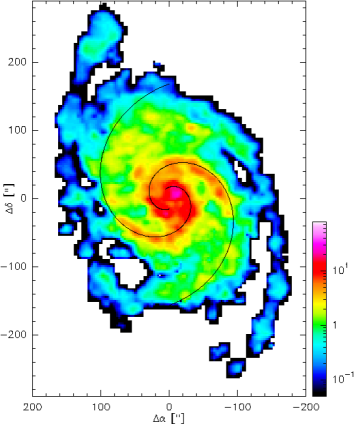
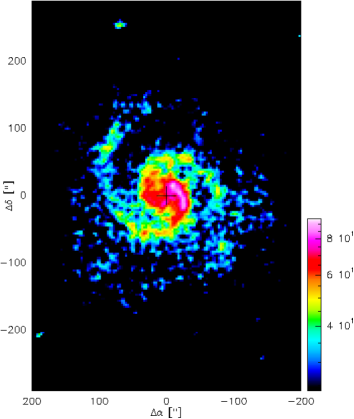
3.2 The molecular gas fraction
Figure 3 shows the ratio map of molecular versus atomic gas surface density /. Overall, the map shows a steep decrease of the ratio from peak values of around 50 in the center to 0.1 in the outer regions as already seen in the radial average (cf. Paper I). The spiral arms in the center are the regions with the highest fraction of molecular gas. The average ratio in the two inner spiral arms delineated in Fig.2 is 2.1 (Table 1). Outwards, at radii of more than about 100′′, the ratio drops also in the spiral arms. The north-eastern and south-western continuation of the inner spiral arms show few regions with a ratio of 1 or slightly above which are correlated with the regions of increased total gas density (Fig.2). The average ratio on the outer spiral arms in the marked polygons is 0.21. This is a factor of 10 lower compared to the inner spirals. The interarm region within the inner radius shows an average ratio of 0.71. The molecular gas surface density drops below the 2 threshold at larger radii for most positions.
The increase of the molecular-to-atomic gas fraction in the spiral arms may be triggered by the spiral wave increasing the hydrostatic pressure, and thereby the formation of molecular clouds from the atomic phases of the ISM.
Next, we will discuss the hydrostatic pressure in the disk of M51 as a possible parameter governing the ratio of molecular and atomic gas.
3.3 The hydrostatic pressure
Recent investigations, e.g. by Blitz & Rosolowsky (2004a, b, 2006), have shown a tight correlation of the / ratio in external galaxies and the hydrostatic pressure Phydro. Elmegreen (1993) theoretically studied the impact of hydrostatic pressure and radiation field on the ratio of atomic and molecular gas. He concludes that the pressure should be the dominant factor determining this ratio. He predicts a power law of their radial averages. Following Blitz & Rosolowsky (2004b), the hydrostatic pressure can be estimated for an infinite disk with isothermal gas and stellar layers from the midplane pressure in equilibrium:
| (1) |
Assuming the volume density of the gas is small compared to the stellar density and a self-gravitating stellar disk ():
| (2) |
is the stellar surface density, which we will address in a later section, the total gas density and the velocity dispersion of the gas, which we estimated from the 12CO 2–1 velocity dispersion (cf. Paper I). For the stellar scale height, we adopt h kpc, consistent with studies by van der Kruit & Searle (1981); Kregel et al. (2002). in equation 2 is given in Nm-2, assuming all input parameters are in SI-units.
As in Paper I, radial averages were created by averaging in elliptical annuli spaced by , including and taking into account points of no detection, and centered at the center position. The annuli are circular rings viewed at an inclination angle and with a line of nodes rotated from north to east by the position angle PA=170∘.
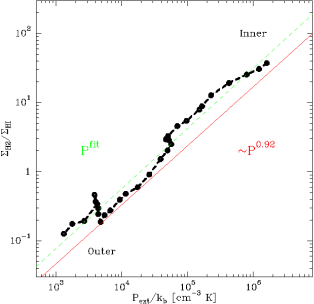
Figure 4 shows the / ratio plotted versus the hydrostatic pressure Phydro, covering three orders of magnitude in pressure, the largest range measured so far in a galaxy disk. A linear regression fit yields a powerlaw:
| (3) |
with the powerlaw coefficient and = cm-3K. The slope of 0.87 is very similar to the slope of 0.92 determined by Blitz & Rosolowsky (2006) for a sample of 14 spiral and dwarf galaxies, including M51. We find a slightly lower compared to the mean result of Blitz & Rosolowsky (2006) in their sample with cm-3K.
This result underlines the importance of the hydrostatic pressure as the physical parameter determining the fraction of molecular to atomic material at a given radius on large scales. The nearly linear dependence found over the whole pressure regime is expected by theoretical predictions (Blitz & Rosolowsky 2006; Elmegreen 1993), if the gravitational potential imposed by the gaseous component is small compared to the stellar component. Note that the pressure dependence of the molecular to atomic fraction is expected to break down when the spatial resolution of the observational data is close to the size of a single giant molecular cloud (GMC). A single GMC is expected to have enhanced pressure due to self-gravity and the assumption of pressure equilibrium is no longer valid (Blitz & Rosolowsky 2006).
3.4 An exponential disk in M51
| Total gas exponential disk: | |
| scale length | 7.6 kpc |
| Amplitude: | 17.8 M⊙ pc-2 |
| disk/total mass-fraction gas | 61% |
| Dust exponential disk: | |
| dust scale length | 6.3 kpc |
| Amplitude: | 0.77 M⊙ pc-2 |
| disk/total mass-fraction dust | 55% |
Next, we investigate the model of an underlying exponential distribution of the total gas density in the disk of M51 and compare it with the dust disk found by Meijerink et al. (2005). We fitted an inclined elliptical exponential disk to the total gas surface density distribution map. We assumed a centered disk at an inclination of 20∘ and a position angle of 170∘. The scale length and the amplitude are determined from a 2-d fit of an exponential distribution exp(/). All pixels in the total gas density map exceeding a threshold surface density of M⊙ pc-2 were blanked. This corresponds to the arm regions we marked in Fig.2 and discussed in §3.1. A significantly higher blanking threshold leads to an overestimation of the exponential disk in the central parts as spiral arm regions are included in the fitting.
Properties of the exponential disk
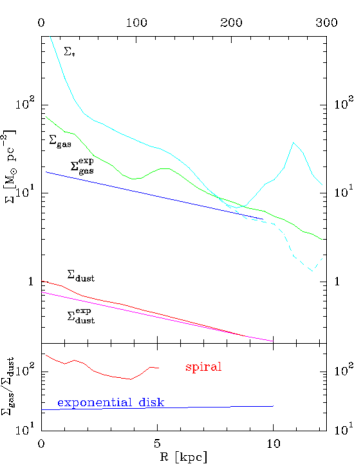
The scale length of the fitted exponential decay of the total gas disk is kpc (Table 2) with the peak at 17.8 M⊙ pc-2. The reduced of the fit is 5.1. The fraction of total gas mass contained in the exponential disk is 61%. Thus the spiral arms contain only of the total gas mass.
Meijerink et al. (2005) fit a scale-length of the exponential dust disk of kpc corresponding to kpc for a distance of 8.4 Mpc, assumed in the present paper. Assuming an isothermal disk, the fraction of dust contained in the exponential disk is 55%. Notably, the scale lengths of the total gas and of the dust exponential disks are similar, as are the relative fractions of mass contained in the disks.
Note that the shallow radial temperature profile deduced by Meijerink et al. (2005) of 25 K in the center to 17 K in the outskirts at 10 kpc radial distance, only leads to a 35% variation of corresponding dust surface densities if the temperature is assumed to be constant. Thus, an isothermal dust disk of 25 K dust temperature and cm2 g-1 (Meijerink et al. 2005) are assumed in the calculation of the dust surface density. The dust surface density is
| (4) |
is the integrated flux. is the flux density, the beam size of 15′′ and the beam area at the distance =8.4 Mpc. labels the Planck-Function at 850 m.
The radially averaged gas-to-dust mass ratio of the surface densities of the exponential disk is shown in the lower box of Figure 7. The gas-to-dust mass ratio is nearly constant with galacto-centric radius, reflecting the similar scale lengths. Values vary only between 23 and 26, which is about a quarter of the canonical Galactic gas-to-dust mass ratio of 100. This constancy is in contrast for example to the strong radial variation of the H2/H i surface density ratio by more than a factor of 100.
The gas-to-dust mass ratio in the exponential disk is significantly lower compared to the canonical Galactic value, whereas the metallicity of M51 is only slightly supersolar with a shallow gradient with varying galactocentric radius (e.g. Kramer et al. 2005). However, several sources of uncertainty enter into this calculation which can not be resolved in the context of this study but might drive the value towards the canonical gas-to-dust mass ratio of 100. In the inner part H2 dominates the total gas mass and is itself calculated via the X-factor for M51 (see discussion in Paper I). The low gas-to-dust mass ratio in the exponential disk, which constitutes the interarm regions, might indicate an X-factor in the interarm regions closer to the Galactic X-factor (4 times the value of M51). This will on the other hand not severely effect the gas-to-dust mass ratio at larger radii where the atomic component is dominanting the molecular contribution.
Additionally, the assumption of a constant dust temperature K and cm2 g-1 (Meijerink et al. 2005) might cause an overestimation of in the exponential disk. A 4 times higher yields a Galactic gas-to-dust mass ratio value but seems unlikely as the values for determined in external galaxies are typically cm2 g-1 (James et al. 2002; Alton et al. 2002). A higher dust temperature also drives the gas-to-dust mass ratio towards the Galactic value, with a ratio of 100 for K and cm2 g-1 as used above.
3.5 Properties of the residual emission
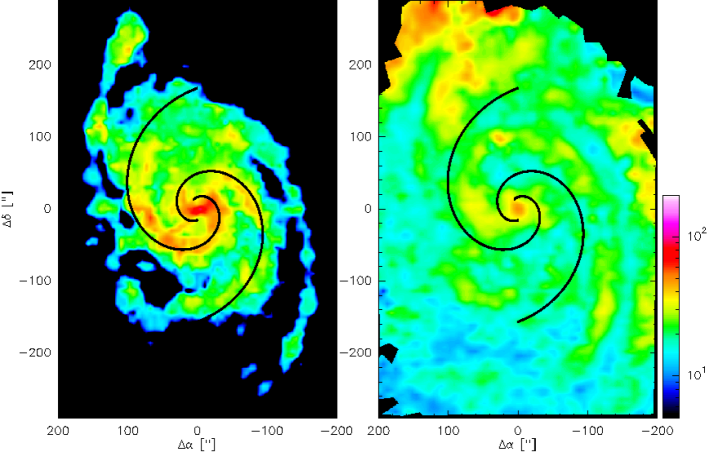
Figures 5 and 6 show the residual total gas and dust maps, after subtracting the corresponding exponential disks. The lower box in Figure 7 shows the corresponding radial averages of the gas-to-dust mass ratio.
For the computation of dust surface density in the residual data, i.e. in the spiral arms, we assume a uniform dust temperature K and cm2 g-1 (Meijerink et al. 2005) as above.
The resulting fraction of and in the spiral arms, shown in Figure 7, is not constant with radius, but rather varies by almost a factor 3 between about 70 and 190 within the first 5kpc where the emission is above the 3-threshold.
In contrast to the gas-to-dust fraction in the exponential disk, we find a minimum of 73 at 3.8 kpc radial distand and a value of 186 in the center. Thus the gas-to-dust mass surface density ratio is a factor of 3-8 higher in the spiral arms compared to the underlying exponential disk.
As the exponential disk constitutes a minor
fraction of the gas mass in the spiral arms, it hardly mixes with the spiral
arm component.
The global gas-to-dust mass ratio, summing the mass components in the exponential disk and the spiral arms in M51 upto the 3-limit of the dust observations, is at 112 close the Galactic value.
4 Stellar surface density
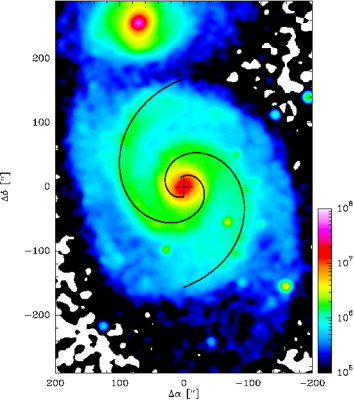
The stellar surface density is an important parameter in determining the stability of the disk. We use the -Band images of the Two Micron All Sky Survey (2MASS) Large Galaxy Atlas (Jarrett et al. 2003) to determine the stellar surface mass density . The Band is a reasonable tracer of the stellar mass density as it is much less affected by extinction within M51 than e.g. the Band in the optical. The Galactic foreground extinction in the Band is 0.013 mag compared to 0.152 mag in the Band (Schlegel et al. 1998).
Bell & de Jong (2001) discuss mass-to-light ratios in the optical and near-IR passbands. Assuming an universal spiral galaxy initial mass function (IMF), they find variations of the mass-to-light ratio of up to 7 in the optical, 3 in the Band and 2 in the Band. To convert from luminosities to solar masses, we use a Band mass-to-light ratio M⊙/ L⊙(Bell & de Jong 2001). The stellar surface density is then determined from the -Band luminosities via M⊙ pc-2 for a distance of 8.4 Mpc to M51 and an angular resolution of 3′′.
The radial average of the stellar surface density is shown in Fig. 7. It decreases from a central value of =810 M⊙ pc-2 to 7 M⊙ pc-2 before increasing to 12 M⊙ pc-2, due to the influence of the neighboring galaxy NGC 5195.
The fraction of stellar-to-gaseous mass density =10.5 is high in the center, decreasing outwards to values below 1 at a radial distance of about 8 kpc, before increasing again due to NGC 5195.
5 Kinematics of the 12CO 2–1 data
5.1 Velocity field and streaming motions
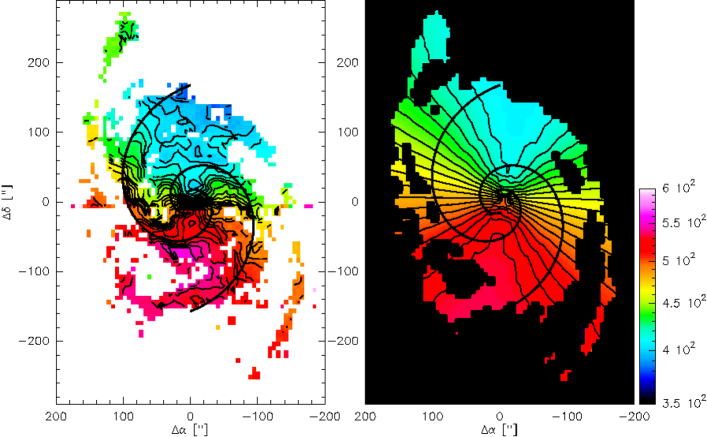
Figure 9a shows the observed velocity field of the 12CO 2–1 data ranging from 370 to 550 km s-1 with the northern part blue-shifted towards us and the southern part of the galaxy red-shifted due to the inclination of the galaxy.
To calculate the velocity field for purely circular motions, we use the rotation curve derived by Garcia-Burillo et al. (1993b, a) and a position angle of . In addition, we assume a constant inclination of and a central velocity of v472 km s-1 (Tully 1974; Shetty et al. 2007). The velocity field at each point in the map is then given by
| (5) |
with the azimuthal angle . The resulting map is presented in Figure 9b.
The two maps resemble well, i.e. the dominant component creating the observed velocity field is the differential rotation curve creating the striking X-shape of the iso-velocity contours.
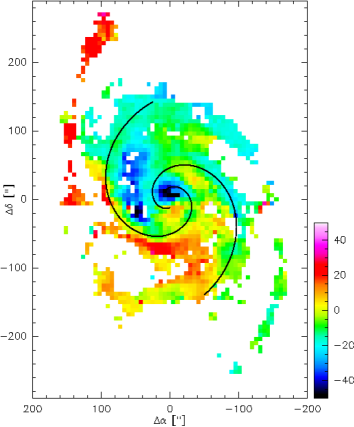
However, the observed velocity field shows in addition many complex structures and distortions not expected from purely rotational motions. We define the residual velocity as the difference of the observed velocity field and purely rotational motions from the rotation curve: . Figure 10 shows a map of the residual velocities, which we will call streaming motions henceforth.
Streaming motions vary between km s-1. Strong residual velocities are seen in the center and near the inner spiral arms, e.g. near (,) and (,). Both outer arms do not show significant streaming motions. We speculate that their locations at radii of from the galaxy center, lie close to the predicted location of the corotation radius at (Garcia-Burillo et al. 1993a, b). At this position no net streaming is expected.
Here, we don’t go into more detail, as streaming motions in M51 have previously been discussed by Garcia-Burillo et al. (1993a) using older 30m data and by Aalto et al. (1999) using OVRO data. In addition, Kuno & Nakai (1997) discussed the streaming motions in M51 based on 12CO 1–0 data observed with the NRO 45m telescope. More recently, Shetty et al. (2007) use BIMA 12CO 1–0 data of the entire galaxy at resolution to discuss radial and tangential streaming motions in detail. They determined the systemic velocity, position angle, and inclination from a two-dimensional fit to the data.
| v | v | |
| [km s-1] | [km s-1] | |
| inner spiral arms | 25.9 | 21.5 |
| outer spiral arms | 11.1 | 18.3 |
| interarm region | 7.3 | 19.4 |
| ratio inner/outer spiral | 2.3 | 1.2 |
| inner arm/interarm | 3.6 | 1.1 |
| outer arm/interarm | 1.5 | 0.9 |
5.2 Velocity dispersion of the molecular and the atomic gas
The velocity dispersion of the gas is a signature of the turbulent interstellar medium and systematic motions within the beam. The turbulent medium and the differential rotation curve hinders the medium to collapse under its gravitational pull, as described by the Toomre criterion.
5.2.1 12CO 2–1
Figure 11a shows a map of equivalent 12CO 2–1 line widths measuring the velocity dispersion.111For a Gaussian line profile, the equivalent width corresponds to the full width at half maximum (FWHM).
We will refer to in the following as the observed line width.
The broadest widths are observed in the center, reaching up to 100 km s-1. In the disk of M51 spiral arms show enhanced line widths relative to the interarm regions. The inner spiral shows strongly enhanced widths relative to the inter arm molecular gas. Along the inner spiral, the widths decrease from about 70 to 20 km s-1. At the same time, the contrast between the arm and interarm dispersion diminishes. Near (60”,100”), arm and interarm molecular gas shows the same dispersion of about 15-20 km s-1. Overall, regions with distances greater than aboutg 100′′ from the center show significantly lower widths of 15 to 20 km s-1. This drop of CO line widths with radius is also seen in a plot of radial averages (Fig. 12) and in the table of line widths averaged over the inner, the outer, and the interarm regions (Table 3). The outer south-western spiral arm shows uniform widths of around 15 km s-1.
Influence of systemic motions
The 12CO 2–1 line widths map in Figure 11a shows no strong systematic broadening of the observed line widths with varying angle in the disk which would indicate that a major fraction of the observed line widths originates in the galactic rotation of M51 (modeled in Figure 9b) polluting the observed line widths . The velocity gradient within the observing beam (FWHM=11′′) due to the velocity field will broaden the observed line widths and thus lead to an overestimation of the intrinsic line width . In the following, we will quantitatively estimate the magnitude of this effect on the observed line widths at some selected positions in the galaxy disk where velocity gradients are suspected to be the highest due to projection: the inner region (0′′/0′′) and along the minor axis. Elsewhere in the disk the gradient of the velocity field is significantly lower (Figure 9b) and additionally the observed line widths are similar to the outer parts of the minor axis (Figure 11a).
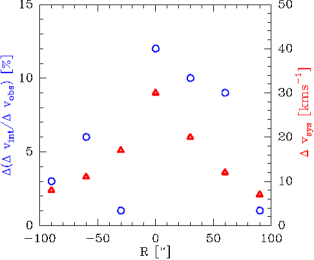
Sakamoto (1996) corrected for the broadening due to systemic motions using: . is the velocity variance across the beam as caused by the modeled large scale velocity field. We apply this method to quantify the influence of the rotational motion at the central position (0′′,0′′) and six other positions near the minor axis of the galaxy from the center outwards (Figure 13).
The relative error of is at the center and decreases outwards along the minor axis with values of less than at distances away from the center. This relative error is shown together with for each of the six studied positions in Figure 13.
We estimate the effect of the polluted on (next section) using Gaussian error propagation for a reasonable range of values. The absolute change of for an overestimation of the line widths of 10 for the gaseous components (the broadening of stellar dispersion due to systemic motions is negligible) results in an maximum absolute uncertainty of 0.16. As this effect is minor, we will in the following neglect the broadening due to rotational motions.
5.2.2 H i
Although line center of CO and H i emission usually coincide quite well, dispersions can be quite different. Figure 11b shows the square root of the second moment M of the H i emission as a measure of its velocity dispersion. For a Gaussian line profile, M corresponds to the FWHM.
The H i line widths show values of around 30–50 km s-1 in the central part. In general, the spiral arms do not show up prominently and the interarm regions show a larger dispersion than the spiral arms, in strong contrast to the corresponding CO map. For example, the inner interarm region near (0′′,100′′) shows velocity widths reaching values of up to 40 km s-1 which is significantly higher compared to the arm regions. Towards the companion galaxy, we see enhanced widths, comparable to those in the central region. H i shows a strong north-south asymmetry with significantly lower line widths in the souther parts of the galaxy. This is less pronounced in the CO-data. Several of these observations are reflected in the plot of radial averages (Fig. 12) and in the table of line widths averaged over the different regions (Table 3).
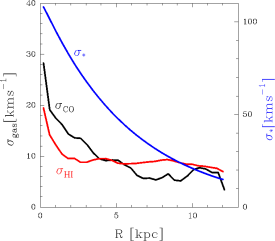
In the plot of radially averaged dispersions (Fig. 12), the dispersion of CO gas exceeds the dispersion of H i for radii up to 4 kpc. The decrease of the dispersion of the atomic component in the inner part from around 20 to 10 km s-1 within 2 kpc is steeper compared to the decrease of the CO dispersion. The radial averaged atomic component then stays constant at around 10 km s-1 out to radii of 12 kpc. The CO dispersion drops to 6 km s-1 below the dispersion of H i at radii of around 6 kpc and increases to 11 km s-1 outwards due to the increased dispersion in the center of the companion.
Our findings are consistent with the following scenario (cf. Garcia-Burillo et al. 1993b; Rand et al. 1992). The dispersion of the molecular gas is enhanced in the spiral arms due to frequent collisions of molecular clouds which may be enhanced by streaming motions driven by the density wave. The atomic clouds in the arms appear to form a different population as their local velocity dispersion is much less compared to the molecular gas. We speculate that thus H i in the arms stems mainly from photodissociated H2 in GMCs, where the dispersion has already decreased due to dissipation. The interpretation of VLA H i and OVRO CO observations by Rand et al. (1992) also favors this dissociation scenario.
The plot of radially averaged dispersions (Fig. 12) also shows the dispersion of disk stars. This is an important parameter for determining the gravitational stability of the disk and will be used in the following section. To estimate the stellar velocity dispersion in M51, we follow Boissier et al. (2003) and Bottema (1993). They showed that the velocity dispersion follows an exponential fall-off depending on the scale length of the B-band of the disk. The B-band scale length is (Trewhella et al. 2000) and the central stellar velocity dispersion in M51 is km s-1 (McElroy 1995). At radii upto 10 kpc, the velocity dispersion of the stars is larger than that of the molecular and atomic gas components.
6 Gravitational stability
6.1 The combined Toomre parameter
We investigate the gravitational stability of the disk of M51 using the Toomre Q-parameter, taking into account the stellar and gaseous contribution. In general, the Toomre stability criterion is depending on the epicyclic frequency , the velocity dispersion of the component considered, and the surface density (Toomre 1964), neglecting e.g. the influence of magnetic fields:
| (6) |
The gas should collaps if Q drops below 1, when gravitation dominates over dispersion and the epiclyclic frequency.
We treat the molecular gas, the atomic gas, and the stars in the disk of M51 as three independent isothermal fluids using the expansion in wavenumber by Wang & Silk (1994) and neglecting higher order terms in the wavenumber i.e. in the velocity dispersions. The model assumption is that the stars move through the gaseous medium without interaction. For this first order analysis, we assume in addition that the dense molecular clouds move frictionless through the diffuse atomic gas. The total Toomre parameter then is:
| (7) |
For , we use the rotation curve derived from CO, assuming that it holds to the H i gas and for the stars in the disk. For the velocity dispersion , we use the dispersions derived above from CO, H i, and the stars, respectively.
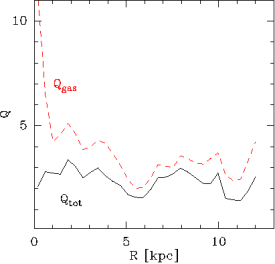
To calculate , we used the 2Mass -band image smoothed to 11′′, as described before. In Fig.14, the radial averages of Qtot and Q are shown.
Taking into account only the H i and CO gas, Qgas drops from values of more than 10 in the center to values of between 2 and 5 for radii beyond about 1 kpc, as has already been discussed in Paper I. In contrast to Qgas, Qtot is smaller and variies only little between 1.5 and 3, at all radii, staying always close but slighty above the critical value for gravitational instability of 1. This finding indicates a self-regulating disk, keeping the total Toomre Q parameter near 1. We will enter into the discussion of our results in the next section.
The importance of the stellar contribution has also been studied by Boissier et al. (2003), who presented radial averages of the Toomre Q-parameter for their sample of galaxies, comparing and . They assume a constant velocity dispersion and find that the stellar contribution lowers the Q-parameter by up to 50% towards the critical threshold. Leroy et al. (2008) very recently also studied the radial averages of the Q-parameter including the stellar contribution in a sample of nearby galaxies from THINGS. They find a marginally stable Qtot in their sample of 23 nearby dwarf and spiral galaxies in accordance with our M51 Qtot-results.
6.2 The influence of streaming motions
Below, we will show that the contribution of non-circular motions to the measured velocity dispersions is small. The influence of streaming motions on the local gravitational stability can therefore be ignored.
To test the influence of non-circular streaming motions on the stability, we correct in the following the observed velocity dispersion for these residual velocities , assuming Gaussian line profiles:
| (8) |
This reduced dispersion leads to a reduction of Q, assuming that the non-circular streaming motions do not stabilize the gas against collapse.
A local change of the observed line widths propagates into Qgas according to Gaussian error propagation. Typical values of Q, Q , km s-1 and a variation of 50% of the velocity dispersion, yields absolute variations of Qgas of upto 56% only.
In the radial averages, the maximum relative change between the corrected and uncorrected Qtot is only 7%. In the following, we therefore neglect the streaming motions in the Toomre analysis, and use directly the observed velocity dispersion for the calculation of the Q-parameter.
6.3 The local distribution of Qtot
The local values of the Toomre Q-parameter Qtot at each position are studied in the following. Numerical simulations show that the local Q values can deviate significantly from the radially averaged values. Wada & Norman (1999) use two- dimensional hydrodynamical simulations to study the gravitational stability of the central region of a galactic disk. While global Q-parameter values of their model disk are significantly above the threshold for gravitational collapse, locally the disk shows unstable regions spatially correlated with cold and dense clumps.
Figure 15 shows a map of the Toomre Q-parameter Qtot in M51. In general, spiral arms show smaller values of Qtot, i.e. they are more prone to collapse under the gravitational pull, than the surrounding interarm gas. This is expected as star formation occurs predominantly in the spiral arms.
The inner spiral arms show values between 1 and 2 near to the threshold for gravitational stability. The regions between the inner spiral arms show values up to a factor of 2 to 3 higher as they lack surface density. The outer south-western spiral arm is almost everywhere critical to gravitational collapse with below 1 or around 1. The outer north-eastern spiral arm shows of around 1 and below and few small regions reaching values of about 2.
In summary, we see three systematic trends in : a slight decrease from the central parts to the outer regions. In the spiral arms, peak values decrease from to . Note that in Paper I no systematic change of the gas depletion times from the inner to the outer parts was found. Secondly, at a fixed radius, approaches the regime of instability in the arms, while the interarm regions are stable. Thirdly, the outer disk beyond the outer spiral arms the disk is stable as well.
A similar study at higher spatial resolution of the total Toomre parameter combining the stellar and gaseous contribution has been done in the LMC by Yang et al. (2007) using the assumption of a constant velocity dispersion. As the LMC has no prominent spiral structure, the -map by Yang et al. (2007) also shows no spiral arms with enhanced instability. They also stress the importance of the stellar contribution for studying the gravitational stability. Correlating the locations of massive young stellar objects (YSOs) in the LMC with the gravitational stability, Yang et al. (2007) find that 85% of the YSOs lie inside gravitationally unstable regions. This underlines the importance of gravitational stability of the disk for large-scale star formation in the LMC.
Both galaxies, the LMC and M51, show large regions near the critical value for collapse indicating possible sites for star formation. The observation that is near 1 in large areas of the disk is notable and was found previously in radial averages of several other galaxies (Boissier et al. 2003). This has led several authors, e.g. Combes (2001), to speculate that self-regulation drives these galaxies near the threshold of gravitational stability.
We will briefly sketch the feedback-cycle in the following. The birthplaces of stars are deeply embedded in dense cores of molecular clouds formed through gravitational contraction and collapse of molecular material after loosing much of their turbulent support. Both, bipolar outflows and expanding H ii-regions from young stars, stellar winds and supernovae explosions from evolved stars, will introduce mechanical energy into the interstellar medium, locally enhancing the dispersion of the gas, increasing the Q-value. In addition, ionizing radiation from young stars will lead to photo-dissociation of the surface regions and the formation of atomic gas from the molecular material. These feedback mechanisms are supplemented by the density wave, enhancing cloud-cloud collisions due to orbit crowding in spiral arms, also leading to an increase of the velocity dispersion of the molecular gas inside the arms. Star formation in the remaining molecular gas must await dissipation of the enhanced macroscopic turbulence to cascade down to smaller scales and dissipate. Globally, this self-regulation may explain why Q stays near 1.
In the interarm regions the gas stays stable (Q) as no stars are formed and the feedback mechanisms are not at work. The regions critical to collapse in the outer spiral arms coincide with the finding of increased star formation efficiency in these areas by Garcia-Burillo et al. (1993b) based on H data.
Shetty & Ostriker (2008) use hydrodynamic simulations, including feedback to study star formation and the structure of galactic disks. They find that a simple feedback mechanism with one star formation event per cloud can not sustain a global spiral pattern in galactic disks. This indicates that the modeling of feedback needs to be improved. Quillen & Bland-Hawthorn (2008) explain episodic star formation in galaxies by strong feedback mechanisms using numerical models.
In recent 3D smoothed particle hydrodynamics simulations of isolated disk galaxies, Li et al. (2005, 2006) confirmed the major role of gravitational stability in the process of star formation and were able to examine a threshold surface density. This evidence for the Toomre formalism in their simulations is also dominating any magnetic effects on star formation. Magnetic fields slow the collapse of the gas but do not stop it (Shetty & Ostriker 2008).
7 Summary
Using our complete 12CO 2–1 map of M51 combined with new HI VLA data from the THINGS team (Walter et al. 2005, 2008), we created a total gas density map and a ratio map of molecular and atomic surface density. The total gas density exhibits an underlying exponential disk similar to the one found in 850 m dust continuum emission by Meijerink et al. (2005). Maps of 12CO 2–1 velocity field, line widths and H i line widths were presented. Combining these information the combined gaseous and stellar Toomre Q-parameter was discussed radially and locally in the disk of M51. The main results of this analysis are:
-
•
The averaged total gas density on the spiral arms is at around 30 M⊙ pc-2 which is a factor of 3 higher compared to the interarm regions.
-
•
The ratio of molecular to atomic gas surface density is highest in the inner spiral arms at around 50 decreasing to 0.2 in the outer spiral arms. This ratio shows a power-law dependence on the hydrostatic pressure with an index of 0.87, similar to that found in other nearby galaxies (Blitz & Rosolowsky 2006).
-
•
We fit an underlying exponential disk to the total gas density data with a scale length of 7.6 kpc containing 55% of the total mass. This is comparable to an underlying exponential disk fitted to the 850m dust continuum map by (Meijerink et al. 2005). The gas-dust ratio in the exponential disk stays nearly constant with galactocentric radius at around 25. The radially averaged map of the gas-to-dust ratio in the residual data shows a variation between 80 and 200.
-
•
The 12CO 2–1 velocity field shows distinct differences with respect to a purely rotational velocity field. We discuss a map of these residual or streaming motions. The observed width of the 12CO 2–1 lines decrease from 100 km s-1 in the central part to less than 15 km s-1 in the outer regions. The widths of the H i spectra show similar values, but a significantly different distribution. While the CO widths show higher dispersions in the spiral amrs, the H i shows the maximum line widths in the interarm regions and lower values on the spiral arms.
-
•
We estimate the gravitational stability using a combined stellar and gaseous Toomre parameter Qtot. The impact of the stellar component on the stability is significant reducint the Q parameter. It decreases by up to 70% towards the threshold for stability Q. Qtotal varies between 5 in the interarm regions decreasing to values below 1 on the spiral arms. In general, the spiral arm regions are closer to the threshold for gravitational instability. The obtained values close to the threshold of 1 indicate self-regulation in the disk of M51. The self-regulation mechanism was discussed on theoretical grounds by (e.g. Combes 2001; Shetty & Ostriker 2008). Similar studies based on extragalactic observations in M83 (Lundgren et al. 2004) or the LMC (Yang et al. 2007) obtained also Q-values close to the threshold for stability.
Acknowledgements.
We thank F. Walter for providing us the THINGS VLA H i data and we thank R. Meijerink, R. Tilanus, and F. Israel for providing us the SCUBA 850 m data of M51. MH acknowledges support from the Bonn-Cologne Graduate School of Physics and Astronomy (BCGS). This work is also financially supported in part by the grant SFB 494 of the Deutsche Forschungsgemeinschaft, the Ministerium für Innovation, Wissenschaft, Forschung und Technologie des Landes Nordrhein-Westfalen and through special grants of the Universität zu Köln and Universität Bonn.References
- Aalto et al. (1999) Aalto, S., Huettemeister, S., Scoville, N. Z., & Thaddeus, P. 1999, ApJ, 522, 165
- Alton et al. (2002) Alton, P. B., Bianchi, S., Richer, J., Pierce-Price, D., & Combes, F. 2002, A&A, 388, 446
- Bell & de Jong (2001) Bell, E. F. & de Jong, R. S. 2001, ApJ, 550, 212
- Blitz & Rosolowsky (2004a) Blitz, L. & Rosolowsky, E. 2004a, in Astronomical Society of the Pacific Conference Series, Vol. 323, Star Formation in the Interstellar Medium: In Honor of David Hollenbach, ed. D. Johnstone, F. C. Adams, D. N. C. Lin, D. A. Neufeeld, & E. C. Ostriker, 89
- Blitz & Rosolowsky (2004b) Blitz, L. & Rosolowsky, E. 2004b, ApJ, 612, L29
- Blitz & Rosolowsky (2006) Blitz, L. & Rosolowsky, E. 2006, ApJ, 650, 933
- Boissier et al. (2003) Boissier, S., Prantzos, N., Boselli, A., & Gavazzi, G. 2003, MNRAS, 346, 1215
- Bottema (1993) Bottema, R. 1993, A&A, 275, 16
- Combes (2001) Combes, F. 2001, in Astronomical Society of the Pacific Conference Series, Vol. 249, The Central Kiloparsec of Starbursts and AGN: The La Palma Connection, ed. J. H. Knapen, J. E. Beckman, I. Shlosman, & T. J. Mahoney, 475
- Elmegreen (1993) Elmegreen, B. G. 1993, ApJ, 411, 170
- Elmegreen et al. (1989) Elmegreen, B. G., Seiden, P. E., & Elmegreen, D. M. 1989, ApJ, 343, 602
- Feldmeier et al. (1997) Feldmeier, J. J., Ciardullo, R., & Jacoby, G. H. 1997, ApJ, 479, 231
- Garcia-Burillo et al. (1993a) Garcia-Burillo, S., Combes, F., & Gerin, M. 1993a, A&A, 274, 148
- Garcia-Burillo et al. (1993b) Garcia-Burillo, S., Guelin, M., & Cernicharo, J. 1993b, A&A, 274, 123
- Heitsch et al. (2008) Heitsch, F., Hartmann, L. W., Slyz, A. D., Devriendt, J. E. G., & Burkert, A. 2008, ApJ, 674, 316
- James et al. (2002) James, A., Dunne, L., Eales, S., & Edmunds, M. G. 2002, MNRAS, 335, 753
- Jarrett et al. (2003) Jarrett, T. H., Chester, T., Cutri, R., Schneider, S. E., & Huchra, J. P. 2003, AJ, 125, 525
- Kennicutt et al. (2007) Kennicutt, Jr., R. C., Calzetti, D., Walter, F., et al. 2007, ApJ, 671, 333
- Knapen et al. (2006) Knapen, J. H., Allen, R. J., Heaton, H. I., Kuno, N., & Nakai, N. 2006, A&A, 455, 897
- Kramer et al. (2005) Kramer, C., Mookerjea, B., Bayet, E., et al. 2005, A&A, 441, 961
- Kregel et al. (2002) Kregel, M., van der Kruit, P. C., & de Grijs, R. 2002, MNRAS, 334, 646
- Kuno & Nakai (1997) Kuno, N. & Nakai, N. 1997, PASJ, 49, 279
- Leroy et al. (2008) Leroy, A. K., Walter, F., Brinks, E., et al. 2008, AJ, 136, 2782
- Li et al. (2005) Li, Y., Mac Low, M.-M., & Klessen, R. S. 2005, ApJ, 620, L19
- Li et al. (2006) Li, Y., Mac Low, M.-M., & Klessen, R. S. 2006, ApJ, 639, 879
- Lundgren et al. (2004) Lundgren, A. A., Olofsson, H., Wiklind, T., & Rydbeck, G. 2004, A&A, 422, 865
- Martin & Kennicutt (2001) Martin, C. L. & Kennicutt, R. C. 2001, ApJ, 555, 301
- McElroy (1995) McElroy, D. B. 1995, ApJS, 100, 105
- Meijerink et al. (2005) Meijerink, R., Tilanus, R. P. J., Dullemond, C. P., Israel, F. P., & van der Werf, P. P. 2005, A&A, 430, 427
- Patrikeev et al. (2006) Patrikeev, I., Fletcher, A., Stepanov, R., et al. 2006, A&A, 458, 441
- Quillen & Bland-Hawthorn (2008) Quillen, A. C. & Bland-Hawthorn, J. 2008, MNRAS, 386, 2227
- Rand et al. (1992) Rand, R. J., Kulkarni, S. R., & Rice, W. 1992, ApJ, 390, 66
- Rosolowsky et al. (2007) Rosolowsky, E., Keto, E., Matsushita, S., & Willner, S. P. 2007, ApJ, 661, 830
- Rots et al. (1990) Rots, A., Crane, P., Bosma, A., Athanassoula, E., & van der Hulst, J. 1990, Astronomical Journal, 100, 387
- Sakamoto (1996) Sakamoto, K. 1996, ApJ, 471, 173
- Schaye (2004) Schaye, J. 2004, ApJ, 609, 667
- Schlegel et al. (1998) Schlegel, D. J., Finkbeiner, D. P., & Davis, M. 1998, ApJ, 500, 525
- Schuster et al. (2007) Schuster, K. F., Kramer, C., Hitschfeld, M., Garcia-Burillo, S., & Mookerjea, B. 2007, A&A, 461, 143
- Scoville et al. (2001) Scoville, N. Z., Polletta, M., Ewald, S., et al. 2001, AJ, 122, 3017
- Shetty & Ostriker (2008) Shetty, R. & Ostriker, E. C. 2008, ArXiv e-prints, 805
- Shetty et al. (2007) Shetty, R., Vogel, S. N., Ostriker, E. C., & Teuben, P. J. 2007, ApJ, 665, 1138
- Toomre (1964) Toomre, A. 1964, ApJ, 139, 1217
- Trewhella et al. (2000) Trewhella, M., Davies, J. I., Alton, P. B., Bianchi, S., & Madore, B. F. 2000, ApJ, 543, 153
- Tully (1974) Tully, R. B. 1974, ApJS, 27, 437
- van der Kruit & Searle (1981) van der Kruit, P. C. & Searle, L. 1981, A&A, 95, 105
- Wada & Norman (1999) Wada, K. & Norman, C. A. 1999, ApJ, 516, L13
- Walter et al. (2008) Walter, F., Brinks, E., de Blok, W. J. G., et al. 2008, ApJ submitted
- Walter et al. (2005) Walter, F., Brinks, E., de Blok, W. J. G., Thornley, M. D., & Kennicutt, R. C. 2005, in Astronomical Society of the Pacific Conference Series, Vol. 331, Extra-Planar Gas, ed. R. Braun, 269
- Wang & Silk (1994) Wang, B. & Silk, J. 1994, ApJ, 427, 759
- Wong & Blitz (2002) Wong, T. & Blitz, L. 2002, ApJ, 569, 157
- Yang et al. (2007) Yang, C.-C., Gruendl, R. A., Chu, Y.-H., Mac Low, M.-M., & Fukui, Y. 2007, ApJ, 671, 374