On the various origins of close-in extrasolar planets
Abstract
The extrasolar planets (EPs) so far detected are very different to the planets in our own Solar System. Many of them have Jupiter-like masses and close-in orbits (the so-called hot planets, HPs), with orbital periods of only a few days. In this paper, we present a new statistical analysis of the observed EPs, focusing on the origin of the HPs. Among the several HP formation mechanisms proposed so far, the two main formation mechanisms are type II migration and scattering. In both cases, planets form beyond the so-called snow-line of the protoplanetary disk and then migrate inward due to angular momentum and energy exchange with either the protoplanetary disk or with companion planets. Although theoretical studies produce a range of observed features, no firm correspondence between the observed EPs and models has yet been established. In our analysis, by means of principal component analysis and hierarchical cluster analysis, we find convincing indications for the existence of two types of HPs, whose parameters reflect physical mechanisms of type II migration and scattering.
keywords:
planets and satellites: formation – planetary systems: formation – planetary systems: protoplanetary discs.1 Taxonomy of hot planets
The present EPs database consists of a rather heterogeneous sample of
planets, showing great variety in all the measured quantities.
Statistical analysis provides a necessary means to find correlations
among various physical parameters involved in planetary formation and
evolution. Nevertheless, we caution that statistical analysis may not
be able to disclose important relationships due to the complex and
-mostly unknown- interplay of the involved parameters. In order to
overcome such problems, we performed a global statistical analysis of
the EPs, using a novel approach. The underlying idea is to find
groups of similar EPs and to distinguish different EP groups on
the basis of their diversity. In this work, the concept of
similarity and diversity among EPs is quantified by means of a
distance measure in the multifold space of physical parameters. This
goal has been achieved with the aid of principal component analysis
and hierarchical cluster analysis. In the present analysis we
followed the procedure used by Marchi (2007), and updated in
Marchi & Ortolani (2008). The database111Taken from The Exoplanet
Enclycopaedia at http://exoplanet.eu/ used in this paper is updated
to July 9th, 2008. We restricted our analysis to those EPs
having measurements for five input variables, that is: planetary
mass (), semimajor axis (), eccentricity (), stellar mass
() and metallicity ([Fe/H]). Of 308 EPs (including Jupiter), 252
were finally selected for the analysis. The purpose of our analysis
is to identify planets which are similar with respect to the 5-fold
space of the input variables. As a result, 6 robust EP clusters have
been identified. Before focusing on HPs, we briefly outline the
general nature of the clusters.
Cluster C1 is characterized by sub- to jovian-like , AU,
and super-solar [Fe/H]. Cluster C2 has sub-jovian , AU,
sub-solar and sub-solar [Fe/H]. Both clusters C1 and C2 also
have low mean eccentricity. Cluster C3 is the least populated cluster
(14 EPs) and probably has no strong significance except the fact that
it contains many peculiar EPs that for different reasons have been
rejected by the other clusters. They are mostly jovian mass planets,
having a remarkably super-solar [Fe/H]. Cluster C4 has mostly jovian
mass planets, a relatively large , orbiting solar mass stars with a
widespread [Fe/H] distribution characterized by sub-solar values
(Jupiter belongs to this cluster). Cluster C5 has super-jovian mass,
AU, super-solar and sub-solar [Fe/H]. The same holds for
cluster C6, except for its super-solar [Fe/H] and its higher average
eccentricity. All the input variables have an important role in
defining the clusters, in particular and [Fe/H].
Beyond the general traits of the solutions, which will be described in
more detail elsewhere, we focus in this paper on the HPs defined as
those having a period less than 12 days (see later for further
comments on this selection). According to the adopted definition, 69
HPs are present in the database. The main results of the taxonomy is
that HPs have been split into two main groups, belonging to clusters
C1 and C2. In addition, there are a few outliers placed in other
clusters.
1.1 Two types of HPs
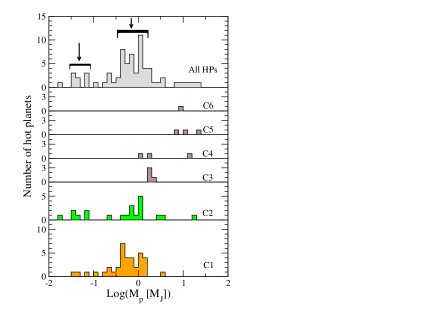
One of the most interesting features about the HPs, is the shape of
their mass distribution (see fig. 1). It has two peaks.
These peaks are thought to be real, even if the shape of the present
distribution is severely affected by observational biases that make
the discovery of low mass HPs difficult. In the literature, the
bodies belonging to the lower mass peak are referred to as hot
neptunes (HNs) while those belonging to the higher mass peak as hot
jupiters (HJs). Theoretical models also predict a double peaked
distribution (Mordasini et al., 2007; Ida & Lin, 2008), where HNs are expected to be much
more abundant than HJs.
It is interesting that our taxonomy splits the majority of HPs into
two different clusters (except for a few outliers). Most of the HPs
belonging to the peak at are placed in cluster C1
(fig. 1). HPs of the cluster C2 have a broad and
flatter mass distribution, and it contains most of the HNs.
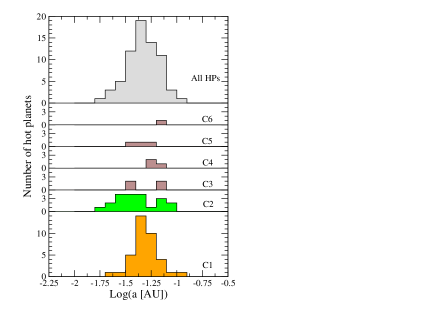
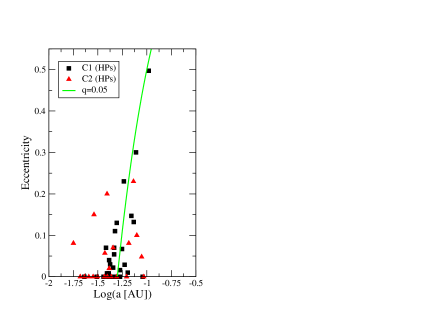
Concerning the semimajor axis distribution, similar considerations
hold. HPs of cluster C1 are strongly clustered at
( AU); while those of cluster C2 have a flatter
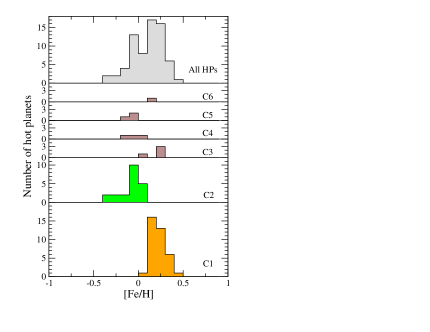
distribution (fig. 1). The two groups of HPs also have
clearly distinctive traits in terms of properties of stellar
metallicity and -to a lesser extent- to stellar mass. These variables
are important because they account for the environment where the
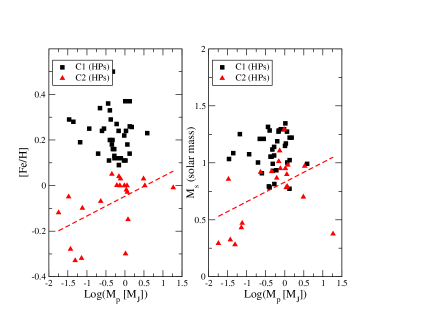
planets formed. Figure 2 shows a remarkable result:
HPs of cluster C1 have super-solar [Fe/H], while those of C2 have a
sub-solar [Fe/H]. Notice that this result is also valid for the whole
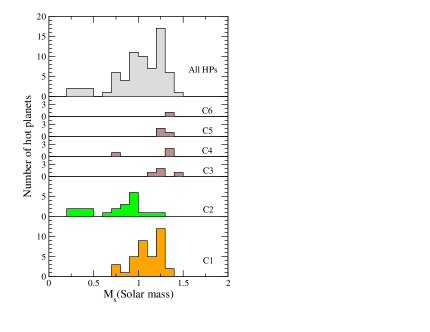
of C1 and C2, and not only for their HPs. A similar, but less
pronounced, result also holds for the stellar mass: HPs of C1 have
mostly super-solar ; while those of C2 have mostly sub-solar
(fig. 2).
The HPs of cluster C1 and C2 also have other distinctive traits. We
found some significant intracluster correlations which hold for one
cluster but not for the other. These are the correlations ,
[Fe/H], (see fig. 3). The semimajor axis of
the HPs of cluster C1 strongly correlate with , while this
correlation is absent for cluster C2. On the other hand, HPs of
cluster C2 exhibit a strong correlation of [Fe/H] and ,
while cluster C1 does not (fig. 3). These two plots in turn
clearly show that HNs of cluster C1 are very different from the few
belonging to cluster C2. The latter have remarkable sub-solar [Fe/H]
and sub-solar .
Another important point is why some HPs have been placed in clusters
other than C1 and C2. They are: HD73256b, HD68988b, HAT-P-7b and
HD118203b (C3); XO-4b, HAT-P-6b and HD162020b (C4); WASP-14b,
CoRoT-Exo-3b and XO-3b (C5); HAT-P-2b (C6). It is not clear if they
are real outliers or if they are misplaced by the clustering
algorithm. However, a close look at their properties shows that the
main characteristic of these HPs is that they have high and high
. Among the outliers, the most massive () HPs are
present, namely HAT-P-2b, WASP-14b, CoRoT-Exo-3b, XO-3b and HD162020b
(see fig. 1, left panel). Notice that the massive
HD41004Bb is placed instead in C2, due to the very low stellar mass.
In the present database, the combination of high and high
is rather unusual, and this suggests that these HPs may be real
outliers. Of course, if more HPs having such characteristics are
discovered, it is possible that they may be grouped into a third class
of HPs.
Finally, it is also important to note that previous results are robust
to changes in the selection of HP periods, at least in the range from
10 d to 30 d.
2 Physical interpretation
Our present theoretical understanding of the formation of HPs is based
on two models: planetary migration within a protoplanetary disk
(Lin & Papaloizou, 1985) and planet-planet scattering followed by tidal
circularization (Rasio & Ford, 1996; Weidenschilling & Marzari, 1996; Lin & Ida, 1997). Planetary migration has
been shown to be an efficient mechanism to produce HPs. Migration can
occur when planetary embryos are still embedded within the disk
(type I), or when they are large enough to open a gap in the disk
(type II). According to the present state of the art, the migration
seems the best candidate for HP formation. On the other hand, early
works on planet-planet scattering showed that the probability for the
scattering model to produce HPs was very low. However, Nagasawa et al. (2008)
found that the Kozai mechanism enhances the probability significantly.
Therefore, it is possible that the scattering contributes to the
formation of hot planets as well as type II migration, although the
latter may be a main channel.
Type II migration is more efficient for moderate mass planets since
the planets have to be massive enough to clear a gap in the disk, but
not too massive to efficiently exchange angular momentum and energy
with the disk itself.
Previous simulations have shown that the formation of HPs via
gravitational scattering among planets and the subsequent Kozai
mechanism combined with tidal dissipation is more likely for
dynamically active systems of multiple planets, typically containing
three or more gas giants (e.g. Marzari & Weidenschilling, 2002). The formation of many
giant planets is preferred in high dust surface density disks
(Ida & Lin, 2008). Dust surface density scales as ,
where is the total disk mass. The latter scales, according to
theoretical models, as , where (Vorobyov, 2008).
Therefore high stellar masses and high-metallicity disks favor the
onset of a scattering phase. It must also be noted that smaller
planets tend to be scattered inward during the scattering phase and
that the tidal circularization is more efficient for planets with
small mass and large physical radius.
The detailed final orbital configuration of the HPs may vary according
to several parameters. However, there are a number of general
features that can be outlined.
In the case of type II migration, the HPs final position is close to
the location of the disk’s inner edge. This is placed near the
corotation radius (namely the distance where the keplerian period
matchs the star spin period), where disk material accretes onto the
stellar poles following the magnetic field lines. The spin period for
young stars having may vary
considerably, from 1 d up to 20 d or more (Herbst et al., 2007). Therefore,
taking also into account a wide variety of disk parameters, the final
location of HPs formed by type II migration tends to be spread, in the
range from 0.01 to 0.1 AU. Concerning the eccentricity, at the end of
the migration phase low values are expected. Recent simulations
(Rice et al., 2008) suggest that, when HPs reach the stellar magnetosphere
cavities, they may further evolve to smaller . For
moderate-to-high , the also increases. On the other hand,
the location of HPs formed by scattering is determined by the location
where the tidal force is effective. The tidal strength depends on
several parameters (planetary radius, planetary mass, etc) but the
final location tends to be in the range 0.03-0.08 AU, for typical
parameter values. The eccentricity of the inner planet is excited to
values close to unity by close scattering and via the subsequent Kozai
mechanism. The resultant small pericenter distance enables the
planet’s eccentricity and semi-major axis to be decreased by the tidal
dissipation and moderate eccentricities can remain in some cases
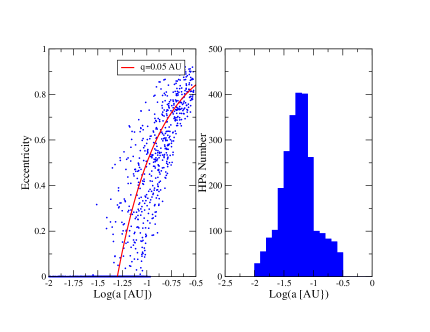
(Nagasawa et al., 2008). We show this in fig. 4. The outcome of
the simulations vary according to tide efficiency. For the
simulations shown here, we followed the tidal evolution of test
planets, according to Ivanov & Papaloizou (2007), for a time span of
yr. A large number of planetary radii, planetary
masses and stellar masses have been considered, choosen at random
within the following intervals: ,
, . The initial
eccentricity is randomly chosen from the distribution obtained by
Nagasawa et al. (2008). Figure 4 (left panel) shows that at the
end of the scattering and tidal evolution phases the eccentricity and
semimajor axes are correlated (compared to the observed distribution
in fig. 3), while the right panel shows that the resulting
semimajor axis distribution is peaked. The value of the peak depends
on the strength of the tide, and for the values used here it is peaked
at AU, as observed in cluster C1 (compare with the
observed distribution in fig. 1).
3 Discussion and conclusion
The two main processes of HP formation produce different orbital
distributions. On the basis of our taxonomic analysis, we identify two
types of HPs, which may retain the footprints of these two different
formation processes. In this respect, HPs of cluster C2 and C1 may
have been formed by migration and scattering, respectively. This
scenario is supported by a number of facts. First of all the
distribution and the strong relationship for cluster C1, which
do not hold for cluster C2. Moreover, also the distribution of
the two clusters support this conclusion: higher mass bodies are
located in cluster C1, indicating more massive protoplanetary disks,
which in turn is confirmed by high [Fe/H] and high . In this
case, the detected HPs are expected to be the least massive for each
system, since in a multibody scattering the least massive planets are
more effectively pushed inward. The orbits of the most massive
planets are, however, only slightly affected by the scattering phase,
therefore they tend to stay close to their formation regions and
therefore on relatively large . Although HJs originated via the
scattering process are expected to be accompanied by outer companions,
the latter would be beyond the detectable limit by present surveys. We
find no significant difference between C1 and C2 about the
multiplicity of planets, but we caution that this result is affected
by low number statistics. Some Jupiter-like mass HPs are also present
in cluster C2, but in this case they may be the most massive bodies
formed in these systems, given also the moderate-to-low and low
[Fe/H]. Another interesting point is that most of the HNs belong to
cluster C2.
Therefore, if we extrapolate directly the percentage of HPs belonging
to C1 and C2 into the efficiency of formation of the two processes, we
end up with 50% of HPs formed via scattering and 30% via migration.
The remaining 20% are outliers and may be formed either way. These
numbers, however, have to be taken with caution, since some degree of
mixing between the two clusters is expected. On the other hand, from a
theoretical point of view (see discussion in previous sections)
type II is expected to be more efficient in producing close-in EPs.
This fact is not in contradiction with our findings since it is
possible that planets migrating inward by type II may stop before
becoming HPs. This would be the case, for instance, if the gas in the
disk dissipates before the planet reaches the magnetospheric
cavity. In this respect, it is interesting that many giant EPs exist
in the range 0.1-3 AU and that their semimajor axis distribution is
well explained by the type II migration model (Schlaufman et al., 2009).
An alternative scenario is that the two groups of HPs were formed by
the same process, and the cluster analysis splits them on the basis of
their diversity in the input variables. In this case, the most
distinctive variable would be the metallicity. Formation in low
metallicity, moderate-to-low , environments would have produced
the HPs of cluster C2. On the other hand, high [Fe/H] and
moderate-to-high would have produced the HPs of cluster C1. The
combinations of these diversities would have also produced the
observed differences in the and distribution of the two
groups. Although this is a possibility, we think the peculiar traits
of cluster C1 and C2 clearly shown the influences of the two formation
mechanisms.
References
- Herbst et al. (2007) Herbst, W., Eislöffel, J., Mundt, R., & Scholz, A. 2007, Protostars and Planets V, 297
- Ida & Lin (2008) Ida, S., & Lin, D. N. C. 2008, ApJ, 673, 487
- Ida & Lin (2008) Ida, S., & Lin, D. N. C. 2008, ApJ, 685, 584
- Ivanov & Papaloizou (2007) Ivanov, P. B., & Papaloizou, J. C. B. 2007, MNRAS, 376, 682
- Lin & Ida (1997) Lin, D. N. C., & Ida, S. 1997, ApJ, 477, 781
- Lin & Papaloizou (1985) Lin, D. N. C., & Papaloizou, J. 1985, Protostars and Planets II, 981
- Marchi & Ortolani (2008) Marchi, S., & Ortolani, S. 2008, IAU Symposium, 249, 123
- Marchi (2007) Marchi, S. 2007, ApJ, 666, 475
- Marzari & Weidenschilling (2002) Marzari, F., & Weidenschilling, S. J. 2002, Icarus, 156, 570
- Mordasini et al. (2007) Mordasini, C., Alibert, Y., Benz, W., & Naef, D. 2007, arXiv:0710.5667
- Nagasawa et al. (2008) Nagasawa, M., Ida, S., & Bessho, T. 2008, ApJ, 678, 498
- Rasio & Ford (1996) Rasio, F. A., & Ford, E. B. 1996, Science, 274, 954
- Rice et al. (2008) Rice, W. K. M., Armitage, P. J., & Hogg, D. F. 2008, MNRAS, 384, 1242
- Schlaufman et al. (2009) Schlaufman, K. C., Lin, D. N. C., & Ida, S. 2009, ApJ in press
- Vorobyov (2008) Vorobyov, E. I. 2008, arXiv:0810.1393
- Weidenschilling & Marzari (1996) Weidenschilling, S. J., & Marzari, F. 1996, Nature, 384, 619