now at ]Okayama University, Okayama The Belle Collaboration
Measurement of the branching fraction for the decay
A. Sokolov
Institute of High Energy Physics, Protvino
M. Shapkin
Institute of High Energy Physics, Protvino
H. Aihara
Department of Physics, University of Tokyo, Tokyo
K. Arinstein
Budker Institute of Nuclear Physics, Novosibirsk
Novosibirsk State University, Novosibirsk
T. Aushev
École Polytechnique Fédérale de Lausanne (EPFL), Lausanne
Institute for Theoretical and Experimental Physics, Moscow
A. M. Bakich
University of Sydney, Sydney, New South Wales
E. Barberio
University of Melbourne, School of Physics, Victoria 3010
A. Bay
École Polytechnique Fédérale de Lausanne (EPFL), Lausanne
K. Belous
Institute of High Energy Physics, Protvino
V. Bhardwaj
Panjab University, Chandigarh
A. Bondar
Budker Institute of Nuclear Physics, Novosibirsk
Novosibirsk State University, Novosibirsk
M. Bračko
University of Maribor, Maribor
J. Stefan Institute, Ljubljana
T. E. Browder
University of Hawaii, Honolulu, Hawaii 96822
M.-C. Chang
Department of Physics, Fu Jen Catholic University, Taipei
P. Chang
Department of Physics, National Taiwan University, Taipei
A. Chen
National Central University, Chung-li
K.-F. Chen
Department of Physics, National Taiwan University, Taipei
B. G. Cheon
Hanyang University, Seoul
C.-C. Chiang
Department of Physics, National Taiwan University, Taipei
R. Chistov
Institute for Theoretical and Experimental Physics, Moscow
I.-S. Cho
Yonsei University, Seoul
Y. Choi
Sungkyunkwan University, Suwon
M. Dash
IPNAS, Virginia Polytechnic Institute and State University, Blacksburg, Virginia 24061
A. Drutskoy
University of Cincinnati, Cincinnati, Ohio 45221
W. Dungel
Institute of High Energy Physics, Vienna
S. Eidelman
Budker Institute of Nuclear Physics, Novosibirsk
Novosibirsk State University, Novosibirsk
D. Epifanov
Budker Institute of Nuclear Physics, Novosibirsk
Novosibirsk State University, Novosibirsk
N. Gabyshev
Budker Institute of Nuclear Physics, Novosibirsk
Novosibirsk State University, Novosibirsk
P. Goldenzweig
University of Cincinnati, Cincinnati, Ohio 45221
H. Ha
Korea University, Seoul
J. Haba
High Energy Accelerator Research Organization (KEK), Tsukuba
B.-Y. Han
Korea University, Seoul
H. Hayashii
Nara Women’s University, Nara
M. Hazumi
High Energy Accelerator Research Organization (KEK), Tsukuba
Y. Horii
Tohoku University, Sendai
Y. Hoshi
Tohoku Gakuin University, Tagajo
W.-S. Hou
Department of Physics, National Taiwan University, Taipei
Y. B. Hsiung
Department of Physics, National Taiwan University, Taipei
H. J. Hyun
Kyungpook National University, Taegu
T. Iijima
Nagoya University, Nagoya
K. Inami
Nagoya University, Nagoya
A. Ishikawa
Saga University, Saga
H. Ishino
[
Tokyo Institute of Technology, Tokyo
Y. Iwasaki
High Energy Accelerator Research Organization (KEK), Tsukuba
N. J. Joshi
Tata Institute of Fundamental Research, Mumbai
D. H. Kah
Kyungpook National University, Taegu
H. Kaji
Nagoya University, Nagoya
J. H. Kang
Yonsei University, Seoul
H. Kawai
Chiba University, Chiba
T. Kawasaki
Niigata University, Niigata
H. Kichimi
High Energy Accelerator Research Organization (KEK), Tsukuba
H. J. Kim
Kyungpook National University, Taegu
H. O. Kim
Kyungpook National University, Taegu
S. K. Kim
Seoul National University, Seoul
Y. I. Kim
Kyungpook National University, Taegu
Y. J. Kim
The Graduate University for Advanced Studies, Hayama
K. Kinoshita
University of Cincinnati, Cincinnati, Ohio 45221
B. R. Ko
Korea University, Seoul
S. Korpar
University of Maribor, Maribor
J. Stefan Institute, Ljubljana
P. Križan
Faculty of Mathematics and Physics, University of Ljubljana, Ljubljana
J. Stefan Institute, Ljubljana
P. Krokovny
High Energy Accelerator Research Organization (KEK), Tsukuba
A. Kuzmin
Budker Institute of Nuclear Physics, Novosibirsk
Novosibirsk State University, Novosibirsk
Y.-J. Kwon
Yonsei University, Seoul
S.-H. Kyeong
Yonsei University, Seoul
J. S. Lange
Justus-Liebig-Universität Gießen, Gießen
M. J. Lee
Seoul National University, Seoul
S. E. Lee
Seoul National University, Seoul
T. Lesiak
H. Niewodniczanski Institute of Nuclear Physics, Krakow
T. Kościuszko Cracow University of Technology, Krakow
J. Li
University of Hawaii, Honolulu, Hawaii 96822
A. Limosani
University of Melbourne, School of Physics, Victoria 3010
S.-W. Lin
Department of Physics, National Taiwan University, Taipei
Y. Liu
Nagoya University, Nagoya
D. Liventsev
Institute for Theoretical and Experimental Physics, Moscow
R. Louvot
École Polytechnique Fédérale de Lausanne (EPFL), Lausanne
F. Mandl
Institute of High Energy Physics, Vienna
A. Matyja
H. Niewodniczanski Institute of Nuclear Physics, Krakow
S. McOnie
University of Sydney, Sydney, New South Wales
H. Miyata
Niigata University, Niigata
Y. Miyazaki
Nagoya University, Nagoya
R. Mizuk
Institute for Theoretical and Experimental Physics, Moscow
T. Mori
Nagoya University, Nagoya
Y. Nagasaka
Hiroshima Institute of Technology, Hiroshima
E. Nakano
Osaka City University, Osaka
M. Nakao
High Energy Accelerator Research Organization (KEK), Tsukuba
S. Nishida
High Energy Accelerator Research Organization (KEK), Tsukuba
O. Nitoh
Tokyo University of Agriculture and Technology, Tokyo
S. Noguchi
Nara Women’s University, Nara
S. Ogawa
Toho University, Funabashi
T. Ohshima
Nagoya University, Nagoya
S. Okuno
Kanagawa University, Yokohama
H. Ozaki
High Energy Accelerator Research Organization (KEK), Tsukuba
P. Pakhlov
Institute for Theoretical and Experimental Physics, Moscow
G. Pakhlova
Institute for Theoretical and Experimental Physics, Moscow
C. W. Park
Sungkyunkwan University, Suwon
H. Park
Kyungpook National University, Taegu
H. K. Park
Kyungpook National University, Taegu
K. S. Park
Sungkyunkwan University, Suwon
R. Pestotnik
J. Stefan Institute, Ljubljana
L. E. Piilonen
IPNAS, Virginia Polytechnic Institute and State University, Blacksburg, Virginia 24061
A. Poluektov
Budker Institute of Nuclear Physics, Novosibirsk
Novosibirsk State University, Novosibirsk
H. Sahoo
University of Hawaii, Honolulu, Hawaii 96822
Y. Sakai
High Energy Accelerator Research Organization (KEK), Tsukuba
O. Schneider
École Polytechnique Fédérale de Lausanne (EPFL), Lausanne
C. Schwanda
Institute of High Energy Physics, Vienna
A. Sekiya
Nara Women’s University, Nara
K. Senyo
Nagoya University, Nagoya
M. E. Sevior
University of Melbourne, School of Physics, Victoria 3010
C. P. Shen
University of Hawaii, Honolulu, Hawaii 96822
J.-G. Shiu
Department of Physics, National Taiwan University, Taipei
B. Shwartz
Budker Institute of Nuclear Physics, Novosibirsk
Novosibirsk State University, Novosibirsk
J. B. Singh
Panjab University, Chandigarh
S. Stanič
University of Nova Gorica, Nova Gorica
M. Starič
J. Stefan Institute, Ljubljana
T. Sumiyoshi
Tokyo Metropolitan University, Tokyo
M. Tanaka
High Energy Accelerator Research Organization (KEK), Tsukuba
G. N. Taylor
University of Melbourne, School of Physics, Victoria 3010
Y. Teramoto
Osaka City University, Osaka
T. Tsuboyama
High Energy Accelerator Research Organization (KEK), Tsukuba
S. Uehara
High Energy Accelerator Research Organization (KEK), Tsukuba
T. Uglov
Institute for Theoretical and Experimental Physics, Moscow
Y. Unno
Hanyang University, Seoul
S. Uno
High Energy Accelerator Research Organization (KEK), Tsukuba
Y. Usov
Budker Institute of Nuclear Physics, Novosibirsk
Novosibirsk State University, Novosibirsk
G. Varner
University of Hawaii, Honolulu, Hawaii 96822
K. E. Varvell
University of Sydney, Sydney, New South Wales
K. Vervink
École Polytechnique Fédérale de Lausanne (EPFL), Lausanne
A. Vinokurova
Budker Institute of Nuclear Physics, Novosibirsk
Novosibirsk State University, Novosibirsk
C. H. Wang
National United University, Miao Li
M.-Z. Wang
Department of Physics, National Taiwan University, Taipei
P. Wang
Institute of High Energy Physics, Chinese Academy of Sciences, Beijing
X. L. Wang
Institute of High Energy Physics, Chinese Academy of Sciences, Beijing
Y. Watanabe
Kanagawa University, Yokohama
R. Wedd
University of Melbourne, School of Physics, Victoria 3010
E. Won
Korea University, Seoul
B. D. Yabsley
University of Sydney, Sydney, New South Wales
Y. Yamashita
Nippon Dental University, Niigata
C. Z. Yuan
Institute of High Energy Physics, Chinese Academy of Sciences, Beijing
Z. P. Zhang
University of Science and Technology of China, Hefei
V. Zhilich
Budker Institute of Nuclear Physics, Novosibirsk
Novosibirsk State University, Novosibirsk
V. Zhulanov
Budker Institute of Nuclear Physics, Novosibirsk
Novosibirsk State University, Novosibirsk
T. Zivko
J. Stefan Institute, Ljubljana
A. Zupanc
J. Stefan Institute, Ljubljana
O. Zyukova
Budker Institute of Nuclear Physics, Novosibirsk
Novosibirsk State University, Novosibirsk
Abstract
We study transitions between states with the emission of
charged pions using 604.6 fb-1 of data collected
with the Belle detector at the KEKB asymmetric-energy collider.
The measured product branching fraction is
and the partial decay width is
keV.
pacs:
13.25.Gv, 14.60.Ef, 14.40.Aq
The bottomonium state has a mass above the
threshold for pair
production and decays mainly into -meson pairs
( PDG ).
Recently, the decay modes
with
as well as etab
have been also observed.
These decays as well as the anomalously large width of the
(
transitions discovered by Belle u5s give additional information
about various QCD models
that are used to describe hadronic transitions
of heavy quarkonia theory .
Preliminary evidence for the decay
was presented
by the Belle Collaboration in Ref. prel .
The BABAR Collaboration reported measurements of the
transition to the or
with the emission of a pair BaBar ; etab .
The first Belle measurements of
were published in
Ref. 4S .
The product branching fraction
from Belle differs by 2.4 standard
deviations from
the correponding value from BABARetab .
In this paper we present
a new study of the decay mode
from the Belle experiment using a larger data sample
and relaxed signal selection criteria.
We use 604.6 fb-1 of data collected on the resonance
with the Belle detector Belle at the KEKB asymmetric-energy
collider KEKB .
We study
decays with
a subsequent transition.
Charged particles are reconstructed and identified
in the Belle detector, which
consists of a silicon vertex detector (SVD),
central drift chamber (CDC),
aerogel threshold Cherenkov counters (ACC),
time-of-flight (TOF) scintillation counters,
an electromagnetic calorimeter (ECL),
and a -muon detector (KLM).
Charged tracks must originate from within a region of radius
and axial length centered in the
interaction point and not be associated
with a well-reconstructed meson, baryon, or converted photon;
each charged track should have a momentum
transverse to the beam axis ()
of greater than 0.1 GeV/.
Charged particles are assigned
a likelihood MUID ( = , , )
based on the matching of hits in
the KLM to the track extrapolated from the CDC, and identified as
muons if the likelihood ratio exceeds 0.8,
corresponding to a muon detection efficiency of approximately 91.5%
over the polar angle range
and the momentum range
in the laboratory frame. Electron identification uses a similar likelihood
ratio EID based on CDC, ACC, and ECL information.
Charged particles that are not identified as muons
and have a likelihood ratio 0.1 are treated as pions.
Calorimeter clusters not associated with reconstructed charged tracks
and with energies greater than 50 MeV
are classified as photon candidates.
Candidates for
decays with the subsequent
leptonic decay
are selected from the standard hadronic-event sample
for the first data set (sample I),
while an additional -enriched sample is also
used for the remaining data set (sample II).
The relevant selection criteria for the standard hadronic-event sample
are the following: three or more charged tracks;
a visible energy of at least , where
is the center-of-mass (c.m.) energy;
a calorimeter energy deposit in the range
;
and a maximum of for the magnitude of ,
the sum of the components of the momenta of each charged track
and neutral cluster, where the axis is defined to be the direction
opposite to the positron beam.
The variables , , and
are evaluated in the c.m. system.
Unfortunately, the hadronic event sample criterion
rejects a considerable fraction of our
signal events.
However, some of these lost events are recovered in the
-enriched sample because it
has a loose constraint on the variable
(GeV).
Only the newest -enriched data are used because the earlier subset
included a requirement
on the sum of the magnitudes of the charged
track momenta
in the c.m. frame (below ) that rejected most of our signal.
Other selection criteria for the -enriched sample,
while not critical for this study, are enumerated below.
The number of charged tracks in an event
should be greater than one and less than nine with zero net charge.
The maximum among the tracks is
required to be greater than 0.5 GeV/.
Beam-related background is rejected by requiring that the position
of the reconstructed event vertex be less than 1 cm from the
interaction point (IP)
in the transverse direction and less than 3 cm from the IP
along the beam direction.
To suppress background from Bhabha and events,
the maximum opening angle between charge tracks is required to be less
than in the CM frame.
To select decays,
an event is required to contain exactly four charged tracks
with a pair having an invariant
mass above
and a pair whose opening angle
in the laboratory frame satisfies .
The latter criterion suppresses the radiative return process rad as well as
wherein the photon converts to
an pair that is misidentified as a pion pair.
Poorly reconstructed events are discarded by requiring a visible energy
in the laboratory frame of
.
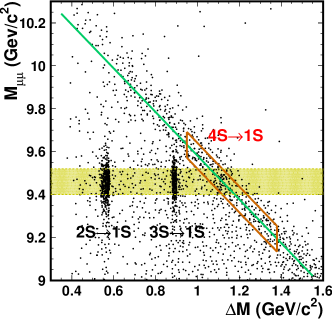
To identify parent resonances that decay into the
final state,
the distribution of vs. the mass difference
is examined (see Fig. 1) for the selected data sample.
The cluster of events in the parallelogram centered
at ()
= (1.12, 9.46) GeV/ is from the transition
.
The other clusters are due to the decays
and
, where
the and are produced predominantly
by radiative return i.e.
.
Figure 1: The vs. distribution for the candidate events.
The 60-MeV high horizontal shaded band is centered
on the nominal mass.
The clusters on the lower left correspond to
and
transitions.
The diagonal line indicates the kinematic boundary
.
The parallelogram straddling this line defines the fitting region for
candidates.
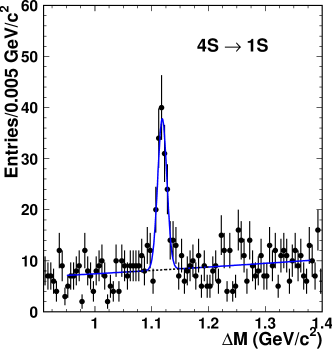
Figure 2: The fit to the distribution
for events within the parallelogram of Fig. 1
using a Gaussian for the signal
and a second-order polynomial for the background (dotted line).
The solid curve shows the sum of the Gaussian and the polynomial function.
The rightmost cluster in Fig. 1 contains events from the process
.
The dominant background processes,
(),
, and
,
accumulate at the kinematic boundary indicated by the diagonal line
in Fig. 1.
To capture the signal
as well as estimate this background more reliably, we fit the distribution
of for events within the parallelogram of Fig. 1,
whose boundaries correspond to
and
.
The fit, shown in Fig. 2, includes a Gaussian for the signal
and a quadratic function for the background. The fitted Gaussian is
centered at ,
which is in good agreement with the nominal
mass difference,
and has a width of ,
which is consistent with the detector’s estimated
resolution.
The signal yield in the interval
,
determined as the difference of the number of events and the
fitted background
in this interval, is ,
with a statistical significance of ,
corresponding to
with three fit parameters (mass, width, and yield).
Here, and
are the likelihood values returned by the fit with
the signal yield fixed at zero and its best fit value,
respectively.
Additional information can be obtained from the study of the
system.
Background-subtracted and efficiency-corrected
distribution of invariant mass ()
is shown in Fig. 3 for events within the signal subregion
()
of the parallelogram in Fig. 1.
(The background is estimated from the sideband subregion
and
).
The EvtGen event generator EvtGen
with a matrix element that accounts for particle spins Brown ,
is used to produce events
that are then passed through the detector
simulation geant3 and reconstruction programs.
Figure 3: Background-subtracted and efficiency-corrected
distribution of invariant mass ()
for events within the signal
subregion of the parallelogram in Fig. 1. The solid curve
shows the distribution predicted
by the models of Ref. Brown .
The distribution in Fig. 3 can be described
using the shape predicted
by the models of Ref. Brown ,
in which suppression of small
invariant masses follows from partial conservation of axial current.
The goodness of fit, for 10 degrees of freedom (NDF), is
.
The branching fraction for the
decay is determined from
,
where is the extracted signal yield,
is the estimated number of events produced,
is the signal detection efficiency (calculated separately
for samples I and II), and
is the PDG-tabulated
branching fraction for the daughter decay. The efficiencies are
calculated from Monte Carlo simulations.
For the hadronic-event simulation in sample I,
we apply a correction to ,
one of the variables used to select hadronic events, so that
this distribution agrees with that of the data. This correction
is also applied to sample II, where it changes
the efficiency by a few per cent. The results are given in Table I.
Table 1: Total number of (), signal yield (),
reconstruction efficiency (), and branching fraction () for the
decay.
Data sample
,
,
%
,
I
534.67.0
52.210.7
4.5
0.860.18
II
122.11.4
61.312.1
25.1
0.840.17
The systematic error in the reconstruction efficiency
due to the last correction is 8% for sample I
and essentially zero for sample II.
The systematic uncertainty in the reconstruction efficiency
due to lack of knowledge of the
decay matrix element
is estimated by comparing the parameterization of the
distribution in the models of Ref. Brown and in a phase space model.
We estimate this systematic uncertainty as half
of the variation in the efficiency, and it is equal to 2.0%(3.1%);
here and below, the first(second) value gives the systematic uncertainty
for sample I (sample II).
The signal yield is extracted by an unbinned extended maximum
likelihood fit to the
distribution for events in the parallelogram (Fig.1)
using a Gaussian for the signal
and a second-order polynomial for the background.
The signal yield in the signal interval
is determined as the difference of the number of events and the
fitted background in this interval.
The signal yield from the fitted Gaussian area has a larger statistical error.
The systematic uncertainties from the discrepancies between these
two evaluations of the signal yield are 2.2% and 1.2%
for samples I and II, respectively.
Other systematic uncertainties come from the
choice of the fit range (0.3%, 2.5%),
the choice of the signal range (2%, 0.6%),
the choice of the signal box width (2.4%, 1.9%),
the change of the order of the polynomial function from two
to one (0.5%, 1.2%),
the tracking efficiency (4%, 4%),
the muon identification efficiency (1.1%, 1.1%),
the pion identification efficiency (0.2%, 0.2%),the statistical uncertainty in the efficiency(1.0%, 0.6%),
the uncertainty in the
decay branching fraction (2.0%, 2.0%), and
the total number of events
(1.3%, 1.1%).
The total systematic uncertainty for each data sample
is obtained by adding these contributions in quadrature;
the results are 10.3% and 6.6%
for samples I and II, respectively.
The systematic uncertainties from the tracking efficiency,
counting, ,
and muon and pion identification efficiencies are treated
as fully correlated systematic errors for samples I and II.
Other uncertainties are treated as uncorrelated errors.
First the weighted average of the uncorrelated uncertainties
is evaluated.
The total systematic uncertainty is obtained by adding
and remaining correlated uncertainties
in quadrature.
The measured weighted product branching fraction is
The branching fraction is
0.06(sys.))
We also extract the partial decay width for the
transition
using the world-average value of the total
width PDG , and obtain
The measured values of
and
supersede our previous results 4S with improved accuracy.
The new Belle results are compatible with those of BABARetab .
To summarize, a study of transitions between states
with the emission of charged pions has been performed at Belle.
The peak at is
interpreted as a signal for the decay
with a subsequent transition.
The branching fraction
and the partial decay width
are measured.
We have not studied the
decay because criteria applied to
the raw experimental data make our sensitivity to this decay limited.
We thank the KEKB group for the excellent operation of the
accelerator, the KEK cryogenics group for the efficient
operation of the solenoid, and the KEK computer group and
the National Institute of Informatics for valuable computing
and SINET3 network support. We acknowledge support from
the Ministry of Education, Culture, Sports, Science, and
Technology (MEXT) of Japan, the Japan Society for the
Promotion of Science (JSPS), and the Tau-Lepton Physics
Research Center of Nagoya University;
the Australian Research Council and the Australian
Department of Industry, Innovation, Science and Research;
the National Natural Science Foundation of China under
contract No. 10575109, 10775142, 10875115, and 10825524;
the Department of Science and Technology of India;
the BK21 program of the Ministry of Education of Korea,
the CHEP SRC program and Basic Research program (grant
No. R01-2008-000-10477-0) of the
Korea Science and Engineering Foundation;
the Polish Ministry of Science and Higher Education;
the Ministry of Education and Science of the Russian
Federation and the Russian Federal Agency for Atomic Energy;
the Slovenian Research Agency; the Swiss
National Science Foundation; the National Science Council
and the Ministry of Education of Taiwan; and the U.S. Department of Energy.
This work is supported by a Grant-in-Aid from MEXT for
Science Research in a Priority Area (“New Development of
Flavor Physics”), and from JSPS for Creative Scientific
Research (“Evolution of Tau-lepton Physics”).
References
(1)
(2)C. Amsler et al. (Particle Data Group),
Phys. Lett. B 667, 1 (2008).
(3)B. Aubert et al. (BABAR Collaboration),
Phys. Rev. D 78, 112002 (2008).
(4)K.-F. Chen et al. (Belle Collaboration),
Phys. Rev. Lett. 100, 112001 (2008).
(5)E. Eichten et al., Rev. Mod. Phys. 80, 1161 (2008);
Y.P. Kuang, Front. Phys. China 1, 19 (2006);
Yu.A. Simonov, JETP Lett. 87, 147 (2008);
C. Meng and K.T. Chao, Phys. Rev. D 77, 074003 (2008).
(6)K. Abe et al. (Belle Collaboration),
arXiv:hep-ex/0512034.
(7)B. Aubert et al. (BABAR Collaboration),
Phys. Rev. Lett. 96, 232001 (2006).
(8)A. Sokolov et al. (Belle Collaboration),
Phys. Rev. D 75, 071103 (2007).
(9)A. Abashian et al. (Belle Collaboration),
Nucl. Instrum. Methods Phys. Res., Sect. A 479, 117 (2002).
(10)S. Kurokawa and E. Kikutani,
Nucl. Instrum. Methods Phys. Res., Sect. A 499, 1 (2003), and other papers
included in this volume.
(11)A. Abashian et al. (Belle Collaboration),
Nucl. Instrum. Methods Phys. Res., Sect. A 491, 69 (2002).
(12)K. Hanagaki et al.,
Nucl. Instrum. Methods Phys. Res., Sect. A 485, 490 (2002).
(13)M. Benayoun et al.,
Mod. Phys. Lett. A 14, 2605 (1999).