Quadrupole Moments of Neutron-Deficient 20,21Na
Abstract
The electric-quadrupole coupling constant of the ground states of the proton drip line nucleus 20Na( = 2+, = 447.9 ms) and the neutron-deficient nucleus 21Na( = 3/2+, = 22.49 s) in a hexagonal ZnO single crystal were precisely measured to be kHz and 939 14 kHz, respectively, using the multi-frequency -ray detecting nuclear magnetic resonance technique under presence of an electric-quadrupole interaction. A electric-quadrupole coupling constant of 27Na in the ZnO crystal was also measured to be kHz. The electric-quadrupole moments were extracted as Na) = 10.3 0.8 fm2 and Na) = 14.0 1.1 fm2, using the electric-coupling constant of 27Na and the known quadrupole moment of this nucleus as references. The present results are well explained by shell-model calculations in the full -shell model space.
keywords:
20Na , 21Na , Electric-coupling constant , Quadrupole moment , -ray detecting nuclear magnetic resonance , -ray detecting quadrupole resonance , Shell modelPACS:
21.10.Ky , 21.60.Cs , 27.30.+t , 29.27.Hj , 76.60.-k , 76.60.Gv, , , , , , , , , , and ,
1 Introduction
The spectroscopic electric-quadrupole moment () provides a direct measure of the deviation of the charge distribution in a nucleus from spherical symmetry and thus is sensitive to details of the nuclear wavefunction. is often used in tests of various theories, which attempt to reproduce experimental data. Shell-model calculations have been successful in predicting near the stability line in the nuclear chart, where the required effective interactions are well constrained by experimental data (for example, Ref. [1]). Proton and neutron effective charges are usually required in shell-model calculations to obtain . Within a given shell-model space, the effective charges represent 2, = 2+ excitations of the core nucleons to valence orbits [2] and reflect the virtual excitation of the isoscalar and isovector giant quadrupole resonances. Values of effective charges for -shell nuclei have been obtained from a systematic analysis of experimental 2 matrix elements [2, 3].
When moving away from stability, however, some nuclei show significant disagreement between experiment and theory. The neutron-rich B isotopes, for example, show a reduction of the neutron effective charge [4] because the loosely-bound valence neutrons, far removed from the core, have less probability to excite the core than well bound neutrons. Such variation of the neutron effective charge can also be seen in the neutron-rich 16N [5] and 18N [6]. Neutron-deficient nuclei, especially those with small proton separation energies, may also be expected to show variation of effective charges. One such example is the of neutron-deficient 37K [7], which requires an increased neutron effective charge and a decreased proton effective charge relative to the typical values of nuclei closer to stability in the shell. This is attributed to a substantial coupling to the isovector giant resonance beyond that indicated by the typical effective charges. Experimental of such neutron-deficient nuclei are still scarce, even in the shell. Additional systematic data of of neutron-deficient nuclei are important to further improve our knowledge of the exotic structure of drip line nuclei.
The of the neutron-rich Na isotopes have been measured via laser spectroscopy [8] and in -ray detecting nuclear magnetic resonance ( NMR) [9] experiments. Intrusion of the shell across the = 20 shell gap can be clearly seen in of ground states of neutron-rich Na isotopes beyond 29Na in the deviation between experiment and shell model calculations restricted to the -shell model space [10]. Improved agreement is realized in the Monte Carlo Shell Model approach, where both the - and -shell model spaces are considered [10]. Compared with the well studied neutron-rich Na isotopes, precise for the neutron-deficient Na isotopes are still lacking. The of the proton drip line nucleus 20Na( = 2+, = 447.9 ms) was reported in a figure in Ref. [11] but no experimental detail nor a value of was given. The of neutron-deficient nucleus 21Na( = 3/2+, = 22.49 s) disagrees with a shell-model calculation in the -shell model space [Na) = 11.6 fm2 (calculated using OXBASH shell model code [12]], although it has a large error [Na) = 6 3 fm2 (reevaluated value using Ref. [8, 13, 14])].
Na) and Na) have been precisely determined in this study using the multi-frequency -NMR technique under presence of an electric-quadrupole interaction. Preliminary results were reported in Ref. [15]. The systematic behavior of (Na) across the full neutron shell, including the present results of Na) and Na), is discussed.
2 EXPERIMENT
The experiments were performed at the radioactive beam facility ISAC-I at TRIUMF. The electric-quadrupole coupling constants, , of 20,21,27Na were measured in separate runs. The experimental procedure in the measurement of 20Na is explained below. Similar procedures were taken in the measurements of 21,27Na and the minor changes in conditions among the three measurements are summarized in Table 1. The 500 MeV proton beam from the TRIUMF cyclotron was used to bombard a thick SiC production target, which was coupled to a surface ion source. 20Na singly-charged ions were extracted at an energy of 40.8 keV and mass separated. The pure 20Na beam was transported to the polarizer beam line [16] in the ISAC-I experimental hall. The 20Na ions first passed through a Na vapor and were neutralized by charge exchange reactions. Collinear laser pumping was used to polarize the Na atoms by the D1 transition ( ) and circularly polarized light [17]. Both of the ground state hyperfine levels ( and ) were pumped to achieve high polarization (see Table 1) using side band frequencies produced by an electro-optic modulator (EOM), a technique that was successfully employed in the past [18]. The collinear laser light was generated by a Coherent 899-21 frequency-stabilized ring-dye-laser pumped by a 7-W argon-ion laser. The polarized atoms were then re-ionized in a He-gas target to be deflected to the -NMR station.
The polarized 20Na ions were delivered to the -NMR apparatus and implanted into a hexagonal ZnO single crystal. The implantation depth was 500Å. An external dipole-magnetic field of = 0.5286 0.0005 T was applied parallel to the direction of polarization to maintain the polarization in ZnO and to make the magnetic sublevels split (Zeeman splitting). The 20Na nucleus decays mainly to the first excited state in daughter nucleus 20Ne by emitting rays with a half-life of 447.9 ms. The maximum -ray energy is 11.23 MeV. rays from the stopped 20Na were detected by a set of plastic scintillation counters placed at 0∘(u) and 180∘(d) relative to the external field direction. The counting rate is asymmetric between u and d counters for a polarized source. The angular distribution,
| (1) |
depends on the asymmetry parameter , the polarization and the angle between the direction of the momentum of the ray emitted in the decay and the polarization axis. The for the decay of 20Na to the first excited state in 20Ne is = 1/3. The initial magnitude () and spin-lattice relaxation time () of the nuclear polarization of 20Na were measured in this study from the asymmetric -ray angular distribution. = 37 1% and = 9 0.5 s were obtained for 20Na in ZnO. The preliminary results of production of polarization were reported in Ref. [19]. The long relative to the half-life introduced virtually no significant loss of polarization in the NMR measurement.
The ZnO was chosen for implantation to measure because polarization of Na isotope is well maintained in the ZnO with long relaxation time [19] relative to their lifetimes. The ZnO had its c-axis set perpendicular to the external magnetic field. The electric-field gradient, , in ZnO is axially symmetric (asymmetry parameter ) and parallel to the c-axis. The Hamiltonian of the electromagnetic interaction between nuclear moments and external fields [20] in this condition is given by
| (2) |
where is the magnetic moment, is the magnetic field, is the nuclear spin and is the third component of the spin operator. The magnetic sublevel energies, , of the Na ions implanted in ZnO are given by
| (3) |
where is the magnetic quantum number, is the nuclear factor, is the normalized electric-quadrupole frequency and is the angle between the c-axis and the external magnetic field. Eq. (3) is given to first-order in , taking the electric-quadrupole interaction as a perturbation to the main magnetic interaction. The first term in Eq. (3) involves the magnetic sublevels separated by a fixed energy value due solely to the magnetic interaction (Zeeman splitting). These sublevels are further shifted by the electric-quadrupole interaction and the energy spacing between adjacent sublevels is no longer constant. The 2 separate transition frequencies that appear due to the electric-quadrupole interaction are determined as
| (4) |
The transition frequencies correspond to the energy difference between two adjacent levels in Eq. (3), since the allowed transitions have . Here is the Larmor frequency. Precise determination of is important for an accurate measurement of , since the 2 transition frequencies appear relative to the location of as seen in Eq. (4). The was measured in a cubic NaF single crystal in the present study, prior to the measurements. The use of the perturbation technique to obtain transition frequencies is justified for 21Na in ZnO and 27Na in ZnO because the perturbation condition, , is satisfied. On the other hand, for 20Na in ZnO, the Hamiltonian [Eq. (2)] was numerically solved to obtain transition frequencies because the perturbation technique cannot be applied, due to the condition .
An asymmetry change, , in the -decay angular distribution is obtained as the NMR signal:
| (5) |
The double ratio, , is defined by -ray countings, , as
| (6) |
where the subscript, off(on), stands for without(with) radio frequency (RF) applied. An adiabatic fast passage (AFP) method [21] was used in the RF application for NMR. AFP inverts the direction of initial polarization () and effectively doubles the signal size over a depolarization method for a more efficient NMR measurement.
The NMR signal can be maximized and therefore effectively searched by applying all the 2 transition frequencies in Eq. (4) in a short time period compared with the lifetime of the nucleus. Such application ensures a saturation of all transitions in Eq. (4) at . The NMR signal obtained for a nucleus with = 2 (as is the case for 20Na) in the AFP method with multiple transition frequencies is 20 times bigger than that obtained by applying a single transition frequency, where only a partial saturation of transitions can be achieved. In this comparison, a linear distribution of populations in is assumed as and , where is the population in and is a constant. This multi-frequency -NMR technique is discussed in detail elsewhere [22, 23].
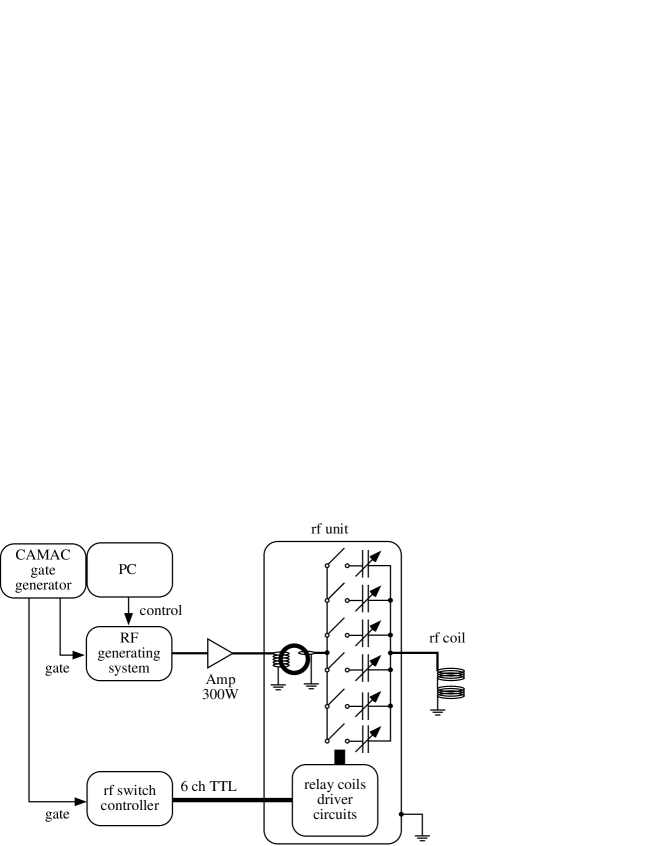
A schematic of the multi-frequency -NMR system is shown in Fig. 1. A computer controlled RF generating system produces an RF signal, which is sent to a 300 W amplifier. The amplified signal is applied to an RF coil, which is part of an LC resonance circuit. The circuit includes an impedance matching transformer and a bank of six selectable variable capacitors. After 10 ms RF time for 20Na, another frequency is generated by the RF generating system and sent to the same LC resonance circuit. A different capacitor, which has been tuned to the second frequency to satisfy the LC resonance condition, is selected by the fast switching relay system. The system ensures sufficient power for any set of four transition frequencies for 20Na ( = 2) over the expected search region of . The switching time between two signals is 3 ms.
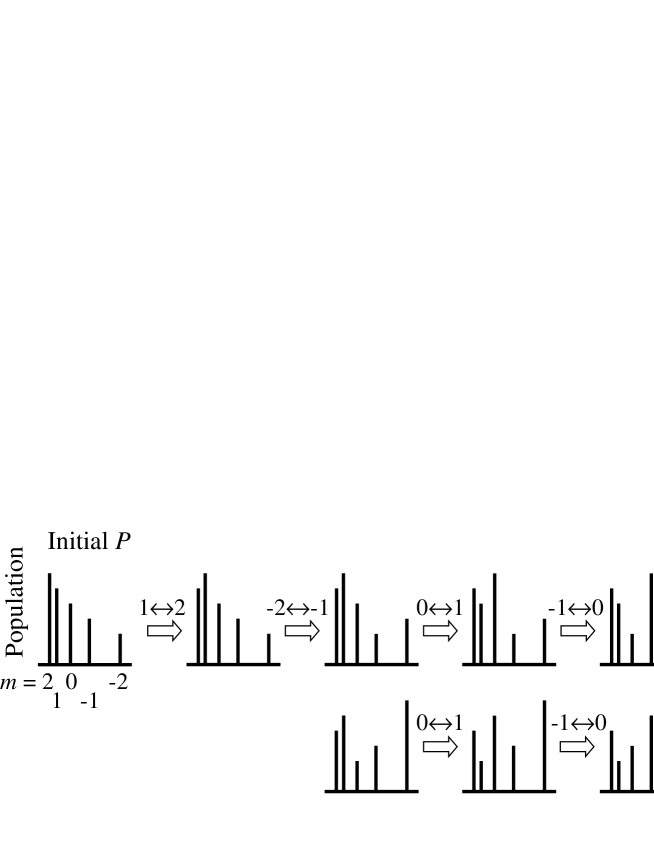
Since an RF corresponds to a transition of populations between adjacent and , the AFP interchanges the and . The total inversion of polarization () was achieved by applying RF as shown in Fig. 2 for 20Na ( = 2). After 10 sequential applications of transition frequencies, the direction of initial polarization is inverted, where is defined as . The typical inversion efficiency, defined by , was , where is the inverted polarization. Each applied RF was frequency modulated with a modulation width, FM = 20 kHz, for AFP. The FM is also to cover a certain region of for an effective search for resonance. The FM was swept only once in the RF time of 10 ms. An amplitude modulation was also applied to the RF for an efficient AFP. The oscillating magnetic field strength, , was 0.8 mT at the maximum. At the beginning (end) of the FM sweep, the was reduced to 0.02 mT and gradually increased (decreased) to the maximum (minimum) to avoid depolarization due to sudden start (stop) of the strong . A pulsed beam method was employed using a fast electrostatic kicker. A 500 ms implantation time was followed by the RF time and then by a 1 s -ray counting time. The sequence was repeated until a required statistics was achieved. A 10 s implantation time and 35 s counting time were used in the 21Na measurement. Only the first 5 s counting time was used to calculate the NMR signal of 21Na, because of the short relaxation time in ZnO compared with the lifetime of 21Na as noted in Table 1.
Multi-frequency -NMR spectra were measured both with a positive-helicity () and a negative-helicity () laser light. An NMR signal, 2, was defined as:
| (7) |
to maximizes the NMR signal obtained.
3 RESULTS
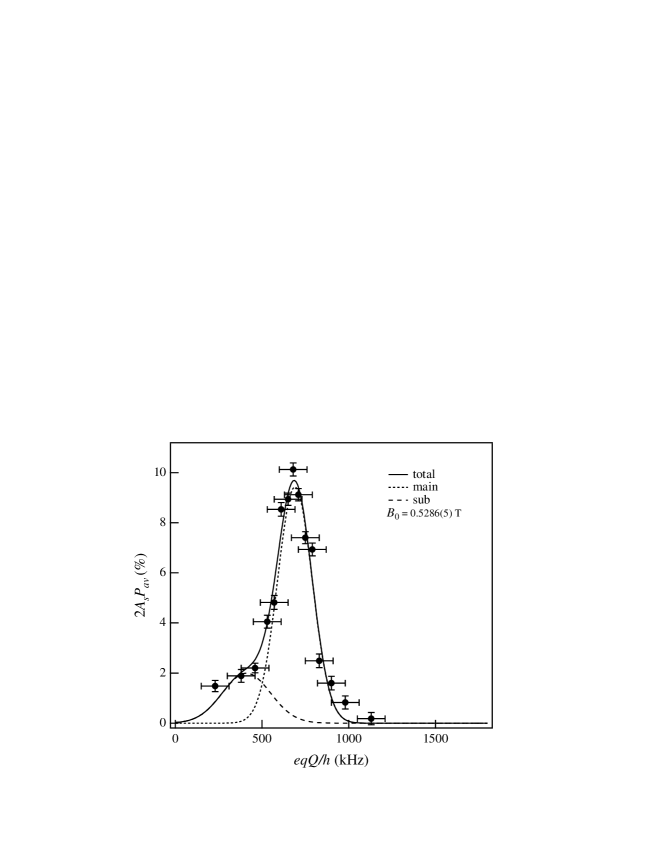
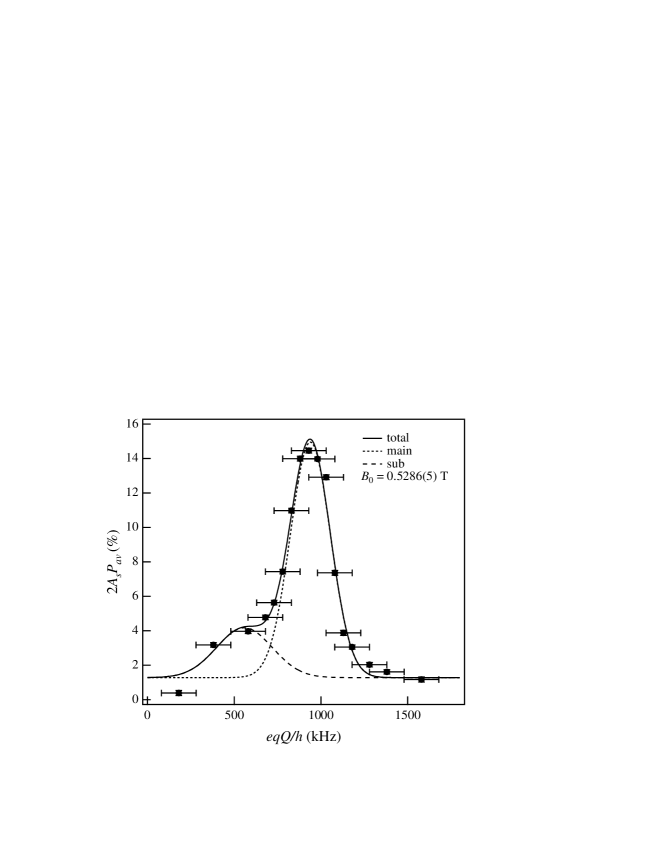
The multi-frequency -NMR spectra of 20Na and 21Na in ZnO are shown in Fig. 3 and 4, respectively. The solid circles are the experimental data and the horizontal bar on each point is the range of covered by the FM. There appears to be two final locations of Na ions in ZnO, where the crystal lattice provides a different electric-field gradient on Na. The resonance peak at higher is named “main” (the dotted line) and one at lower “sub” (the dashed line). The measurement of the sub resonance of 20Na in ZnO was incomplete as seen in Fig. 3, as no data points were taken below kHz. Therefore, the ratios of the centroids (namely the ratio of electric-field gradients), the amplitudes () and the line widths () between the main and sub resonances were taken from the fit of 21Na in ZnO. The central values of = 0.59 0.01, = 0.21 0.01 and = 1.4 0.1, where the subscripts and refer to sub and main, respectively, were used as fixed parameters in fitting of the 20Na resonance structure. A baseline shift of (1.3 0.1)% was observed in 2 in the spectrum of 21Na in ZnO [see Fig. 4]. This is because the transition between = 1/2 1/2 coincides with the Larmor frequency ( = 3/2) within the searched region of , where the first perturbation calculation is valid. As a result, the transition is always induced by RF, and 1/10 of the maximum 2 appears as a shift of baseline for nucleus, assuming a distribution of magnetic sublevel populations. The fit results give of the main resonances of 20Na and 21Na in ZnO:
| (8) | ||||
| (9) |
The second error is the systematic error in determining the centroid. Possible variations of the centroid due to the sub resonance were considered in the systematic error based on the errors of , and . One tenth of the was also included in the systematic error [24] for uncertainties caused by the line width of main resonance due to the FM. The latter dominates the present systematic error.
may be extracted from these together with an of a Na isotope in ZnO, whose is already known as the electric-field gradient is identical among Na isotopes. The of 27Na in ZnO was measured for this purpose. The is precisely known in a separate measurement as Na) = 0.72 0.03 fm2 [9]. The multi-frequency -NMR spectrum of 27Na in ZnO is shown in Fig. 5. Since the is small, the main and sub resonances were not resolved. The fitting of a two-component Gaussian was performed, following the same procedure as outlined previously for the analysis of 20Na in ZnO. The transition between = 1/2 1/2 was always induced ( = 5/2) by RF. The expected NMR effect by the transition is 3/100 of the maximum 2, therefore the baseline of the Gaussians was fixed to 2 = 0% in the fitting, which introduced no significant systematic error. The centroid of the fit gives the of main resonance of 27Na in ZnO:
| (10) |
Possible variations of the centroid, due to the sub resonance as well as a one tenth of the were included in the systematic error. The of Na isotope with a mass number can now be extracted as
| (11) |
4 DISCUSSION
The present Na) is consistent with and as precise as the previous report [11] measured by the -NMR technique. The experimental Na) is well confirmed. The present Na) is not consistent though more precise than the previous value, Na) = 6 3 fm2. The previous Na) was obtained from the hyperfine coupling constant of the 3 state in 21Na ( = 1.5 0.8 MHz). The value of was a reevaluated value using the hyperfine splitting of 3 state in 21Na ( MHz [8]), the latest values of the hyperfine coupling constant of 23Na ( = 18.534 0.015 MHz [13]), and of 23Na (Na) = 10.6 0.1 fm2 [14]). The large error in the previous Na) is due to the large error in , which is essentially a systematic error caused by the detuning of the laser frequency from the exact resonance [8]. The deviation between present and previous Na) may reside in the systematic error. It is noted that the similar discrepancy between measured by -NMR [9] and optical [8] technique is systematically seen in other Na isotopes, which was shown in Fig. 5 of Ref. [9] and also in Fig. 6.
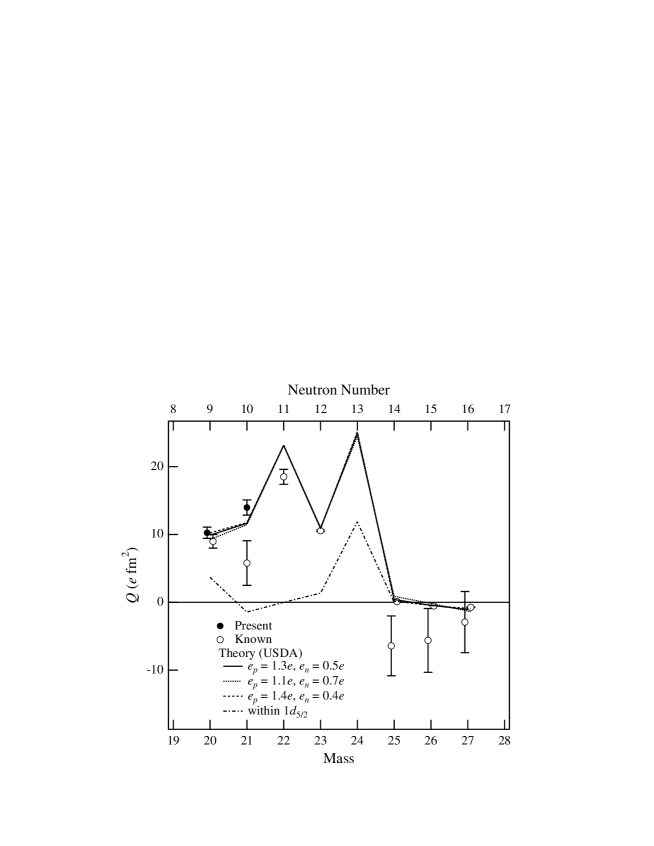
Theoretical calculations were performed using OXBASH shell model code [12] in the full -shell model space from = 20 to 27 with the USDA interaction [1] and Woods-Saxson single-particle wave functions. Calculations above = 28 were not included, although are known up to = 31 [11, 25]. The contribution from 2p-2h intruder configuration across the = 20 shell gap becomes important above 29Na, and these nuclei therefore do not compare well with shell-model calculations in the -shell model space [10]. Theoretical were calculated with , where is the bare of the proton (neutron) distribution and and are the effective charges for protons and neutrons, respectively. Values of = 1.3 and = 0.5 were used for the shell-model results. These effective charges are typical for shell nuclei [2, 3]. The results of theoretical calculations and experiments are summarized in Table 3 and shown in Fig. 6, where signs of present results (the solid circles) were taken from the calculations. Calculations with the USD [29] or the USDB [1] interactions gave results within the expected theoretical uncertainty and therefore only the results of the calculations performed with USDA interaction are discussed here.
The general trend of of 20-27Na isotopes is well reproduced by the shell-model calculations. In particular, the of the neutron-deficient nucleus 21Na and even of the proton drip line nucleus 20Na are approximately accounted for by the USDA interaction [1], which is determined by fitting energy levels of only neutron-rich nuclei in the shell. The present Na) reconciles the discrepancy between the previous Na) and the theoretical calculation, and completes the account of the systematic behavior of of Na isotopes across the neutron 1 and 2 shells except Na), which is not measured yet.
No variation of effective charges were required to realize agreement between the shell-model calculations in the -shell model space and experiment. This was most surprising for the case of 20Na, which lies at the proton drip line. Nuclei adjacent to both the proton and neutron drip lines have been shown to require significantly different and values to reproduce experimental . The neutron-rich B isotopes, as discussed in section 1, show a reduction of the neutron effective charge [4] and neutron-deficient nucleus 37K requires an increased neutron effective charge and a decreased proton effective charge [7].
The isovector part, , of effective charges was varied to investigate its contribution to the present , keeping the isoscalar part, , the same as the one determined from the 2 matrix elements between low-lying states [3], which are sensitive to the but less sensitive to the . Here and are defined as and . In Fig. 6, the dashed line is calculated with = 1.4, = 0.4 and the dotted line with = 1.1, = 0.7. Only a slight variation can be seen for Na). The of Na isotopes are not sensitive to the variation of the within the experimental errors but mainly determined by the . The result indicates that the collective behavior of protons and neutrons dominate the of Na isotopes. This is also implied by the similar value of proton- and neutron-bare quadrupole moments of each Na isotopes listed in Table 3.
Results of shell-model calculations from = 20 to 25 with valence nucleons restricted in the 1 shell are shown in Fig. 6 in the dotted-dashed line. In the calculation, the USDA interaction and Woods-Saxson single-particle wave functions were used. The calculated are systematically smaller than experimental values and indicate an importance to include the 2 and 1 shells for configuration mixing within the -shell model space. By including the 2 and 1 shells in the calculation, each component of the wave function contributes coherently to and adds up to the theoretical , which is discussed above and shown in the solid line in Fig. 6. This is again an indication of the collective nature of of Na isotopes ( = 20 24). The small of 25,26,27Na are well explained in the framework of the single-particle picture as follows. The 3 valence protons, occupying half the 1 shell, yield zero [30]. The 6 neutrons in 25Na, that fully occupies the 1 shell, couples to 0+ and the 7th and 8th valence neutrons in 26,27Na occupy the 2 shell.
A ratio of between 20Na and 21Na can be precisely determined from the present [Eqs. (8) and (9)] without any ambiguities, possibly caused by the extraction of [Eq. (10)] and Na) [9]:
| (14) |
The ratio clearly indicates that the Na) is larger than Na). The ratio is consistent with the trend of the predicted by shell-model as seen in Fig. 6, whereas the previous experimental values as well as the shell-model calculations with valence nucleons restricted in the 1 shell [the dotted-dashed line in Fig. 6] show the opposite trend. The present ratio of reconciles the disagreement, at least, in the trend of previous experimental and theoretical , and are not explained by the single-particle picture.
5 SUMMARY
Nuclear polarized beams produced by the optical pumping technique were used at ISAC/TRIUMF to determine the quadrupole moments of the proton drip line nucleus 20Na and the neutron-deficient nucleus 21Na. The electric-quadrupole coupling constants of 20Na and 21Na, implanted in a hexagonal ZnO single crystal, were measured to be = 690 12 kHz and = 939 14 kHz, respectively, using the multi-frequency -ray detecting nuclear magnetic resonance technique under presence of an electric-quadrupole interaction. An electric-quadrupole coupling constant of 27Na in ZnO was also measured as = 48.4 3.8 kHz. The quadrupole moments of 20Na and 21Na were deduced as = 10.3 0.8 fm2 and = 14.0 1.1 fm2, respectively, using the and known quadrupole moment of 27Na as references. The present Na) is consistent and as precise as the previous report. The present Na) is not consistent though more precise than the previous value (6 3 fm2) obtained from the hyperfine coupling constant measured by laser spectroscopy. Both of the preset are well reproduced by shell-model calculations in the full -shell model space with USDA interaction and using typical effective charges in the shell, and . The present Na) reconciles the deviation between the previous Na) and the theoretical calculation, and gives full account of systematic behavior of of Na isotopes across the neutron 1 and 2 shells except Na), which is not measured yet. The shell model shows that the collective behavior of protons and neutrons dominate present Na) and Na).
ACKNOWLEDGMENT
The authors would like to thank P. F. Mantica and B. A. Brown at NSCL/MSU for valuable discussions and are grateful to the TRIUMF staff. The study was supported in part by the 21th century COE program ’Towards a new basic science: depth and synthesis’. One of the authors (K. M. at NSCL/MSU) would like to thank the support from the National Science Foundation, Grant PHY06-06007.
References
- [1] B. A. Brown and W. A. Richter, Phys. Rev. C 67 (2006) 034315.
- [2] H. Sagawa and B. A. Brown, Nucl. Phys. A 430 (1984) 84.
- [3] B. A. Brown and B. H. Wildenthal, Ann. Rev. Nucl. Part. Sci. 38 (1988) 29.
- [4] H. Ogawa, et al., Phys. Rev. C 67 (2004) 064308.
- [5] K. Matsuta et al., Phys. Rev. Lett. 86 (2001) 3735.
- [6] H. Ogawa, et al., Phys. Lett. B 451 (1999) 11.
- [7] K. Minamisono,, et al., Phys. Lett. B 662 (2008) 389.
- [8] T. Touchard, et al., Phys. Rev. C 25 (1982) 2756.
- [9] M. Keim, et al., Eur. Phys. J. A 8 (2000) 31.
- [10] Y. Utsuno et al., Phys. Rev. C 70 (2004) 044307.
- [11] M. Keim, et al., ENAM98, AIP Conference Proceedings 455 (2000) 50.
- [12] B. A. Brown, et al., MSU-NSCL Report No. 1289.
- [13] Wo Yei, A. Sieradzan and M. D. Havey, Phys. Rev. A 48 (1993) 1909.
- [14] P. Jonsson, et al., Phys. Rev. A 53 (1996) 4021.
- [15] M. Ogura, et al., Hyperfine Interactions 159 (2005) 235.
- [16] C. D. P. Levy, et al., Nucl. Phys. A 701 (2002) 253c.
- [17] E. Arnold, et al., Phys. Lett. B 197 (1987) 311.
- [18] C. D. P. Levy, et al., Nucl. Instrum. Methods Phys. Res. B 204 (2003) 689.
- [19] K. Minamisono, et al., Hyperfine Interactions 159 (2004) 261.
- [20] A. Abragam, The Principles of Nuclear Magnetism, (Oxford University Press, Oxford, 1986) p. 232.
- [21] A. Abragam, The Principles of Nuclear Magnetism, (Oxford University Press, Oxford, 1986) p. 65.
- [22] T. Minamisono, et al., Hyperfine Interactions 80 (1993) 1315.
- [23] K. Minamisono, et al., Nucl. Instrum. Methods Phys. Res. A 589 (2008) 185.
- [24] T. Minamisono, et al., Phys. Lett. B 420 (1998) 31.
- [25] S. Wilbert, et al., ENAM98, AIP Conference Proceedings 455 (2000) 142.
- [26] Yu. P. Gangrsky, et al., Eur. Phys. J. A 3 (1998) 313.
- [27] N. J. Stone, At. Data Nucl. Data tables 90 (2005) 75.
- [28] K. Matsuta et al., J. Phys. Conf. Ser. 20 (2005) 169.
- [29] B. H. Wildenthal, Phys. Rev. C 28 (1983) 1343.
- [30] B. Castel and I. S. Towner, Modern Theories of Nuclear Moments, (Oxford University Press, Oxford, 1990) p. 188.

| 20Na | 21Na | 27Na | |
| 2+ | 3/2+ | 5/2+ | |
| (ms) | 447.9 | 22490 | 301 |
| (%) in ZnO | 37 1 | 29.7 0.4 | 39.9 2.5 |
| (s) in ZnO | 9.0 0.5 | 9.63 0.09 | 9.5 2.5 |
| (MeV) | 11.23 | 2.53 | 8.08 |
| (%) | 79.3 | 94.97 | 84.3 |
| +0.33 | +0.81 | -0.88 | |
| FM (kHz) | 20 | 50 | 20 |
| RF time (ms) | 10 | 20 | 10 |
| (mT) | 0.8 | 0.65 | 0.8 |
| # of transition freq. | 4 | 3 | 5 |
| # of RF for AFP | 10 | 6 | 15 |
| 20Na | 21Na | 27Na | |
|---|---|---|---|
| (kHz) | 48.4 2.4 3.0 | ||
| 19.4 1.6 | 1 | ||
| ( fm2) | 10.3 0.8 | 14.0 1.1 | 0.72 0.03 [9] |
| ( fm2) | 9 [11] | [8, 13, 14] | 0.72 0.03 [9] |
| ( fm2) [12] | +9.9 | +11.6 | 1.1 |
| ( fm2) | ( fm2) | |||
|---|---|---|---|---|
| 20Na | 6.4 | 3.1 | 9.9 | 10.3 0.8 |
| 9 1 [11] | ||||
| 21Na | 6.7 | 5.8 | 11.6 | 14.0 1.1 |
| 5.8 3.3 [8, 13, 14] | ||||
| 22Na | 12.9 | 12.9 | 23.2 | +18.5 1.1 [26] |
| 23Na | 5.9 | 6.5 | 10.9 | +10.6 0.1 [27] |
| 24Na | 14.4 | 12.3 | 24.9 | - |
| 25Na | 0.4 | 1.9 | 0.4 | 6.4 4.4 [8, 13, 14] |
| 0.10 0.04 [28] | ||||
| 26Na | 0.5 | 0.4 | 0.4 | 5.6 4.7 [8, 13, 14] |
| 0.53 0.02 [9] | ||||
| 27Na | 0.2 | 1.7 | 1.1 | 2.9 4.5 [8, 13, 14] |
| 0.72 0.03 [9] |