-Decay Half-Life of the -Process Waiting Point Nuclide 84Mo
Abstract
A half-life of 2.2 0.2 s has been deduced for the ground-state decay of 84Mo, more than 1 shorter than the previously adopted value. 84Mo is an even-even nucleus lying on the proton dripline, created during explosive hydrogen burning in Type I X-ray bursts in the rapid proton capture (rp) process. The effect of the measured half-life on rp-process reaction flow is explored. Implications on theoretical treatments of nuclear deformation in 84Mo are also discussed.
pacs:
23.40.-s, 21.10.Hw, 26.30.Ca, 26.50.+xI Introduction
I.1 The Astrophysical -Process
The present model for the -process begins with the accretion of hydrogen and helium rich matter onto neutron stars from nearby companion stars. Gravitational energy is released in the form of X-rays as matter reaches the intimate regions of the neutron star. The matter is compressed as it forms an accretion disk and travels through the gravitational field gradient towards the neutron star, which eventually results in thermonuclear burning. The -process is a sequence of (p,) reactions and subsequent decays up to 107,108Te Schatz (2004). The process begins at 41Sc, with the seed nuclei produced by a series of fast (,p) and (p,) reactions on CNO-cycle nuclei. The composition of the accreted matter governs the overall duration and peak temperature of the nuclear burning stage of X-ray bursts Schatz et al. (2001).
The -process circumstances prove plausible for the synthesis of stable isotopes on the proton-rich side of the nuclear chart (-nuclei) below . This is because the -process ashes are finally determined by decay from the proton-rich side of -stability Schatz et al. (2001). The observed abundances for the -nuclei 92,94Mo and 96,98Ru are currently at odds with abundance predictions using other solar production mechanisms Costa et al. (2000). The -process can produce these nuclei under certain circumstances, sustaining X-ray bursts as a possible contributor to their solar abundances. The amount of -process material emitted into the interstellar medium depends on the isotopic overproduction factor, the frequency of burst occurrences that produce -nuclei, and the fraction of material that escapes the gravitational field of the neutron star Boyd (2002). It has been pointed out that the high gravitational field in the vicinity of neutron stars hinders stellar ejection of all but the most energetic ash Weinberg et al. (2006). The bulk of nuclei synthesized in the -process would not escape the gravitational field. This limited mass ejection is a major drawback for the modeling of X-ray bursts. Nevertheless, the amount of ejected material is still being debated and the composition of material produced in an -process event relies on experimental data, and in instances where these data are lacking, nuclear structure models Jose (2005). The half-life of 84Mo is a necessary experimental parameter for modeling reaction flow above mass 84, and directly determines the amount of 84Sr formed during X-ray bursts.
I.2 Shape Deformation Along
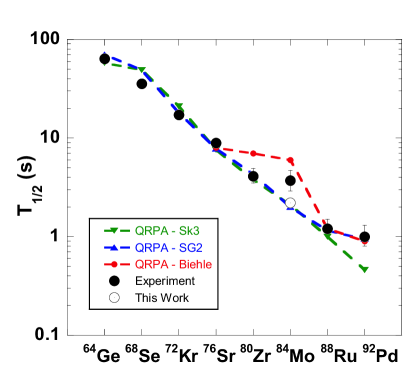
Deformed nuclei in general exhibit different single-particle level spacing and higher level densities than spherical nuclei. Single-particle levels, level densities and nuclear masses are important ingredients for calculating proton-capture rates and -decay half-lives Schatz et al. (1998). The ratio of the and yrast state energies can be used as an indicator of shape deformation in even-even nuclei, with a smaller value representing a less deformed nucleus Casten et al. (1993). The 4/2 trend for even-even nuclei along reveals a deformation maximum at 76Sr and 80Zr (see Fig. 1) Bucurescu et al. (1997); Mărginean et al. (2001); Mărginean (2004). A 4/2 ratio of 2.52 for 84Mo marks the beginning of a transition towards the believed spherical, doubly magic 100Sn.

Theoretical predictions for the -decay half-life of 84Mo within the Quasi-particle Random Phase Approximation (QRPA) vary from 2.0 s by Sarriguren et al. Sarriguren et al. (2005) to 6.0 s by Biehle et al. Biehle and Vogel (1992). Fig. 2 shows a comparison of the half-lives calculated by Sarriguren et al. (QRPA-Sk3, QRPA-SG2) and Biehle et al. (QRPA-Biehle) with experiment. The principle difference between these theoretical treatises is the set of nuclei used to calibrate the self-consistent interaction parameters for particle-particle coupling strength and nuclear deformation.
The QRPA-Biehle prediction relies on the nearby nuclei 88,90Mo, 92Ru, and 94Pd, which do not exhibit the same level (2.1 4/2 2.23) Kaptein et al. (1976); Kabadiyski et al. (1976); Lingk et al. (1997); Plettner et al. (2004) of deformation observed in the region near but approach spherical shapes, lengthening the predicted half-lives. The self-consistent parameters for the QRPA-Sk3 and QRPA-SG2 cases were derived from experimental data from nuclei in the region of interest, and mostly reproduce the experimental half-lives using self-consistent deformations that minimize the energy. The previously measured half-life of 84Mo reported by Kienle et al. Kienle et al. (2001) falls between the two calculations. This would imply a level of deformation unique to the mass region, perhaps inconsistent with the observed trend of measured ratios along even-even nuclei.
Recent re-measurements of the half-lives of 80Zr Ressler et al. (2000) and 91,92,93Rh Dean et al. (2004) are shown in Table 1. Each of these measurements are background suppressed by -ray gating and are systematically lower than those reported by Kienle et al. Kienle et al. (2001), at times by more than 1. A similarly shorter result for a 84Mo re-measurement would validate Sarriguren’s approach for nuclei in this region, and give consistency with the deformation implied by the measured .
| Nucleus | Jπ | T1/2 (s) 111Ref. Kienle et al. (2001). | -coincidence T1/2 (s) | |
|---|---|---|---|---|
| 80Zr | (0+) | 5.3 | 4.1 222Ref. Ressler et al. (2000). | |
| 93Rh | (9/2+) | 13.9 | 11.90.7 333Ref. Dean et al. (2004). | |
| 92Rh | (6+) | 5.6 | 4.660.25 333Ref. Dean et al. (2004). | |
| 91Rh | (9/2+) | 1.7 | 1.470.22 333Ref. Dean et al. (2004). |
II Experimental Procedure
Nuclei for this study were produced via fragmentation of 124Xe projectiles accelerated to 140 MeV/nucleon in the coupled K500 and K1200 cyclotrons at National Superconducting Cyclotron Laboratory. The 124Xe beam was impinged upon a 305 mg/cm2 9Be target. Fragments were transported through the A1900 Fragment Separator for separation Morrissey et al. (2003). The A1900 dipole settings were 1,2 = 2.9493 Tm, and 3,4 = 2.5635 Tm with a 180 mg/cm2 Al wedge placed at the intermediate image. Fragments within 0.5% of the central momentum were transported to the A1900 focal plane.
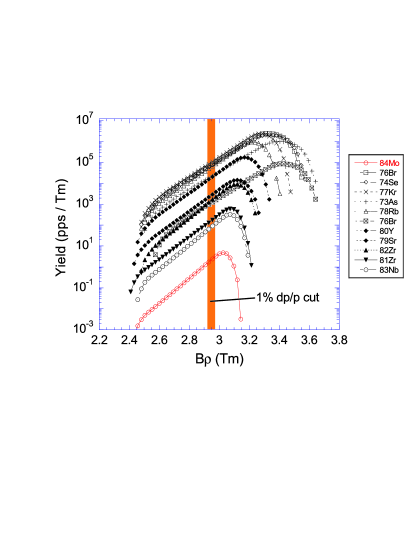
The momentum distributions of nuclei produced in intermediate-energy fragmentation reactions are asymmetric. In Fig. 3 is shown a simulation of yields as a function of for the principle isotopes produced in this study. The simulation was performed with the program LISE Tarasov and Bazin (2004). The production rates from the low-momentum tails of more stable species exceeds that of the exotic 84Mo such that a decay experiment would not be feasible without additional beam purification beyond that achieved with the A1900.
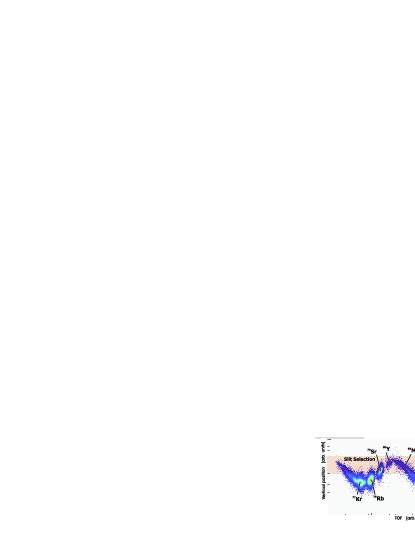
The new Radio Frequency Fragment Separator (RFFS) was implemented at NSCL to purify beams of neutron-deficient nuclei Gorelov et al. (2005). The device consists of two horizontally parallel plates 1.5 m long, 10 cm wide, and 5 cm apart. A time-varying electric field is applied across the plates with an amplitude up to 100 kV peak-to-peak. A voltage of 47 kV peak-to-peak was applied for this study. This field varied sinusoidally at a frequency of 23.145 MH, matched to the K1200 cyclotron. The time required for nuclei in the study to pass through the full 1.5-m length of the RFFS was roughly equal to 1/3 of a RF period. The Time-Of-Flight (TOF) separation of the beam species resulted in each fragment seeing a different 1/3 of the sinusoidal voltage cycle, and therefore receiving each a different vertical “kick”. A diagnostic box was located 6 m downstream of the RFFS exit and contained an adjustable slit system and particle-counting detectors. Two retractable parallel-plane avalanche counters (PPACs) were placed along the beam path, one upstream of the slit and the other downstream. The vertical deflection of the fragments at the slit position is presented in Fig. 4. The deflection range selected by the 10 mm slit gap is also indicated. The phase of the RFFS can be delayed relative to the cyclotron RF such that the fragment of interest appears at a trough, peak, or node of the sinusoid as desired.
| Rate111Rates normalized to 84Mo, 5 10-4 pps/pnA | ||||
| V = 0 kV | V = 47 kV | Rejection | Half-life | |
| 50 mm slit | 10 mm slit | Factor | ||
| 84Mo | 1 | 1 | 1 | s |
| 83Nb | 15 | 16 | 1 | s |
| 82Zr | 80 | 40 | 2 | s |
| 81Zr | 20 | 10 | 2 | s |
| 80Y | 130 | 200 | 0.6 | s |
| s | ||||
| 79Sr | 4000 | 85 | 47 | min |
| 78Rb | 18700 | 0.4 | 46700 | min |
| min | ||||
| 77Kr | 13500 | 0.3 | 45000 | min |
| 76Br | 1150 | 15 | 77 | h |
| s | ||||
| 74Se | 1980 | 5 | 400 | stable |
| 73As | 700 | 630 | 1.1 | d |
| Sum222Absolute rate in pps/pnA | 83 | 0.5 | 180 | |
| 0.8 pnA | 10 pnA | |||
Table 2 quantifies the overall and isotope specific rejection factors observed during this study. The table demonstrates the importance of distinguishing the device’s selective rejection rate as opposed to the overall rejection rate. Selective rejection of key contaminants 78Rb and 77Kr was of order 104, while the counting rate of the fragment of interest 84Mo was not affected. The overall rejection factor was 180. Fragments that passed through the RFFS slit system were delivered to the experimental end station for analysis.
The Beta Counting System (BCS) Prisciandaro et al. (2003) was used for event-by-event correlation of fragment implantations with their subsequent -decays. The system employed a Double-Sided Silicon Strip Detector (DSSD), a single 995 m 4 cm 4 cm silicon wafer segmented into 40 1-mm strips in both the x and y dimension, providing 1600 individual pixels. The high degree of segmentation and beam filtering were both necessary to realize an average time between implantations into a single pixel that exceeded the correlation time, which is set in software based on the expected half-life of the isotope of interest.
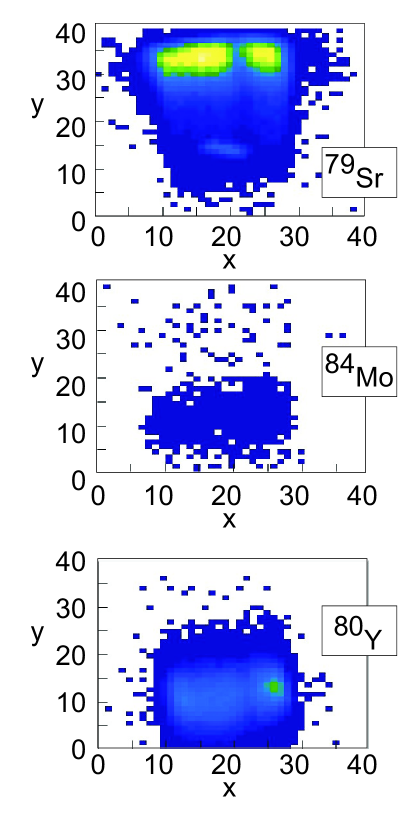
The distribution of 84Mo fragments on the surface of the DSSD is presented in Fig. 5. As noted above, background is controlled in the experiment by taking advantage of the high degree of segmentation of the DSSD. Here the 84Mo fragments are distributed over of the DSSD surface, and overlap in position most strongly with 80Y ions but not 79Sr ions, where 80Y and 79Sr are two of the three significant contaminants in the secondary beam. The other sizeable contaminant, 73As, will have minimal impact on the accurate correlation of 84Mo -decay events, since its half-life is of order days (see Table 2). The percentage of 84Mo implantations that were preceeded by a 80Y implantation in the same pixel was evaluated for the 10-s correlation time used to establish the decay curve for regression analysis as outlined below. These so-called “back-to-back” implantations occurred for % of the 84Mo implantation events, and were essentially distributed equally in time as the average time between implantations in a given pixel well exceeded the correlation time. The impact of the “back-to-back” 84Mo-80Y implantations is further mitigated by the fact that 80Y has two -decaying states as listed in Table 2. The isomeric state of 80Y decays with a half-life of s, and is a more significant contributor to the background analysis of the 84Mo decay than the longer-lived s ground state with Doring et al. (1999). decay of the isomeric state contributed only 10% to the total 80Y activity, determined from analysis of the delayed -ray spectrum of 80Y collected in the present work.
Prompt and delayed rays were monitored at the experimental end station with 16 Ge detectors from the Segmented Germanium Array (SeGA) Mueller et al. (2001). The detectors were mounted on a frame designed to closely pack the cylindrical Ge crystals in two rings of 8 detectors around the BCS chamber for -ray detection. Each detector was mounted with its cylindrical axis parallel to the beam axis. The DSSD was located in the plane that separated the upstream and downstream Ge detector rings, thereby maximizing the overall detection efficiency of -rays emitted from nuclei implanted in the DSSD.
Ions implanted in the DSSD were monitored by location for positron emission in the implantation pixel, as well as the four nearest-neighbor pixels, over a correlation time of 10 s. A correlation efficiency for detection of 38% was realized.
Three Si PIN detectors (PIN1-3) placed upstream of the DSSD served as active degraders. PIN1 was used for the E and TOF start signal during particle identification (PID). The active degrader thicknesses were selected such that fragments were stopped in the front 1/3 of the DSSD, increasing the probability of detecting the small E of a -particle emitted in the downstream direction.
Downstream of the DSSD were six 5 cm 5 cm Single-Sided Silicon Strip Detectors (SSSD1-6), which were primarily used to veto signals from light particle that were transported to the end station. Each SSSD was segmented into sixteen strips on one face and aligned so that the segmentation in each successive detector alternated in x and y.
The DSSD provided a trigger for the master gate on either an implantation or decay event that registered a coincidence signal in the front and back strips. SeGA readout was opened for 20 s following each event trigger, enabling coincidence measurements of fragment- and - events. A coincidence register monitored signals from the other Si detectors in the BCS telescope, reducing dead time by signaling readout only for energy signals within the master gate.
III Results and Discussion
The decay curve for -decay events that occurred within 10 s in the same pixel or 4 nearest-neighbor pixels of a 84Mo implantation is shown in Fig. 6. These data were fit based on the maximization of a Poisson probability log-likelihood function that considered the exponential decay of the 84Mo parent, the exponential growth and decay of the 84Nb daughter using a T1/2 of 9.5 s Doring et al. (1999), and a linear background. The deduced half-life was 2.0 0.4 s based on a sample size representing 1037 implantations. The reliability of the analysis approach is demonstrated by the reproduction of the known half-lives of 83Nb and 81Zr. The half-life of 83Nb was deduced by Kuroyanagi et al. Kuroyanagi et al. (1988) as s. The value deduced from the decay curve in Fig. 6 was s, consistent with the previous result. A half-life of s for 81Zr was extracted by Huang et al. Huang et al. (1997, 1999) from a fit of a selective -gated decay curve. The fit of the decay curve for events correlated with 81Zr implantations shown in Fig. 6 resulted in a half-life value of s. A decay curve for 81Zr was also generated by gating on known rays in the daughter 81Y with energies 113, 175, and 230 keV, that were observed following decay for the first time. A fit to this more selective decay curve, taking into account the exponential decay of the 81Zr parent and a constant background, culminated in a half-life of s, again consistent with the the previously reported half-life and that deduced here considering only -decay events correlated with 81Zr implantations.
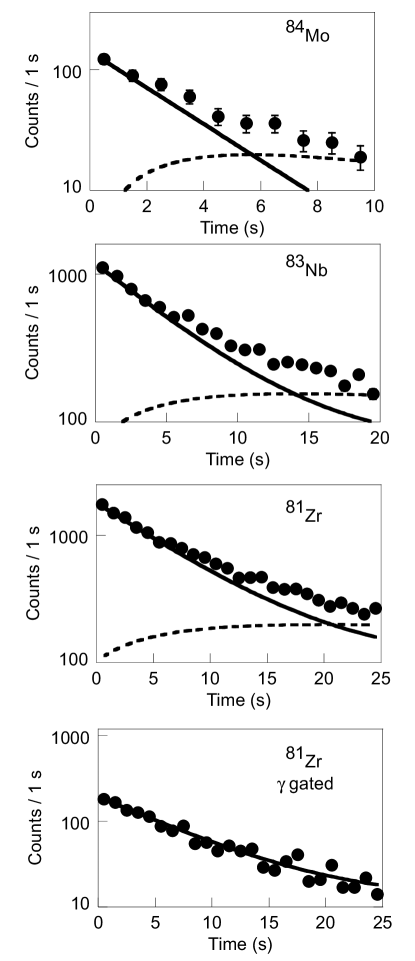
One shortcoming of the fits performed with the Poisson probability log-likelihood function is that all decay times were considered to be independent, which does not accurately describe the probability density of daughter decays. Therefore, decay events were also evaluated using a Maximum Likelihood analysis (MLH) Schneider (1996) that considered -decay chains of up to 3 members. Analysis of the 84Mo decay chain considered events that occurred within 20 s in the same pixel of a 84Mo implantation. Fixed values of 9.5 s and 25.9 min were used for the decay time parameters of the daughter and granddaughter, respectively. Background rates specific to each individual decay chain were determined by measuring the average rate of uncorrelated events on a pixel-by-pixel basis. A half-life of 2.2 0.2 s was deduced using all 366 extracted chains. This value is consistent with the above described Poisson distribution maximum likelihood method, though the approach is inherently better because it relies on a probability density function that considers the dependencies of the parent, daughter, and granddaughter decays, as well as background.
The new half-life value is more than 1 below the value of 3.7 deduced from 37 implantations by Kienle et al. Kienle et al. (2001). The new, shorter value continues the systematic trend observed in Table 1 relative to the previously adopted value. It is also consistent with the above discussed deformation assumed in the Sarriguren et al. Sarriguren et al. (2005) self-consistent treatment and affirms the trend towards a spherical 100Sn implied by the measured 84Mo Mărginean et al. (2001).
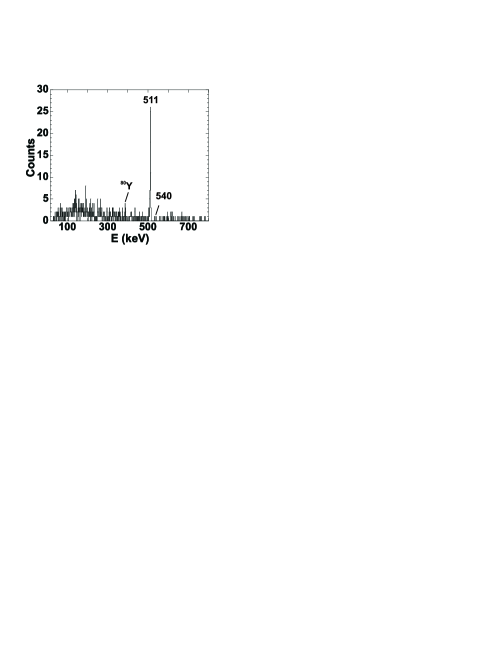
The initial intent of the half-life remeasurement of 84Mo was to gain additional selectivity in the analysis of the decay curve by -ray gating. The energy spectrum for rays found in coincidence with a 84Mo decay is shown in Fig. 7. Unfortunately, no rays were observed that could be attributed to the 84Nb daughter. Previous work has restricted the ground-state spin assignment for 84Nb to 1, 2, or 3 with positive parity. A 1+ 84Nb ground-state would be consistent with the low intensity observed during decay from the 84Mo 0+ ground-state. Additionally, a 1+ assignment would allow direct transitions into the the 0+ 84Zr ground state and explain the lack of evidence in Fig. 7 for previously observed states populated via 84Nb decay Doring et al. (2003). Based on the simplistic assumption that 100% of the 84Nb -decays feed excited states in 84Zr that depopulate through the known 2 level at 540.0 keV, we expected to observe a total of 14(9) counts at this energy in Fig. 7. The absence of this 540.0 keV transition is consistent with a portion of the 84Nb decay populating the 84Zr ground state. This further supports a 1+ spin and parity for the 84Nb ground state.
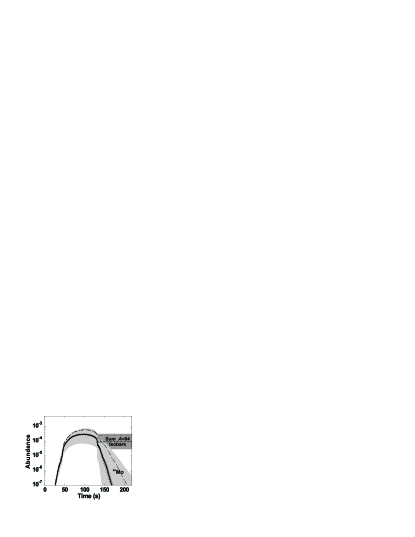
The implications of the newly measured 84Mo half-life on the -process were calculated using a single zone X-ray burst model based on ReaclibV1 rates provided by JINA Reaclib online database Warren . The abundance with respect to burst duration is shown in Fig. 8 for 84Mo (solid lines) and for all isobars (dashed line). The shaded region covers the range of previously predicted half-lives (0.8 s T1/2 6.0 s) given by various models Takahashi and Yokoi (1983); Biehle and Vogel (1992); Sarriguren et al. (2005). The dot-dashed line represents the yield calculated using the experimental upper limit of 4.7 s taken from the previously adopted 84Mo T1/2. The order of magnitude uncertainty in the final 84Sr abundance is reduced to less than a factor 2 with the new half-life.
The amount of material processed above 56Ni can become significant during X-ray bursts that last longer than 10 s. In such a scenario, the T1/2 of 84Mo can have a considerable impact on the overall mass processing. A previous burst simulation Schatz et al. (1998) based on a low -separation energy for 84Mo provided by the 1992 Finite Range Droplet Model predicted a Zr-Nb cycle via the reaction sequence
| (3) |
Escape from this cycle is only possible through 84Mo -decay. The newly reported half-life is still longer than the 1.1 s value used for simulations in Schatz et al. (1998), leading to a more pronounced bottleneck than predicted. The establishment of a Zr-Nb cycle would make the impact of the 84Mo T1/2 for some -process scenarios considerable indeed. Measuring the -separation energy of 84Mo is critical to determining the existence of such a cycle, and the real impact that it has on mass processing above .
IV Conclusion
The half-life for the -process waiting point nucleus 84Mo has been re-measured to be 2.2 0.2 s, more than 1 shorter than the previously adopted value. This new value is in line with the theoretical predictions of Sarriguren et al. of the mid-mass region consistent with a 84Mo nucleus that begins a shape transition towards a spherical 100Sn. 84Mo is an important waiting point in the -process, determining mass abundance at and procession above . A measurement of the 84Mo -separation energy is critical to determine the full impact of 84Mo on the -process mass flow. -ray data were not sufficient to restrict the 84Nb ground-state spin beyond what was previously reported, though a tentative 1+ assignment is favored.
The experiment discussed in this paper was the first to use the NSCL RFFS. The TOF-specific beam rejection capability, critical for selectively reducing the overall beam rate, is shown to be sufficient to enable fragment- correlation of neutron-deficient, longer-lived species.
Acknowledgements.
The authors thank the NSCL operations staff for providing the primary and secondary beams for this experiment and NSCL group for assistance setting up the Ge detectors from SeGA. We are appreciative of insightful statistics discussions with G.F. Grinyer and J. Thorpe. This work was supported in part by the National Science Foundation Grant Nos. PHY-06-06007 and PHY-05-20930 and JINA grant PHY-02-16783.References
- Schatz (2004) H. Schatz, Nucl. Phys. A 746, 347c (2004).
- Schatz et al. (2001) H. Schatz, A. Aprahamian, V. Barnard, L. Bildsten, A. Cumming, M. Ouellette, T. Rauscher, F. K. Thielemann, and M. Wiescher, Phys. Rev. Lett. 86, 3471 (2001).
- Costa et al. (2000) V. Costa, M. Rayet, R. A. Zappalia, and M. Arnould, Astron. Astrophys. 358, L67 (2000).
- Boyd (2002) R. N. Boyd, Eur. Phys. J. A 13, 203 (2002).
- Weinberg et al. (2006) N. Weinberg, L. Bildstein, and H. Schatz, Astrophys. J. 639, 1018 (2006).
- Jose (2005) J. Jose, Nucl. Phys. A 752, 540c (2005).
- Schatz et al. (1998) H. Schatz, A. Aprahamian, J. Gorres, M. W. T. Rauscher, J. F. Rembges, F. K. Thielemann, B. Pfeiffer, P. Moller, K. L. Kratz, H. Herndl, et al., Phys. Rep. 294, 167 (1998).
- Casten et al. (1993) R. F. Casten, N. V. Zamfir, and D. S. Brenner, Phys. Rev. Lett. 71, 227 (1993).
- Bucurescu et al. (1997) D. Bucurescu, C. Rossi Alverez, C. A. Ur, N. Marginean, P. Spolaore, D. Bazzacco, S. Lunardi, D. R. Napoli, M. Ionescu-Bujor, A. Iordaschescu, et al., Phys. Rev. C 56, 2497 (1997).
- Mărginean et al. (2001) N. Mărginean, C. Rossi Alvarez, D. Bucurescu, C. A. Ur, A. Gadea, S. Lundardi, D. Bazzacco, G. de Angelis, M. Axiotis, M. De poli, et al., Phys. Rev. C 63, 031303(R) (2001).
- Mărginean (2004) N. Mărginean, Eur. Phys. J. A 20, 123 (2004).
- Sarriguren et al. (2005) P. Sarriguren, R. Alvarez-Rodriguez, and E. Moya de Guerra, Eur. Phys. J. A 24, 193 (2005).
- Biehle and Vogel (1992) G. T. Biehle and P. Vogel, Phys. Rev. C 46, 1555 (1992).
- Kaptein et al. (1976) E. J. Kaptein, H. P. Blok, L. Hulstman, and J. Blok, Nucl. Phys. A 260, 141 (1976).
- Kabadiyski et al. (1976) M. Kabadiyski, C. J. Gross, A. Harder, K. P. Lieb, D. Rudolph, M. Weiszflog, J. Altmann, A. Dewald, J. Eberth, T. Mylaeus, et al., Nucl. Phys. A 260, 141 (1976).
- Lingk et al. (1997) C. Lingk, A. Jungclaus, D. Kast, K. P. Lieb, C. Teich, M. Weiszflog, C. Ender, T. Hartlein, F. Kock, D. Schwalm, et al., Phys. Rev. C 56 (1997).
- Plettner et al. (2004) C. Plettner, H. Grawe, I. Mukha, J. Doring, F. Nowacki, L. Batist, A. Blazhev, C. R. Hoffman, Z. Janas, R. Kirchner, et al., Nucl. Phys. A 733, 20 (2004).
- Kienle et al. (2001) P. Kienle, T. Faestermann, J. Friese, H. J. Korner, M. Munch, R. Schneider, A. Stolz, E. Wefers, H. Geissel, G. Munzenberg, et al., Prog. Part. Nucl. Phys. 46, 73 (2001).
- Ressler et al. (2000) J. J. Ressler et al., Phys. Rev. Lett. 84, 2104 (2000).
- Dean et al. (2004) S. Dean, M. Gorska, F. Aksouh, H. de Witte, M. Facina, M. Huyse, O. Ivanov, K. Krouglov, Y. Kudryavtsev, I. Mukha, et al., Eur. Phys. J. A 21, 243 (2004).
- Morrissey et al. (2003) D. J. Morrissey, B. M. Sherrill, M. Steiner, A. Stolz, and I. Wiedenhoever, Nucl. Instrum. and Methods B 204, 90 (2003).
- Tarasov and Bazin (2004) O. Tarasov and D. Bazin, Nucl. Phys. A 746, 411c (2004).
- Gorelov et al. (2005) D. Gorelov, V. Andreev, D. Bazin, M. Doleans, T. Grimm, F. Marti, J. Vincent, and X. Wu, in Proceedings of 2005 Particle Accelerator Conference, edited by C. Horak (Knoxville, TN, 2005), p. 3880.
- Prisciandaro et al. (2003) J. I. Prisciandaro, A. C. Morton, and P. F. Mantica, Nucl. Instrum. and Methods A 505, 140 (2003).
- Doring et al. (1999) J. Doring, A. Aprahamian, R. C. de Haan, J. Gorres, H. Schatz, M. Wiescher, W. B. Walters, L. T. Brown, C. N. Davids, C. J. Lister, et al., Phys. Rev. C 59, 59 (1999).
- Mueller et al. (2001) W. F. Mueller, J. A. Church, T. Glasmacher, D. Gutknecht, G. Hackman, P. G. Hansen, Z. Hu, K. L. Miller, and P. Quinn, Nucl. Instrum. and Methods A 466, 492 (2001).
- Kuroyanagi et al. (1988) T. Kuroyanagi, S. Mitarai, B. J. Min, H. Tomura, Y. Haruta, K. Heiguchi, S. Suematsu, and Y. Onizuka, Nucl. Phys. A 484, 264 (1988).
- Huang et al. (1997) W. X. Huang, R. . Ma, X. J. Xu, S. W. Xu, Y. X. Xie, Z. K. Li, Y. X. Ge, Y. Y. Wang, C. F. Wang, T. M. Zhang, et al., Z. Phys. A 359, 349 (1997).
- Huang et al. (1999) W. X. Huang, R. . Ma, S. W. Xu, X. J. Xu, J. S. Guo, X. F. Sun, Y. X. Xie, Z. K. Li, Y. X. Ge, Y. Y. Wang, et al., Phys. Rev. C 59, 2402 (1999).
- Schneider (1996) R. Schneider, Ph.D. thesis, Technischen Universitat Munchen (1996).
- Doring et al. (2003) J. Doring, R. A. Kaye, A. Aprahamian, M. W. Cooper, J. Daly, C. N. Davids, R. C. de Haan, J. Gorres, S. R. Lesher, J. J. Ressler, et al., Phys. Rev. C 67, 014315 (2003).
- (32) S. Warren, http://www.nscl.msu.edu/nero/db.
- Takahashi and Yokoi (1983) K. Takahashi and K. Yokoi, Nucl. Phys. A 404, 578 (1983).