Measurement of Non-photonic Electrons in p + p Collisions at = 200 GeV with reduced detector material in STAR
Abstract
In this paper, we present our analysis of mid-rapidity non-photonic electron (NPE) production at 0.2GeV/ in p+p collisions at = 200 GeV. The dataset is 78M TOF-triggered events taken from RHIC year 2008 runs. Through the measurement of ratio, we find that the photonic background electrons from conversions are reduced by about a factor of 10 compared with those in STAR previous runs due to the absence of inner tracking detectors and the supporting materials. The dramatic increase of signal-to-background ratio will allow us to improve the precision on extracting the charm cross-section via its semi-leptonic decays to electrons.
1 Introduction
Ultra-relativistic heavy ion collisions can provide sufficient conditions for the formation of a deconfined plasma of quarks and gluons. Heavy-flavor quarks(charm and bottom) are produced dominantly through high- partonic interactions [1]. Because of the large mass, it’s expected that the cross-section of heavy flavor production can be calculated in perturbative quantum chromodynamics (pQCD) [2]. Precise measurements of charm total cross-section and transverse momentum spectrum in p+p collisions will provide a baseline to understand the charm production and in-medium mechanism in heavy ion collisions [3].
To date, one way to study heavy flavor production is to measure NPE production from their semi-leptonic decay. Although the systematic uncertainties are quite large, the charm cross-section measured by STAR is different from that measured by PHENIX by a factor 2 or 1.5 [1, 4]. STAR has large and uniform acceptance, but the material close to beam pipe in previous run is 5.5% of a radiation length (). In run8, STAR removed inner tracking detectors, SVT (Silicon Vertex Tracker) and SSD (Silicon Strip Detector). The material budget integrating from interaction point to TPC inner field cage is 0.69%. There are wraps around the beam pipe to bake out the beam pipe and glues at inner field cage, which are estimated. The exact material in terms of radiation length is mapped from the data.
During the 2008 RHIC runs, TPC has upgraded the electronics of one of its 24 sectors to a factor of 10 faster with negligible dead time using a pipeline buffer (TPX in DAQ1000) [5]. Fully instrumentation of the 24 sectors will been completed after run8. Five trays of Time-of-Flight (TOF) was placed behind the TPX sector, and each tray covers -10 in pseudo-rapidity and 30 in azimuth. Two pVPDs were installed to provide a starting time for TOF detectors, each staying 5.4m away from the TPC center along the beam line. The starting time resolution is 83ps. The timing resolution of TOF is 110ps in p+p collisions. In our analysis, we collected 78M TPX+TOF triggered events by requiring at least one hit in TOF, equivalent to 400M minimum bias events.
Due to STAR’s unique capability of identifying electron and pion at low in an identical procedure by a combination of ionization energy loss in TPC and velocity from TOF [6], many of the systematic uncertainties associated with individual charge pion and electron cancel. In the analyses presented here, we’ll focus on the ratio and compare the ratio from previous measurements and background. After selection of good runs and a vertex cut of 40cm to reject conversion background electrons from beam pipe and its support, we also need a rapidity cut -0.6y0 to ensure rapidity distribution of electron similar as that of pion when we calculate ratio. In order to get good primary track, we have a vertex Z difference cut, (pVPD)-(TPC)6cm.
2 Particle (electron and pion) Identification
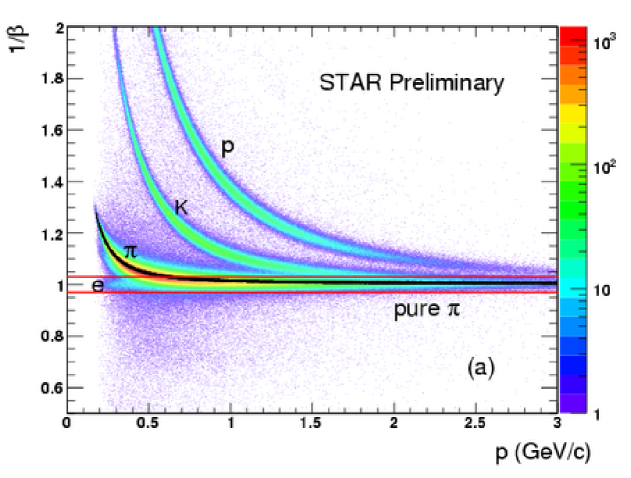
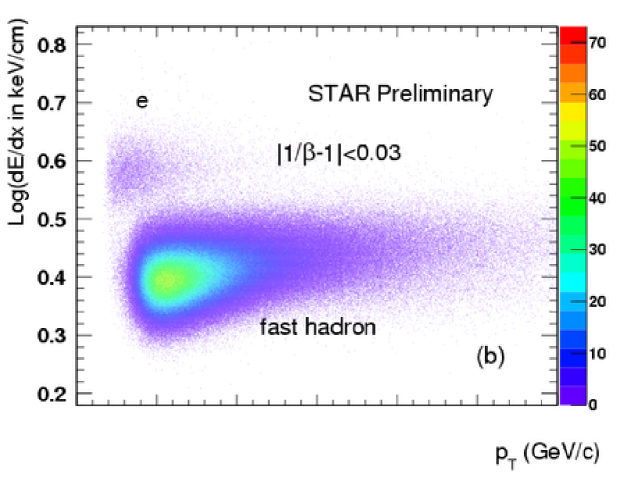
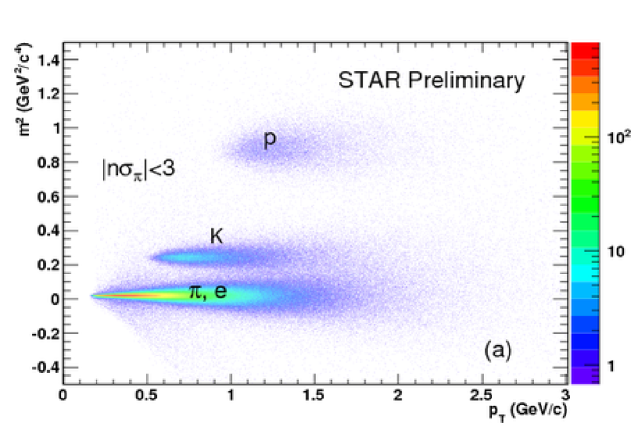
The relativistic rise of the in TPC from electrons provides a possible separation of electrons from the rest of the hadrons except from slow hadrons impinging the electron band at several crossing points as function of momentum. Electron identification requires TOF PID cut, 1/-10.03, to reject slow hadrons. This cut is shown in the Fig 1 (a) using two red solid lines. After this cut we will get the distribution of electron and fast hadrons as a function of , shown in Fig 1 (b). Projecting this plot in different bins and using suitable function fit to distribution, we obtain the raw yields of electron.
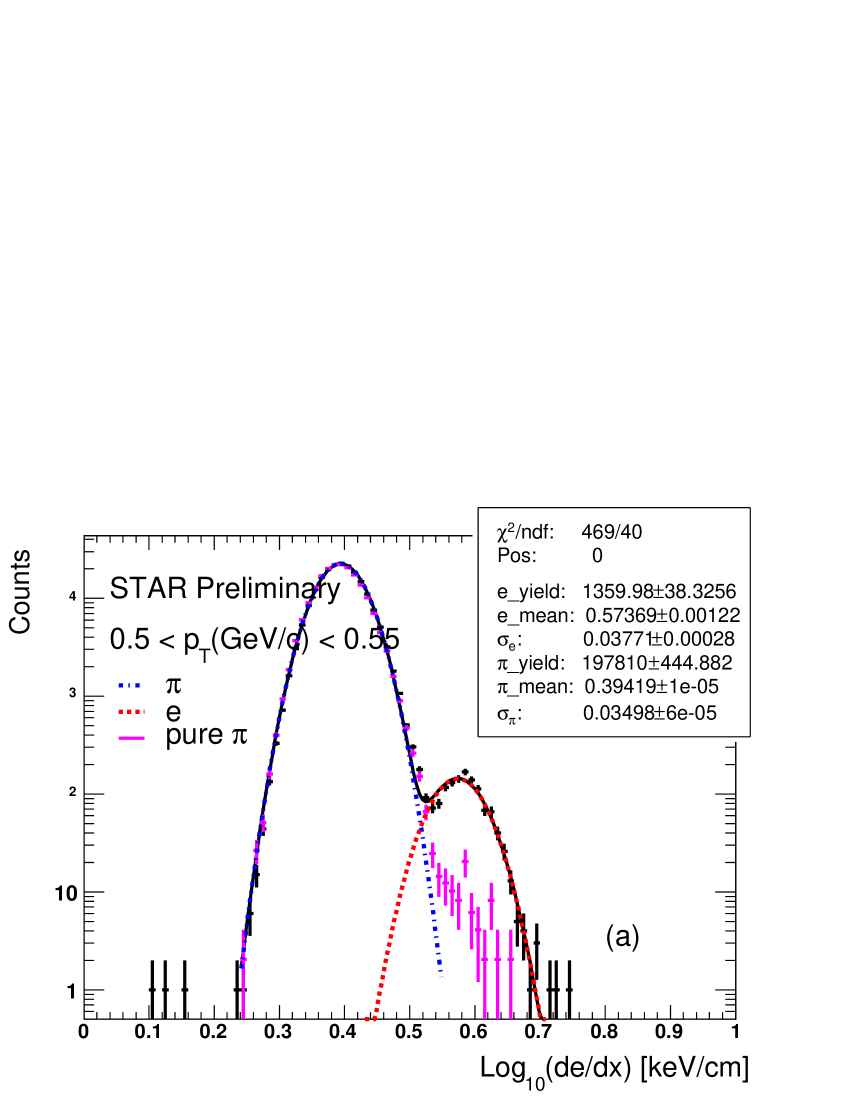
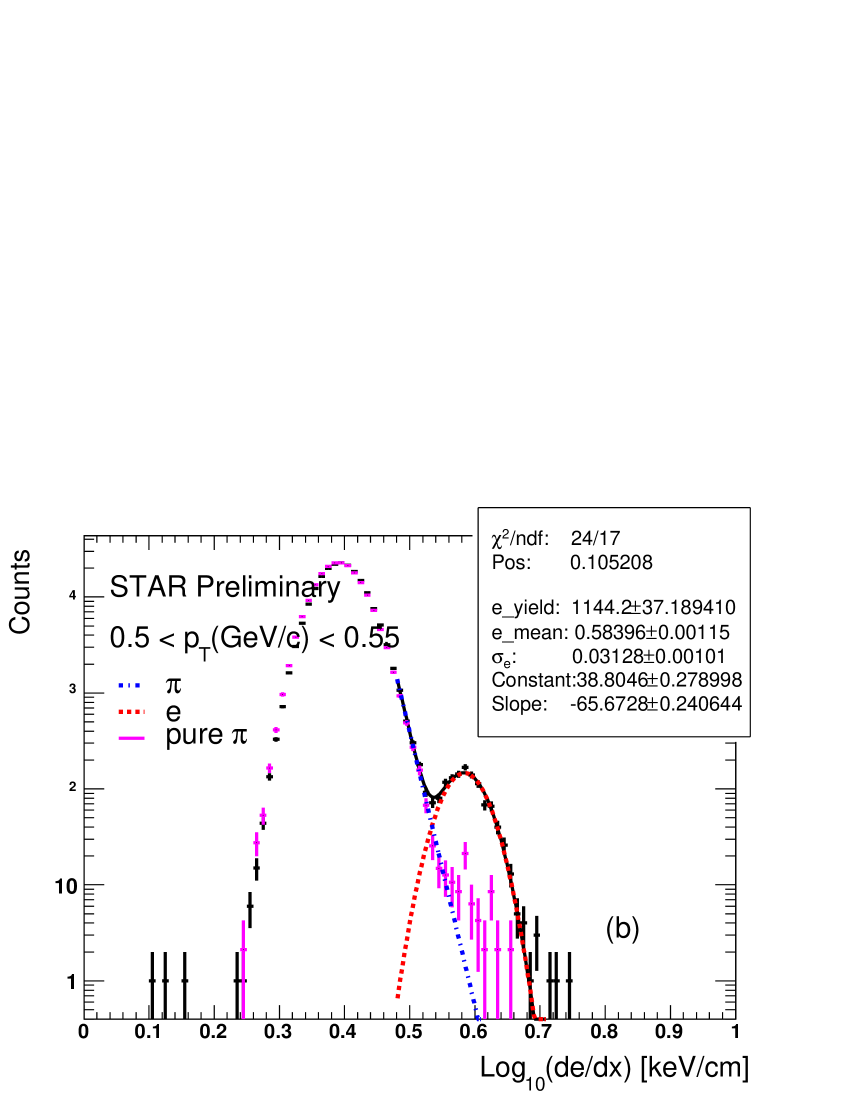
We used two function forms to estimate the background distribution. One is a Gaussian function and the other is an exponential function. We found the 2-Gaussian function cannot describe the left shoulder region of electron due to the tail of the from fast hadron in lower region(1.6GeV/). Instead, a function of exponential+Gaussian was used in the fit. We also use two methods to produce the background tail shape of fast hadrons and evaluate the uncertainty due to hadron contamination: 1)inverse velocity difference between measurement and calculation 01/(measured)-1/0.01 to provide pure pion distribution; 2)energy deposited in EMC 0.5GeV to enhance hadrons with non-electromagnetic showers. Figure 2 shows the distribution together with a background distribution from method 1) in 0.50.55(GeV/). The exponential background tail can reproduce the background distribution very well.
In 1.64.0(GeV/), 3-Gaussian fit is used, assuming that one Gaussian function can describe kaons and some of the residual protons after the velocity cut. In order to check that we have a real electron signal, we used energy deposited in EMC to reject hadrons. Comparing the peak and width of electron with EMC and without EMC selection, we can evaluate the electron yields at high .
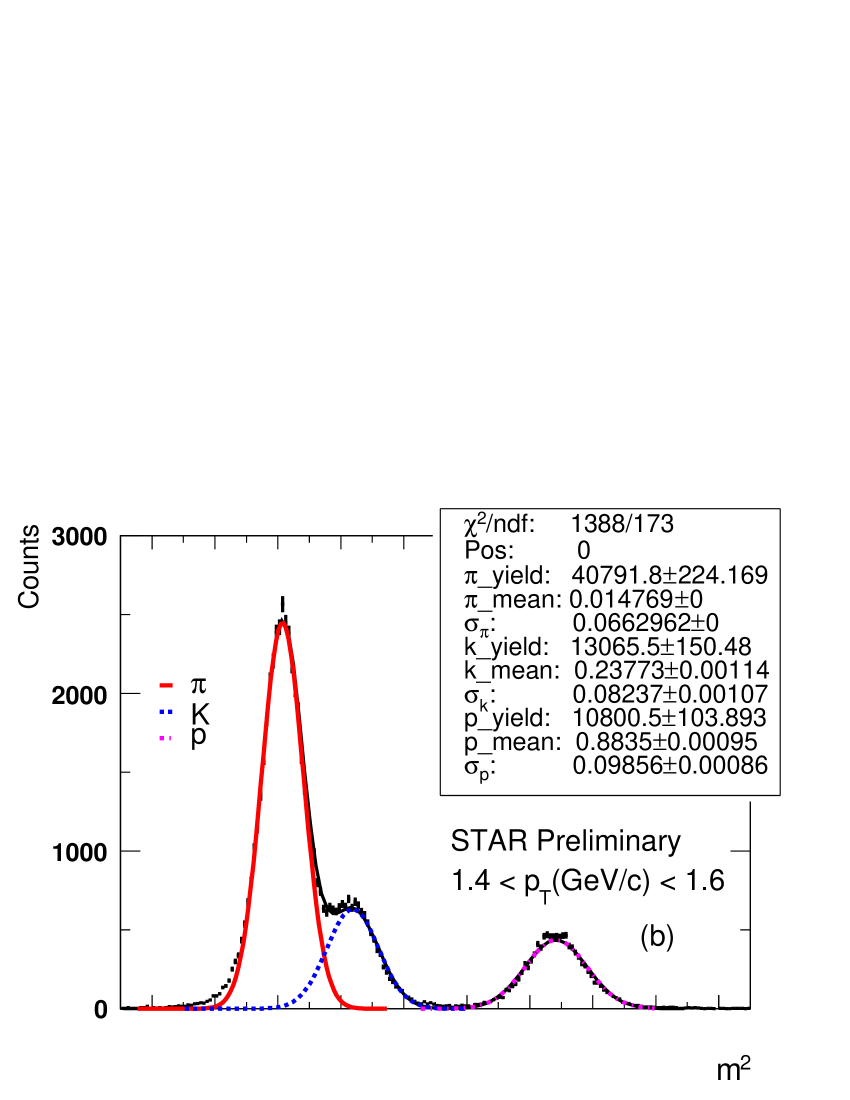
identification was achieved by a combination of 3 and particle mass from TOF measurement via . Fig 3 (a) shows particle mass square versus . Through projection and single Gaussian fit, we also can get raw yields. Fig 3 (b) shows a fit example in 1.41.6(GeV/) where the pion distribution start merging with those from koans and protons.
Counting the entries at the range -0.10.1(GeV/ was also used to compare with the fitting yields. The difference between them was found in low range and was used as part of the systematic uncertainty.
3 Non-photonic and photonic background electrons
The inclusive electron raw yields have three components [7]: (1)electrons from heavy-flavor decay (charm and bottom), (2)photonic background electrons from Dalitz decays of light mesons (0, etc.) and gamma conversion. (3)other background electrons from decays and dielectron decays of vector mesons. Photonic background 2) is much larger than other background, so we will use signed DCA (sDCA) (distance of closest approach of a track in TPC to the interaction point) to reject the electron background from gamma conversion at high radius and cocktail method to remove background from Dalitz decays of light mesons.
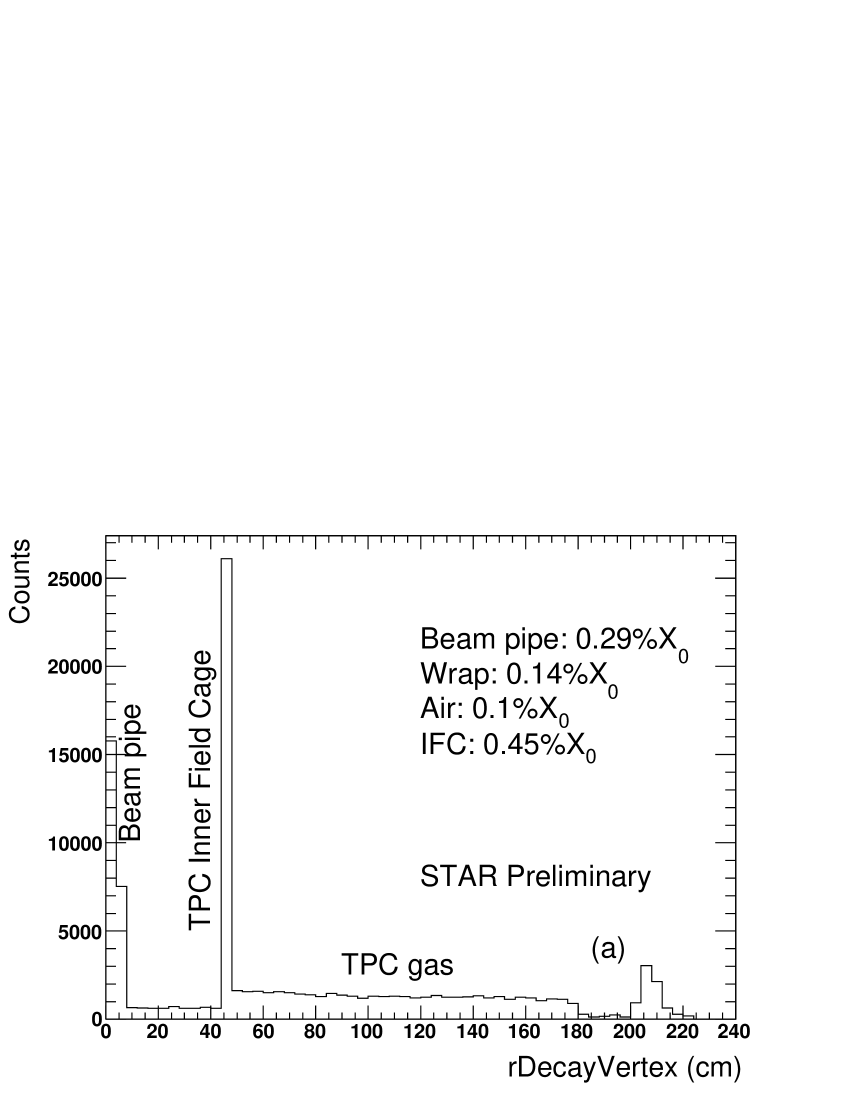
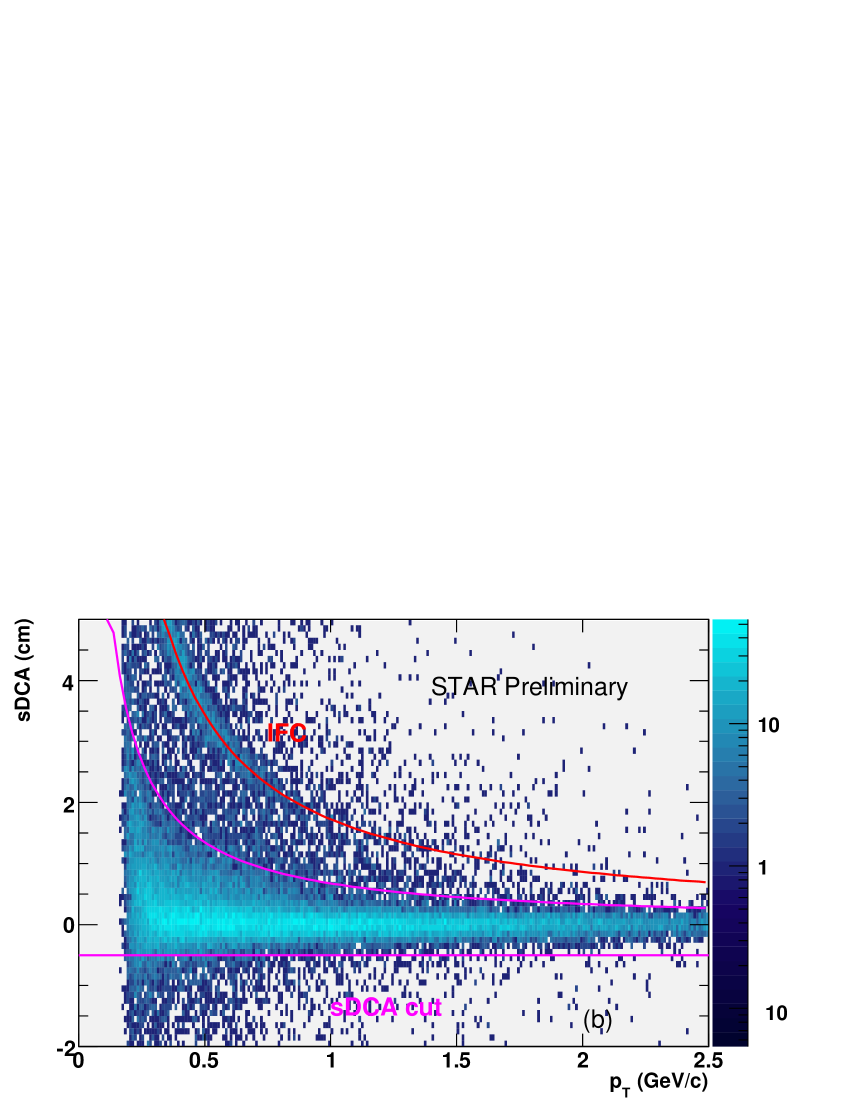
Figure. 4 (a) shows radial distance (r) distribution of gamma decay vertex to the primary vertex from a GEANT simulation. There are two major background sources of gamma conversion, material around the beam pipe ( beam pipe 0.29% + wraps for the beam pipe bake-out) and TPC Inner Field Cage (IFC 0.45%). Here, we used sDCA cut to remove gamma conversion at high radius (cm). Figure. 4 (b) shows the sDCA as a function of from run8 data. A hand calculation of where the sDCA should be from conversions at the IFC agrees nicely with the band in the data. sDCA = where is the conversion radius in a uniform solenoidal magnetic field of 0.5Tesla. We can use this expression to get the sDCA value of sDCA1 when =30cm. With -0.5sDCAsDCA1 cut, we rejected electron from gamma conversion in the air with 30cm, at IFC and TPC gas.
After removing gamma conversion at high radius, we use cocktail method to subtract background from Dalitz decays. A cocktail of electron spectra from various background sources is calculated using a Monto Carlo event Generator of hadron decays. The most important background is the Dalitz decays. Through fit to the charge spectra in non-singly diffractive (NSD) p+p collisions, we get a function (in this expression, and stand for the particle transverse mass and rest mass separately and it has three parameters: , and ). With fixed parameter = 9.7, this expression fit not only charge spectra but also charge kaon, , and well, so we use this expression as input to the generator. With cocktail method, we get the electron background from Dalitz decays of light mesons.
4 ratio
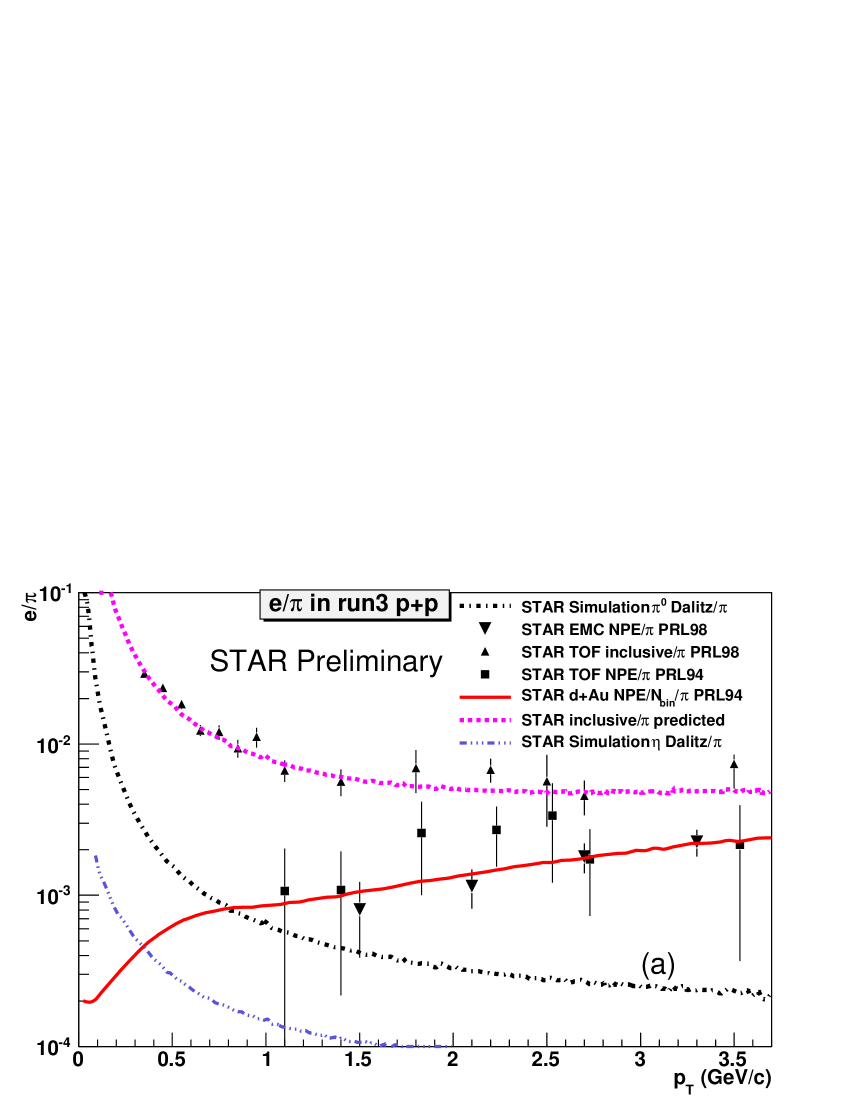
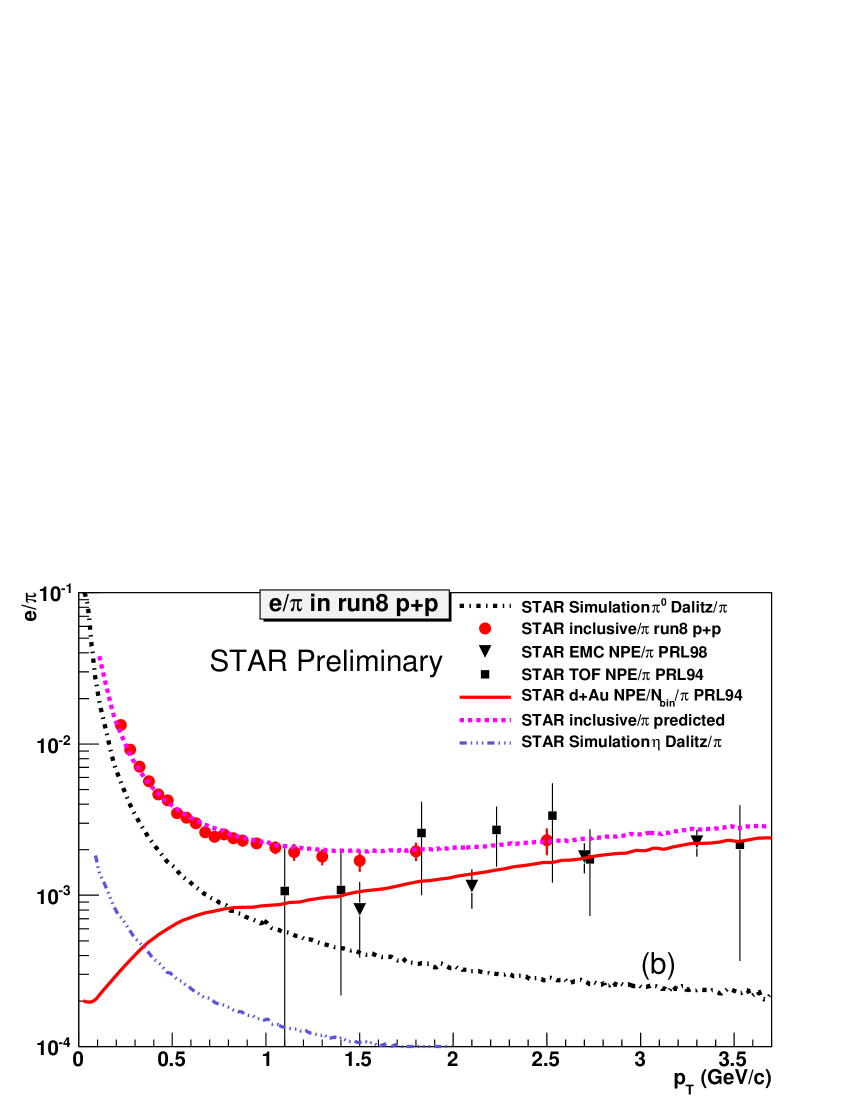
Figure. 5 shows the ratio from run8 data, compared to various background cocktails, NPE from previous results, and run3 inclusive electron to pion ratio. We also check the consistence of the ratio from run8 and the results from run3. We take the material budget from which conversion in detector is 10 in run3 than that in run8, and we include the from and from Dalitz decays from cocktail method and NPE/ measured in run3 d+Au data scaled by the binary collisions together, then we find the total sum of from run8 is consistent with STAR TOF inclusive in run3, and the dependence can be well reproduced as well. In addition, conversion is equivalent to 0.9 of the electron yields from Dalitz decay in run8, comparable with the estimated material budget in this run.
5 Conclusions
In summary, we present our analysis of mid-rapidity NPE production at 0.2GeV/ in p+p collisions at = 200 GeV. Through the measurement of ratio, we find that the photonic background electrons from gamma conversions are reduced by about a factor of 10 compared with those in STAR previous runs due to the absence of inner tracking detectors and the supporting materials. and preliminary results from run8 dataset agree with the results from run3.
6 Acknowledgements
This work was supported in part by the National Natural Science Foundation of China under grant No. 10610285 and No.-10875159, the Knowledge Innovation Project of the Chinese Academy of Science under grant nos. KJCX2-YW-A14 and KJCX3-SYW-N2.
References
References
- [1] B.I. Abelev,et al.,[STAR Collaboration], Phys. Rev. Lett. 98, 192301 (2007);
- [2] M. Cacciari et al., Phys. Rev. Lett. 95, 122001 (2005);
- [3] B. W. Zhang et al., Phys. Rev. Lett. 93, 072301 (2004);
- [4] A. Adare,et al.,[PHENIX Collaboration], arXiv:0802.0050v2 [hep-ex];
- [5] R. Esteve Bosch, A. Jimenez de Parga, B. Mota, and L. Musa, IEEE Trans. Nucl. Sci., 50:2460–2469, 2003.
- [6] M. Shao, O. Barannikova, X. Dong, Y. Fisyak, L. Ruan, P. Sorensen, Z. Xu, arXiv:nucl-ex/0505026;
- [7] A. Adare,et al.,[PHENIX Collaboration], Phys. Rev. Lett. 97, 252002 (2006);