An optical search for supernova remnants in the nearby spiral galaxy NGC 2903
Abstract
Aims. We present the results of an optical search for supernova remnants (SNRs) in the nearby spiral galaxy NGC 2903.
Methods. Interference filter images and spectral data were taken in March 2005 with the f/7.7 1.5 m Russian Turkish Telescope (RTT150) at TUBITAK National Observatory (TUG). Spectral data were obtained with the 6 m BTA (Bolshoi Azimuthal Telescope, Russia). We used the SNR identification criterion that consists of constructing the continuum-subtracted H and continuum-subtracted [SII]6716,6731 images and their ratios.
Results. Five SNR candidates were identified in NGC 2903 with [SII]/H ratios ranging from 0.41 - 0.74 and H intensities ranging from 9.410-15 to 1.710-14 ergs cm-2 s-1. This work represents the first identification of SNRs by an optical survey in NGC 2903. We present the spectrum of one of the bright candidates and derive an [SII]/H emission line ratio of 0.42 for this source. In addition, the weak [OIII]5007/H emission line ratio in the spectrum of this SNR indicates an old oxygen-deficient remnant with a low propagation velocity.
Key Words.:
Supernova Remnants (SNRs)– Spiral Galaxies, NGC 29031 Introduction
Supernova remnants (SNRs) are important for many of the theories of interstellar medium (ISM) because supernova explosions and their eventual dispersion of ejected material have the effect of enriching the ISM with the material processed in stellar interiors. In a typical HII region, the sulfur is in the form of because of the strong photoionization flux of the central hot star or stars. Therefore, the [SII]/H ratio is typically 0.1 - 0.3 for HII regions. Outside the HII region, there are not enough energetic free electrons to excite and to produce forbidden-line ([SII]) emission. For that reason, nearly all discrete emission nebulae with [SII]/H 0.4 are shock-heated and they are probably SNRs.
In several prior works, the motivation for observing SNRs in nearby galaxies (Matonick & Fesen 1997 (hereafter MF97); Pannuti et al. 2000, 2002) and in our Galaxy (Mavromatakis et al. 2002; Fesen et al. 1997, 2008) has already been discussed. The sample of Galactic SNRs is quite large, and interstellar extinction and uncertain distances cause selection effects. These problems are much less significant in extragalactic samples. Assuming the distance to a galaxy is known, all the SNRs are at the same distance from us, so some properties can be compared directly. Also, the foreground extinction is generally low, thus relative positions of SNR samples are determined accurately in an extragalactic survey. By knowing the positions of the SNRs, their distributions are calculated relative to HII regions and spiral arms. Possible SNR progenitors have been investigated from these distributions (MF97; Blair & Long 1997, 2004).
Extragalactic searches for SNRs were first obtained for the Magellanic Clouds by Mathewson & Clarke (1973). They were the first to use the [SII]/H emission line ratios for optical identification of SNRs. Blair et al. (1981), Smith et al. (1993), and Blair & Long (1997,2004) also used same method successfully.
A number of nearby spiral galaxies have already been observed to identify SNRs using optical observations (e.g D′Odorico, Dopita & Benvenuti 1980; Braun & Walterbos 1993; Magnier et al. 1995; MF97; Matonick et al. 1997; Gordon et al. 1998, 1999; Blair & Long 1997, 2004) and X-ray observations (Pence et al. 2001; Ghavamian et al. 2005). Radio searches for extragalactic SNRs have been conducted by Lacey et al. 1997; Lacey & Duric (2001) and Hyman et al. (2001). SNR surveys have also been carried out at optical, radio, and X-ray wavelengths by Pannuti et al. (2000, 2002, 2007).
In this work, we searched for SNRs in the nearby spiral galaxy NGC 2903 using the criterion [SII]/H ratio is 0.4. NGC 2903 is an SB(s)d type galaxy with a inclination angle, and position angle at a distance of 9.4 Mpc to NGC 2903 has been adopted for this paper (Bresolin et al. 2005). It was observed at radio (Williams & Becklin 1985; Tsai et al. 2006), infrared (Simons et al. 1988; Williams & Becklin 1985; Alonso - Herrero, Ryder & Knapen 2001), X - ray (Fabbiano, Trinchieri & MacDonald 1984; Mizuno et al. 1998; Junkes & Hensler 1996; Tschoke, Hensler & Junkes 2003), and optical wavelengths (Bresolin et al. 2005). Multiwavelength observations of NGC 2903 implies that it has a very complex structure with knots in the nucleus. The knots, called “hot-spots”, contain many early type stars (Oka et al. 1974; Simons et al. 1988). Tsai et al. (2006) report subarcsecond-resolution VLA (Very Large Array) imaging of NGC 2903. They found seven discrete radio sources in the central 15 15 of galaxy at the wavelengths of 6 and 2 cm to a limiting integrated flux density of 0.2 and 0.3 mJy, respectively. They identified one of their sources (source D) as a candidate radio SNR. Their detected sources meet at least one of the following criteria: 5 detection at the peak intensity at one wavelength and 4 emission detection at both 6 and 2 cm.
The organization of the paper may be described as follows:. In Sect. 2 we discuss both the imaging and spectroscopic observations that were conducted as part of this study, as well as the accompanying data reduction. The SNR identification technique, search results, and discussion are described in Sect. 3.
2 Observations and data reduction
2.1 Imaging
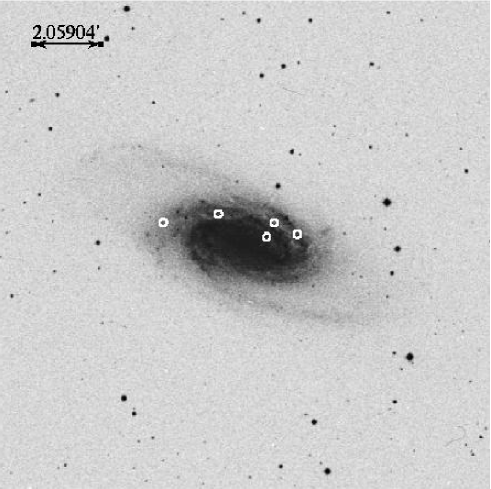
NGC 2903 was observed in 2006 March with the 1.5 m Russian Turkish Telescope (RTT150) at TUBITAK National Observatory (TUG) in Turkey. Images were taken with TFOSC (TUBITAK Faint Object Spectrograph and Camera) 2048 2048 pixel CCD with a plate scale of 0″.39 pixel-1, giving 13′.3 13′.3 FOV. We used narrowband interference filters centered on the lines of [SII] & H + 2 continuum filters to remove starlight from H and [SII] images. Characteristics of the interference filters used in these observations are listed in Table 1. An observation log of the imaging data is shown in Table 2 for this galaxy. The data were reduced using ESO–MIDAS (The European Southern Observatory Munich Image Data Analysis System) software environment. Several H, [SII], and associated continuum images of each galaxy field were combined to obtain deeper field images in order to increase the signal-to-noise ratio for the faintest objects. As shown in Table 2, 20 exposures (5400 seconds in total for two filters) were combined for two observation nights. Standard stars from the list of Oke (1974) and Stone (1977) were observed each night to determine the flux conversion factors. Bias frames and dome flats were also observed. Each exposure was bias-subtracted, trimmed, and flat-fielded. The cosmic rays were removed from each [SII] and H image. The SNR candidates overlaid on DSS (Digitized Sky Survey) images of the spiral galaxy can be found in Fig. 1.
2.2 Spectroscopy
The spectral data of one bright SNR were obtained with the optical telescope BTA-6 m (Bolshoi Azimuthal Telescope, Russia) 2008 April. The SCORPIO (Spectral Camera with Optical Reducer for Photometrical and Interferometrical Observations) spectrograph was used in BTA with a CCD 2048 2048 pixels in size. We used 1 slit width, and a 3500 - 7200 spectral range was assumed for SCORPIO with 10 spectral resolution. The IDL codes and IRAF packages were used to perform the basic reductions, flux, and wavelength calibrations and interstellar extinction correction. Spectrophotometric standard stars from Oke (1974) and Stone (1977) catalogs were observed each night. Derived fluxes from the spectrophotometric standards were used to find the fluxes for spectral lines in our SNR spectrum. Biases, halogen lamp flats, and FeAr or Neon calibration lamb exposures were obtained for each observation set. Finally [SII] and H emission line fluxes were measured using splot routine in IRAF. To obtain spectral data of SNRs, the slit position was arranged so that both a bright star and the SNR were inside the slit. The aim of spectral observations was to resolve [SII] doublet lines and to extract and eliminate contributions of two [NII] lines near the H line.
3 Results and discussion
To identify the SNR candidates in NGC 2903, we used the technique where continuum-subtracted H and [SII] images were constructed and then [SII]/ H image ratios were made. Finally, regions that have image ratio values 0.4 were identified as candidate SNRs (Blair & Long 1997).
Preliminary SNR candidates were found by blinking between continuum-subtracted [SII] and H subfield images. We only displayed a region about 2 on a side at one time for visual inspection of the fields to search for candidates. Any bright feature in the continuum-subtracted [SII] image was checked against the continuum-subtracted H to make sure the stars were not poorly subtracted. If the feature in the [SII] image looked brighter than it was in the H image, we marked it as an SNR candidate. Each preliminary SNR candidate was a possible target for follow-up spectral observation. In the latter step [SII] and H, continuum-subtracted images were used to measure the total counts for each SNR candidate. We selected a circular aperture in continuum-subtracted images to sum the ADU (Analogue to Digital Units) counts. Afterwards a concentric annulus was selected to determine the background counts to subtract from the aperture sum. The aperture sizes used to measure fluxes were constrained by the seeing that was attained during our interference filter imaging observations (namely 1.9, which corresponds to 87 pc for the assumed distance to NGC 2903 of 9.4 Mpc). Because of the difference between seeing and pixel scales, we did not include radii calculations for the SNR candidates that we detected. To correct flux values for interstellar extinction, we used data from Cardelli, Clayton, and Mathis (1989).
Using the SNR identification technique described above, 5 SNR candidates were detected in NGC 2903 with [SII]/H 0.4. Results of our present observations with candidates and corrected flux ratios from the imaging analysis of these SNRs are listed in Table 3. The measured H flux of SNR4 is smaller than the other four optically-identified SNRs by factors of approximately 2-3. We caution that calculations involving the H line may have slight contamination from the [NII] lines. We carried out these calculations in an environment with a limiting flux sensitivity level of 3.110-15 erg cm-2 s-1 for our imaging observations of NGC 2903. This sensitivity limit was determined by choosing a structure that has minimum magnitude in the galaxy field. Then the total counts from the same circular aperture of SNRs used are converted to galaxy flux value using the spectroscopic standard star flux mentioned above.
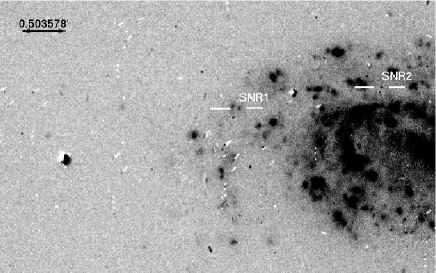
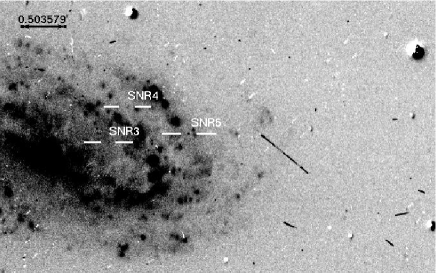
Only one field was observed in NGC 2903. It covers a total field of 12′ 6′. In Figs. 2 - 3 we show 4 4 subfields of NGC 2903. No SNRs were found in the southern half of the galaxy. We note that the south field of the galaxy consists of mainly bright HII regions compared with the north field (Bresolin et al. 2005). This might be one of the reasons for the absence of SNRs in this region. The detected SNR distribution in NGC 2903 resembles the skewed distribution of SNRs seen in NGC 2403 by Matonick et al. (1997). They also explain the absence of SNRs in the north field of the image of NGC 2403 in a similar fashion.
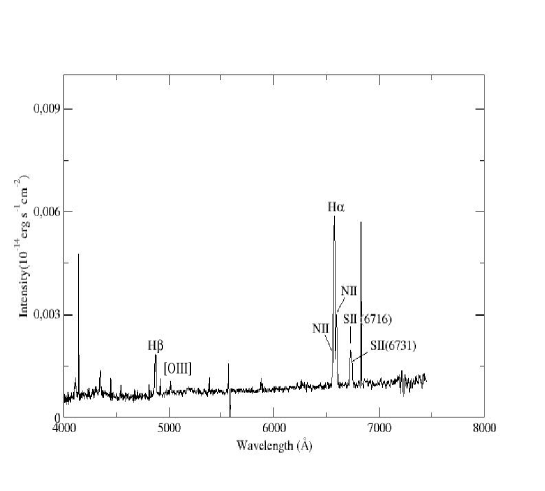
Among the five candidates detected in NGC 2903, we were able to observe SNR4 spectroscopically and derive a specific line ratio of [SII]/H of 0.42. The optical spectrum of SNR4 is shown in Fig. 4. Line intensities relative to H, the E(B-V), and H intensity value for this spectrum given in Table 4. We used this spectrum to calculate line ratios for [SII] 6761/[SII]6731 and [OIII]5007 / H. We calculated electron density, , using [SII] 6761/[SII]6731 line ratio and the Space Telescope Science Data Analysis System (STSDAS) task . When an electron temperature value is given, this task calculates the electron density, based on the five-level atom approximation explained in the task. The line ratio of [SII]6716/[SII]6731 1.46 gives the low density limit corresponding to 10 cm3 (Osterbrock 1989). Assuming an electron temperature of K, the calculated value is 360, which is not so atypical for such galaxies (for example, SNR 19 in NGC 2403, Matonick et al. 1997). For SNR4, we detected only a weak [OIII]5007 / H emission line ratio of 0.1 indicating an oxygen-deficient remnant, which corresponds to a low propagation velocity below the limit of 100 km/s (Smith et al. 1993), which shuts off the nebular shocks. There are many examples of such weak line ratios with poor oxygen content in a number of nearby galaxies (Blair & Long 2004; MF97).
We searched for X-ray counterparts to the SNRs that were found by our optical observations. Twenty one X-ray point sources were determined in the position and extension of NGC 2903 in the Master X-Ray Catalog (http://heasarc.nasa.gov/W3Browse/all/xray.html). We found only one positional coincidence with the Master X-ray catalog sources taking a 30 positional error circle around the objects. SNR3 falls in the error circle of 1RXS J093210.2+212947. However, the tabulated position error of the catalog source was 18, which was lower than our assumed error, once the error circle diminished in size, there we found no correlation of our candidate SNR3 with the source. This catalog contains data from the Position Sensitivity Proportional Counter (PSPC) onboard ROSAT (Rontgen Satellite) and Imaging Proportional Counter (IPC) onboard Einstein observatories. IPC provides an angular resolution of 30 (FWHM) at 1 keV and the limiting sensitivity range from 510-14 to 310-12erg cm-2s-1 in the 0.3 - 3.5 keV energy band (Gioia et al. 1990). And ROSAT PSPC minimum sensitivity lies around a few times 10-13 - 210-14 erg cm-2 s-1 in the energy band 0.1-2 keV (Morley et al. 2001). PSPC has provided 30 (FWHM) on-axis angular resolution at 1 keV (Trumper, 1984). These limiting fluxes set an upper limit on the luminosity of sources that would be detected in this catalog as a few times 1038 erg s-1 at the distance of 9.4 Mpc (for NGC 2903). Given that a maximum radiative X-ray luminosity of an SNR (with a shock temperature of 0.1 keV or above) will be a few times 1038-39 erg s-1 (see Panutti, Schlegel, Lacey 2003; Schlegel Panutti 2003; Holt et al. 2003) , it is only normal that there are no SNRs among the Master X-ray Catalog sources in the vicinity of NGC 2903. Tschoke et al. (2003) have also found 18 sources in the vicinity of NGC 2903. We checked for any positional coincidence with these sources using an error circle of 30, but found no correlation. Given our results for SNR4, since we derive no strong [OIII] emission and our [OIII]5007 / H ratio indicates that nebular shocks are around or below 100 km/s (i.e., an old remnant), this yields an upper limit on the electron temperatures of about 105 K, which would greatly reduce the X-ray emission that will be detected from this remnant. It is expected that X - ray imaging with Chandra, with improved angular resolution and sensitivity, could provide valuable improvement for SNR detections in nearby galaxies especially for NGC 2903.
We also checked for an overlap between our optically identified SNRs and the candidate radio SNR in NGC2903 reported by Tsai et al (2006). However, there is no overlap (within 2 positional accuracy) among these sources.
As noted by MF97, Braun & Walterbos (1993) have estimated that about half of all SNe are of Type Ib/c or Type II ( that is, produced by the deaths of massive stars); in turn, only half of all of these SNe are located in regions with enough ambient density to produce a detectable SNR. This means that, only about a quarter of all SN events may leave easily detectable optical remnants. In our case we have detected five SNRs, indicating that the total number of SNe in NGC 2903 is 20, about half of which ( 10) would leave remnants. This number could also be taken as an upper limit for observations with much more improved visibility and seeing conditions. However, only about half of them ( 5) would occur in easily detectable regions. All these provide acceptable explanations for our observations. If the optically visible lifetime of a typical SNR is about 20,000 years (Braun et al. 1989), it would also give us an SN occurrence rate of about 1 per 1000 yrs. When we compared this rate to MF97 SN rates, we find quite good overlap for the case of NGC 5585, which has the same number of SNRs. In the same work, for galaxies with lower and higher SNR numbers, this rate goes proportionally higher and lower.
In their analysis, MF97 also present the mode values of the measured H intensities for the detected SNR samples from numerous galaxies to see evidence of any selection effects and biases (see their Table 19). Using the galaxy distances they show the log of the mode of the H luminosity, L(H)mode, is larger for more distant galaxies. This means that, if the distance of galaxies increases, it is much more difficult to detect the fainter SNRs. In our case, we calculated that the L (H)mode value could be taken as 1.21038 erg s-1 (since we have detected a few SNRs, we were only able to calculate an average value for H intensities and considered this as our mode value. This was also the practice by MF97 for galaxies with a low number of SNRs). With a distance of 9.4 Mpc, NGC 2903 follows the same trend toward higher L(H)mode values to go with greater distances.
Acknowledgements.
We thank the TUBITAK National Observatory (TUG) and Special Astrophysical Observatory (SAO) for their support with observing time and equipment. Also we would like to thank to IGPP (Institute of Geophysical Planetary Physics) at UCR (University of California Riverside) for providing us some of the interference filters. We also thank an anonymous referee and M.E. Ozel for their valuable comments and discussions.References
- (1) Alonso-Herrero, A., Ryder, S. D., Knapen, J. H. 2001, MNRAS, 322, 757
- (2) Blair, W. P., Kirshner, R. P. & Chevalier, R. A. 1981 ApJ, 247, 879
- (3) Blair, W. P. & Long, K. S. 1997, ApJS, 108, 261
- (4) Blair, W. P. & Long, K. S. 2004, ApJS, 155,101,121
- (5) Braun, R., Goss, W. M., Lyne, A. G. 1989, ApJ, 340, 355
- (6) Braun, R. & Walterbos, R. A. M. 1993, A&AS, 98, 327
- (7) Bresolin, F., Schaerer, D., González Delgado, R. M., Stasinska, G. 2005, A&A, 441, 981
- (8) Cardelli, J. A., Clayton, G. C. & Mathis, J. S. 1989, ApJ, 345, 245
- (9) D′Odorico, S., Dopita, M. A. & Benveuti, P. 1980, A&AS, 40, 67
- (10) Fabbiano, G., Trinchieri, G. & MacDonald, A. 1984, ApJ, 284, 65
- (11) Fesen, R. A., Winkler, F., Rathore, Y., Downes, R. A. & Wallace, D. 1997, AJ, 113, 767
- (12) Fesen, R. A., Rudie, G., Hurford, A. & Soto, A. 2008, ApJS, 174, 379
- (13) Ghavamian, P., Blair, W. P., Long, K. S., Sasaki, M., Gaetz, T. J., Plucinsky, P. P. 2005 AJ, 130, 539
- (14) Gioia, I. M., Maccacaro, T., Schild, R. E., Wolter, A., Stocke, J. T., Morris, S. L., Henry, J. P. 1990, ApJS, 72, 567
- (15) Gordon, S. M. , Kirshner, R. P., Long, K. S., Blair, W. P., Duric, N., Smith, R. C. 1998, ApJS, 117, 89
- (16) Gordon, S. M., Duric, N., Kirshner, R. P., Goss, W. M., Viallefond, F. 1999, ApJS, 120, 247
- (17) Holt, S. S, Schlegel, E. M., Hwang, U., Petre, R. 2003, ApJ, 588, 792
- (18) Hyman, S. D., Calle, D., Weiler, K. W., Lacey, C. K., Van Dyk, S. D. & Sramek, R. 2001, ApJ, 551, 702
- (19) Junkes, N. & Hensler, G. 1996, International Conference on X-ray Astronomy and Astrophysics: Röntgenstrahlung from the Universe, 459
- (20) Kilgard, R. E. et al. 2002, American Astronomical Society, 201, 1416
- (21) Lacey, C., Duric, N., Goss, W. M. 1997, ApJS, 109,417
- (22) Lacey, C. K. & Duric, N. 2001, ApJ, 560, 719
- (23) Magnier, E. A. et al. 1995, A&A, 114, 215
- (24) Mathewson, D. S. & Clarke, J. N. 1973, ApJ, 180, 725
- (25) Matonick, D. M. & Fesen, R. A. 1997, ApJS, 112, 49 (MF97)
- (26) Matonick, D. M., Fesen, R. A., Blair, W. P. & Long, K. S. 1997, ApJS, 113, 333
- (27) Mavromatakis, F., Boumis, P. & Paleologou, E. V. 2002, A&A, 387, 635
- (28) Mizuno, T., Ohbayashi, H., Iyomoto, N. & Makishima, K. 1998, IAUS, 188, 284
- (29) Morley, J. E., Briggs, K. R., Pye, J. P., Favata, F., Micela, G., Sciortino, S. 2001, MNRAS, 326, 1161
- (30) Niklas, S., Klein, U., Braine, J. & Wielebinski, R. 1995, A&AS, 114, 21
- (31) Oka, S., Wakamatsu, K., Sakka, K., Nishida, M., & Jugaku, J. 1974, PASJ, 26, 289
- (32) Oke, J. B. 1974, ApJS, 27, 21
- (33) Osterbrock, D. E. 1989, S&T, 78, 491
- (34) Pannuti, T. G., Duric, N., Lacey, C., Goss, W. M., Hoopes, C. G., Walterbos, R. A. M., Magnor, M. A. 2000, ApJ, 544, 780
- (35) Pannuti, T. G., Swartz, D. A., Duric, N., Urosevic, D. 2002, American Astronomical Society, 200, 3505
- (36) Pannuti, T. G, Schlegel, E. M. & Lacey, C. K. 2007, AJ, 133, 1361
- (37) Pence, W. D., Snowden, S. L., Mukai, K. & Kuntz, K. D. 2001, ApJ, 561, 189
- (38) Schlegel, E. M., Holt, S. S., Petre, R. 2003, ApJ, 598, 982
- (39) Schlegel, E.M., Panutti, T.G. 2003, AJ, 125, 3025 ´
- (40) Sersic, J. L. 1973, PASP, 85, 103
- (41) Simons, D. A., Depoy, D. L., Becklin, E. E., Capps, R. W., Hodapp, K.-W. & Hall, D. N. B. 1988, ApJ, 335, 126
- (42) Smith, R. C., Kirshner, R. P., Blair, W. P., Long, K. S., & Winkler, P. F. 1993, ApJ, 407, 564
- (43) Stone, R. P. S. 1977, ApJ, 218, 767
- (44) Trumper, J. 1984, PhyS, 7, 209
- (45) Tsai, Chao-Wei, Turner, J. L., Beck, S. C., Crosthwaite, L. P., Ho, P. T. P., Meier, D. S. 2006, AJ, 132, 2383
- (46) Tschoke, D., Hensler, G. & Junkes, N. 2003, A&A, 411, 41
- (47) Wynn-Williams, C. G. & Becklin, E. E. 1985, ApJ, 290, 108
| Name | FWHM | |
|---|---|---|
| Wavelength () | ||
| [SII] | 6728 | 54 |
| continuum | 6964 | 350 |
| H | 6563 | 80 |
| continuum | 6446 | 123 |
| Galaxy Name | Date | Filter | Exposure |
|---|---|---|---|
| (s) | |||
| NGC 2903 | 2006 March 4/5 | [SII] | 3600 |
| 2006 March 4/5 | H | 3600 | |
| 2006 March 4/5 | continuum-6446 | 2300 | |
| 2006 March 4/5 | continuum-6964 | 2300 | |
| 2006 March 5/6 | [SII] | 6600 | |
| 2006 March 5/6 | H | 6600 | |
| 2006 March 5/6 | continuum-6446 | 4300 | |
| 2006 March 5/6 | continuum-6964 | 4300 |
| SNR Name | RA | DEC | [SII]/H | I(H) |
|---|---|---|---|---|
| (J2000.0) | (J2000.0) | (erg cm-2s-1) | ||
| SNR1 | 9:32:12.5 | +21:32:30 | 0.41 | 9.4E-15 |
| SNR2 | 9:32:13.7 | +21:30:48 | 0.74 | 1.7E-14 |
| SNR3 | 9:32:10.7 | +21:29:19 | 0.57 | 1.6E-14 |
| SNR4 | 9:32:12.5 | +21:29:06 | 0.42 | 5.4E-15 |
| SNR5 | 9:32:11.1 | +21:28:23 | 0.53 | 1.1E-14 |
| Line | SNR4 |
|---|---|
| H(4861) | 100 |
| OIII(4959) | - |
| OIII(5007) | 11 |
| NII(5200) | - |
| He(5876) | - |
| OI(6300) | - |
| OI(6364) | - |
| NII(6548) | 30 |
| H(6563) | 280 |
| NII(6583) | 98 |
| SII(6716) | 62 |
| SII(6731) | 55 |
| E(B-V) | 0.032 |
| I(H ) | 5.4E-15 erg cm-2s-1 |
| /H | 0.42 |