Bidirectional cooperative motion of myosin-II motors on actin tracks with randomly alternating polarities
Abstract
The cooperative action of many molecular motors is essential for dynamic processes such as cell motility and mitosis. This action can be studied by using motility assays in which the motion of cytoskeletal filaments over a surface coated with motor proteins is tracked. In previous studies of actin-myosin II systems, fast directional motion was observed, reflecting the tendency of myosin II motors to propagate unidirectionally along actin filaments. Here, we present a motility assay with actin bundles consisting of short filamentous segments with randomly alternating polarities. These actin tracks exhibit bidirectional motion with macroscopically large time intervals (of the order of several seconds) between direction reversals. Analysis of this bidirectional motion reveals that the characteristic reversal time, , does not depend on the size of the moving bundle or on the number of motors, . This observation contradicts previous theoretical calculations based on a two-state ratchet model (Badoual et al., Proc. Natl. Acad. Sci. USA, 2002, 99, 6696), predicting an exponential increase of with . We present a modified version of this model that takes into account the elastic energy due to the stretching of the actin track by the myosin II motors. The new model yields a very good quantitative agreement with the experimental results.
1 Introduction
Cells utilize biological motors for active transport of cargo along their respective filaments to specific destinations ref1 . Various types of motor proteins have different preferred directions of motion. Most kinesins and myosins, for instance, move towards the plus end of microtubules (MTs) and actin filaments, respectively ref2 . Others, such as Ncd and myosin VI, move towards the minus end ref3 ; ref4 . While some processes, such as the transport of cargoes is achieved mainly by the action of individual motors, other processes, such as cell motility and mitosis, require the cooperative work of many motors. Muscle contraction, for instance, involves the simultaneous action of hundreds of myosin II motors pulling on attached actin filaments and causing them to slide against each other ref5 . Similarly, groups of myosin II motors are responsible for the contraction of the contractile ring during cytokinesis ref6 . In certain biological systems, cooperative behavior of molecular motors produces oscillatory motion. In some insects, for instance, autonomous oscillations are generated within the flight muscle ref7 . Spontaneous oscillations have also been observed in single myofibrils in vitro ref8 . Finally, dynein motors could be responsible for the oscillatory motion of axonemal cilia and flagella ref9 ; ref10 .
The directionality of individual motors stems from interactions between different parts of the motor and from interactions between the motor and the track filament ref11 ; ref12 . The direction of motion of a large collection of motors may also be influenced by their cooperative mode of action. Specifically, in several recent experiments the ability of motors to cooperatively induce bidirectional motion has been demonstrated. These in vitro experiments were performed by using motility assays in which a filament glides over a dense bed of motors. In one such experiment, unidirectional motion of actin filaments due to the action of myosin II motors was transformed into bidirectional motion by the application of an external stalling electric field ref13 . Under such conditions the external forces acting on the actin filament nearly balance the forces generated by the motors. Electric field was also used to bias the direction of motion in kinesin-MT systems ref13b . In another experiment, bidirectional motion of MTs was observed when subjected to the action of an ensemble of NK11 motors ref14 . These motors are a mutant form of the kinesin related Ncd, which individually exhibit random motion with no preferred directionality ref14 . More recently, the motion of MTs on a bed of a mixed population of plus-end (kinesin-5 KLP61F) and minus-end (Ncd) driven motors was shown to exhibit dynamics whose directionality depends on the ratio of the two motor species, including bidirectional movement over a narrow range of relative concentrations around the “balance point” ref15 . Similarly, bidirectional transport of microspheres coated with kinesin (plus-end directed) and dynein (minus-end directed) on MTs was also reported ref15b .
Several aspects of cooperativity in molecular motor systems have been addressed using different theoretical models ref15 ; ref16 ; ref17 ; ref18 ; ref19 ; ref20 ; ref21 ; ref22 ; ref23 ; ref24 . One feature which has not been treated in these studies is the dependence of the motion on the number of acting motors. A notable exception is the work of Badoual et al. ref18 , where a two-state ratchet model has been used to examine the bidirectional motion observed in the NK11-MT motility assay described in ref. ref14 . The model of Badoual et al. ref18 demonstrated the ability of a large group of motors working cooperatively to induce bidirectional motion, even when individually the motors do not show preferential directionality. (The model also predicts that directional motors can also induce bidirectional movement, if the filaments are close to stalling conditions in the presence of an external load.) According to this model, the characteristic time in which the filament undergoes direction reversal (“reversal time”), , increases exponentially with the number of motors, . Thus, the reversal time diverges in the “thermodynamic limit” , and the motion persists in the direction chosen at random at the initial time.
In this work, we present an in vitro motility assay in which myosin II motors drive the motion of globally a-polar actin bundles. These a-polar bundles are generated from severed (polar) actin filaments whose fragments are randomly recombined. When subjected to the action of a bed of myosin II motors, these a-polar bundles exhibit bidirectional motion with characteristic reversal times that are in the range of sec. The reversal times of the dynamics show no apparent correlation with the size of the gliding bundles, or equivalently, with the number of motors interacting with the track (which, because of the homogeneous spreading of the motors on the bed, is expected to be proportional to the size of the moving bundle). This observation is clearly in disagreement with the strong exponential dependence of on , predicted by Badoual et al.ref18 .
Here, we propose a modified version of this model that explains the experimentally observed independence of on . We argue that the origin of this behavior can be attributed to the tension developed in the actin track due to the action of the attached myosin II motors. An increase in the number of attached motors leads to an increase in the mechanical load which, in turn, leads to an increase in the detachment rate of the motors, as already suggested in models of muscle contraction ref21 ; ref22 ; ref23 ; ref24 . Unlike most previous studies where the myosin conformational energy was calculated, in this work we consider the elastic energy stored in the actin track and demonstrate that the detachment rate increases exponentially with . This unexpectedly strong effect (which is another, indirect, manifestation of cooperativity between the motors) suppresses the exponential growth of with .
2 Materials and Methods
2.1 Protein purification
2.2 NEM myosin II
N-ethylmaleimide (Sigma, Co.) inactivated myosin II was prepared according to standard protocol of Khun and Pollard ref27 .
2.3 Optical Microscopy
Actin assembly was monitored for 30 minutes by fluorescence with an Olympus IX-71 microscope. The labeled actin fraction was and the temperature at which the experiments were conducted was . Time-laps images were acquired using a DV-887 EMCCD camera (Andor Co., England).
2.4 Motility assay
Protocol for this assay was adopted from Kuhn et al. ref27 . The assay includes two essential steps: (a) immobilization of actin filaments on a bed of NEM myosin II inactivated motors, and (b) addition of active myosin II motors at a defined concentration. For that purpose, 7.5-8.5l of 0.2M NEM myosin II is introduced into a flow chamber (26mm2mm glass surface area) for 1 minute of incubation followed by wash of the flow chamber with BSA solution to passivate the surface. Following this, actin filaments were grown on the surface (3M 10% O.G. labeled). Finally, the cell was supplemented with 8l of 0.6M myosin II motors (in 2X myosin solution containing: 3.3mM . 2mM EGTA, 20mM HEPES pH=7.6, 1% MethylCellulose, 3.34mM Mg-ATP, 400mM DTT, 17.6mM Dabco), supplemented with 0.133M KCl, 5M Vitamin D, and an ATP regenerating system containing 0.1mg/ml Creatine Kinase (CK) and 1mM Creatine Phosphate (CP). At the KCl concentrations used in this assay, the myosin II motors are assembled in small motor aggregates (16 myosin II units/aggregate) also known as mini-filaments ref28 . Fluorescent images were taken every 2 seconds for 30 minutes.
2.5 Data Analysis
The position of fluorescent bundles was determined as the intensity center of mass using METAMORPH (Molecular Devices) software. The position was analyzed using a custom MATLAB (The MathWorks, Inc.) program. The data was corrected for stage drift. We first measured the fluctuations of the positions of the bundles in the absence of ATP (i.e., when the motors are not active). Under such conditions, the positions of the bundles measured every 1 sec exhibit a Gaussian distribution with zero mean and standard deviation nm (Supplementary Information ? Figure S1). Bidirectional motion (with ATP) was evaluated based on snapshot taken every 2 sec. We set as the experimental uncertainty since position changes that are smaller then cannot be unambiguously identified as a change in the direction of motion caused by the action of the motors.
2.6 Estimation of number of interacting motors
In order to evaluate the number of acting motors, the dimensions of the bundles and the motors surface concentration, , must be determined. We estimate by assuming that all the motors that were introduced into the flow chamber adhere to the top and bottom glass surfaces of the flow cell (total surface, 104 ). This gives , which corresponds to densely packed motor beds (typical distance of a few nanometers between motor heads). At such high densities, inhomogeneities associated with the assembly of motors into mini-filaments can be ignored.
The length of a bundle, , was measured using METAMORPH software. The width of a bundle was estimated by dividing its fluorescence intensity by the intensity of single actin filaments, which gives an estimate for the number of filaments, , composing the bundle. Assuming that the shape of the bundle is cylindrical, its radius can be estimated as , where nm is the actin filament radius. The motors can only interact with the part of the bundle that faces the myosin bed covered surface. Assuming that this part corresponds to roughly a quarter of the surface of the bundle, we find that the area that comes into contact with the motors . The number of interacting motors is, thus, given by . Using this approximation and the measured surface concentration and bundle dimensions, we estimate (see Fig. 6) that for most of the bundles studied in this work.
2.7 Computer simulations
A detailed discussion on the computational model is found in the section 4, below. The model is based on the model presented in ref. ref18 , where rigidly coupled equidistant motors interact with a one-dimensional periodic potential representing the actin track. The spacing between the motors is larger than and incommensurate with the periodicity of the potential, . The track consists of periodic units, which are replicated periodically. In each unit of the track, a force of magnitude and random directionality is introduced which defines the local polarity of the track. Globally a-polar tracks were generated by setting the total random force to zero (i.e., choosing an equal number of periodic units in which the random forces point to the right and left). The motion of the motors on these tracks was calculated by numerically integrating the equations of motions [] (see Eq. 1 and following text) with time step msec. The position of one of the motors along the track was recorded every 0.25 sec, and changes in the direction of the motion of the motors were identified by analyzing the position of this motor. The distribution of reversal times, , follows an exponential distribution: , from which was extracted. The error bars in Fig. 7C represent one standard deviation of the distribution of reversal times measured for different realizations of globally a-polar tracks of similar size. For each value of , the number of simulated realizations is 40.
3 Results
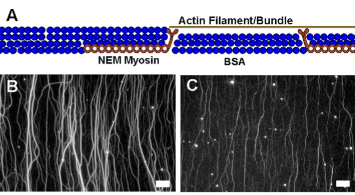
A diagrammatic representation of the system is displayed in Fig. 1. The protocol, based on that of Kuhn et al. ref27 , is described in detail above. In brief, the surface of a microscope slide was saturated with NEM-inactivated myosin II motors (drawn as long, two headed, brown objects at the bottom of Fig. 1A) and passivated by BSA (blue balls in Fig. 1A). Subsequently, actin filaments/bundles (thin yellow line, Fig. 1A) were grown and held firmly on the underside of the NEM-myosin II bed. Fig. 1B shows a characteristic fluorescent microscope image of the system which, at this stage, consisted of a large number of long actin bundles. The bundles were formed due to the presence of free ions (concentration 1.67 mM), which induced attractive electrostatic interactions between the actin filaments ref29 . Unlike bundles formed by certain actin-binding proteins, filaments formed by condensation in the presence of multivalent cations are randomly arranged within the bundles without any specific polarity ref30 ; ref31 . At lower concentrations of (0.5?mM), both thinner bundles and single filaments were observed (Fig. 1C).
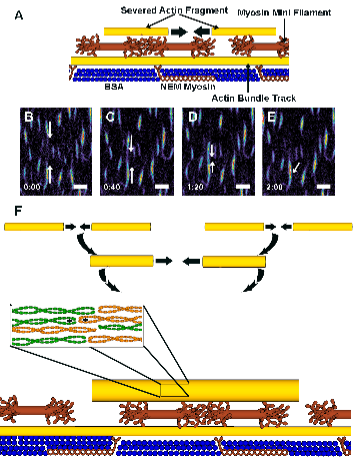
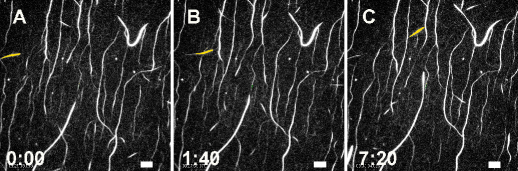
After the initial step, myosin II minifilaments (multi-headed brown objects, Fig. 2A) were added to the cell sample. The motors that landed on the BSA surface created a homogeneous bed of immobile, yet active, motors. Other motors landed on the actin filaments/bundles present on the surface. These motors started to move along the actin tracks, thereby exerting forces on the actin filaments, which led to the severing of small actin fragments ref32 ; ref33 (Fig. 2A). The ruptured actin fragments were then free to move rapidly on the bed of active myosin II motors. When gliding bundle fragments came into close proximity to other bundles, they could fuse, creating new, a-polar, bundles (Fig. 2A. See also Supplementary Information - movie 1, showing a small actin piece severed from a filament, moving rapidly and fusing with a distant existing bundle). These newly created bundles could further fuse with each other to form even larger objects (see Fig. 2F and the sequence of snapshots in Figs. 2B-E depicting one such event of fusion of bundles). The rate of fusion events decreased with time and, after several minutes, the system relaxed into its final configuration, shown schematically in Fig. 2F). Notice that the severing and rearrangement of the originally formed actin filaments/bundles (Fig. 1B) led to the formation of much shorter bundles (Figs. 2B-E). Moreover, the random nature of the multiple fusion processes involved in the generation of these shorter bundles ensured that the final actin tracks were highly a-polar. Indeed, the motion of most of the bundles shown in Supplementary Information - movie 2 was bidirectional (“back and forth” motion), and only those bundles undergoing rare fusion events exhibited unidirectional motion. It is important to emphasize that bidirectional motion was observed only above a certain concentration of added myosin II motors (0.6 M) and only in the presence of ATP. At lower concentrations of motors (0.3 M), the motion of actin bundles was directional (see Fig. 3 and Supplementary Information - movie 3. Note that in movie 3, the motion takes place both along pre-existing actin tracks, as well as on the BSA bed, both which are covered by active myosin II mini-filaments. The motion between these two areas is continuous, demonstrating that the whole surface is covered uniformly with motors.) We, therefore, conclude that the bidirectional movement originates from the action of the active myosin II motors which (i) severed actin pieces, (ii) transported the severed fragments, which fused into actin tracks with randomly alternating polarities, and (iii) moved these a-polar actin tracks bidirectionally (see Supplementary Information - movie 2).
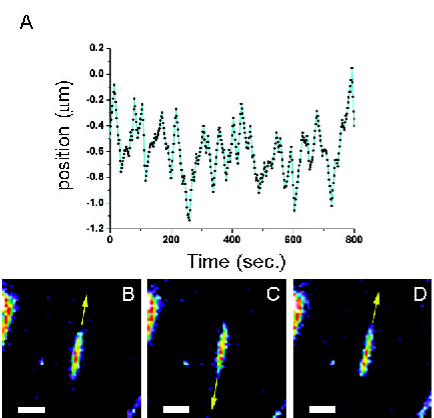
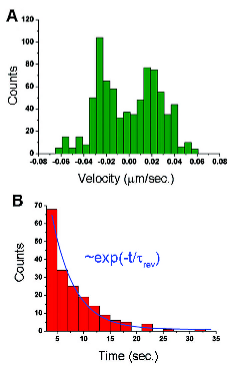
Fluorescence microscopy was used to follow the bidirectional motion of the actin tracks. Fig. 4A shows the position of center of mass of one bundle (three snapshots are shown in Figs. 4B-D) during a period of more than 10 minutes of the experiment. The dynamics of this bundle are representative of the motion of the other actin bundles. Specifically, the one-dimensional motion of the bundle does not persist in the initial direction, but rather exhibits frequent direction changes. Measurements of the position of the center of mass of the bundle were taken at time intervals of sec, and the mean velocity in each such period of motion was evaluated by , where is the displacement of the center of mass (see section 2). Fig. 5A shows the velocity histogram of the bundle shown in Fig. 4. The velocity histogram is bimodal indicating bidirectional motion. The speed of the bundle varies between m/min, which is 2 orders of magnitude lower than the velocities measured in gliding assays of polar actin filaments on myosin II motors ref34 . The fact that the typical speed of the bidirectional motion is considerably smaller than those of directionally-moving polar actin filaments can be partially attributed to the action of individual motors working against each other in opposite directions. The bidirectional movement consists of segments of directional motion which typically last between 2 to 10 time intervals of . The statistics of direction changes is summarized in Fig. 5B which shows a histogram of the number of events of directional movement of duration . The characteristic reversal time, , can be extracted from the histogram by a fit to an exponential distribution: . This form (which, as exemplified in Fig. 5B, fits the data well) is expected if the probability per unit time to ”turn” in the opposite direction is independent of the time since the beginning of motion in a given direction.
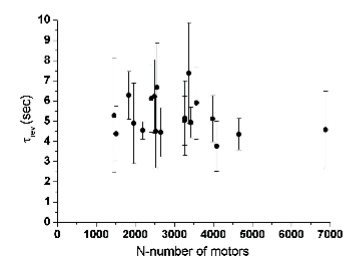
Although Figs. 4 and 5 summarize the results corresponding to the movement of a single actin bundle, these results are representative of several tens of bundles whose motion we followed in several repeated experiments. In these experiments we observed that essentially all a-polar bundles exhibited bidirectional motion. For the sake of our quantitative analysis, we picked a smaller group of 19 bundles (about 25% of all bundels) for which both the reversal time and the number of acting motors (which is proportional to the surface area, see section 2) could be determined with sufficiently high precision. The results corresponding to the motion of this sample of representative bundles are plotted in Fig. 6. The choice of which bundles to include in Fig. 6 is based on the following practical reasons: The fluoresces intensity of small bundles is too low (compared with the background) and, thus, the accurate position and dimensions are hard to determine. Very large bundles are practically immobile and their motion is smaller than the experimental spatial resolution (see Material and Methods - section 2). Thus, the data in Figure 6 includes only bundles of “intermediate” size. One can see in Fig. 6 that while varies over half an order of magnitude, the corresponding are similar to each other ( sec) and show no apparent correlation with .
4 Discussion
The bidirectional motion of motors was previously seen in systems consisting of motors that lack specific directionality ref14 ; ref35 , mixtures of motors working in opposite directions ref15 , or under the action of external forces close to stalling conditions (forces acting on the filament that nearly balance the forces generated by the motors) ref13 . One commonly used model for the dynamics of molecular motors in the biophysics literature is the Brownian ratchet mechanism ref36 . Within this modeling approach, the motion of individual motor proteins is studied by considering the motion of a particle in a periodic, locally asymmetric, potential. It follows from the second law of thermodynamics that if the system is coupled to a thermal bath, the particle subjected to the periodic potential will not exhibit large scale directed motion. Directed motion is possible only if the system is (i) locally asymmetric, and (ii) driven out of equilibrium by an additional deterministic or stochastic perturbation. This perturbation is used in the model to represent the consumption of ATP chemical energy by the motors. Ratchet models are not molecular in nature but rather present a way to identify the minimal physical requirements for the motion of motor proteins. However, by choosing properly the parameters of system, they may be employed to derive quantitative predictions for specific motor-filaments systems. Ratchet models have been extended for describing and analyzing the collective motion of groups of motors. The motion of several motors is influenced by the motor-motor interactions ref36b and mechanical coupling ref18 . The model proposed by Badoual at al. ref18 (and which, below, we present a slightly modified version of) demonstrates that mechanical coupling between the motors is sufficient for the generation of highly cooperative bidirectional motion, even if the motors attach to/detach from the track in an uncorrelated fashion.
A key prediction of the model in Ref. ref18 is the exponential increase of the mean reversal time of the bidirectional motion, , with , the number of motors. This prediction is in contradiction with our experimental results (Fig. 6). Here, we show that this disagreement can be resolved by considering the stretching energy involved in the interactions between the actin track and the “walking” motors. Accounting for this effect eliminates the exponential dependence of on . Moreover, when values representing myosin II-actin systems were assigned to the parameters of the model, we found sec, which in a very good quantitative agreement with the experimental data.
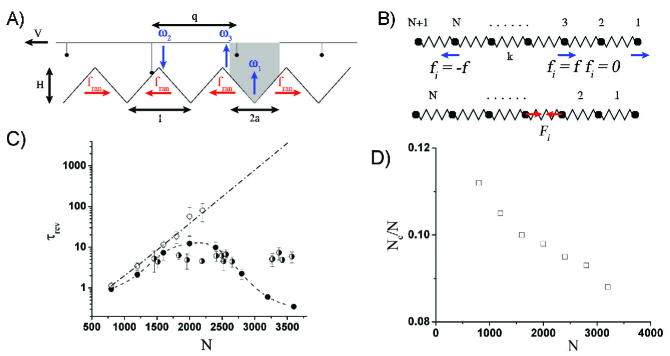
Our model is illustrated schematically in Fig. 7A: We consider the 1D motion of a group of point particles (representing the motors) connected to a rigid rod with equal spacing . The actin track is represented by a periodic saw-tooth potential, , with period and height . We choose , which satisfies the requirements of the model ref18 for to be larger than and incommensurate with the periodicity of the potential. The locally preferred directionality of the myosin II motors along the actin track is introduced via an additional force of size exerted on the individual motors. In each unit of the periodic potential, this force randomly points to the right or to the left (the total sum of these forces vanishes), which mimics the random, overall a-polar, nature of the actin bundles in our experiments.
The instantaneous force between the track and the motors is given by the sum of all the forces acting on the individual motors:
| (1) |
where is the coordinate of the -th motor. The two terms in the square brackets represent the forces due to the symmetric saw-tooth potential and the additional random local forces acting in each periodic unit. The latter are denoted by red arrows in Fig. 7A. The function takes two possible values, 0 or 1, depending on whether the motor is detached or attached to the track, respectively, at time . The group velocity of the motors (relative to the track) is determined by the equation of motion for overdamped dynamics: . The friction coefficient, , depends mainly on motors attached to the track at a certain moment and is therefore proportional to the number of connected motors, at time : .
To complete the dynamic equations of the model, we need to specify the transition rates between states (0 - detached; 1 - attached). The motors change their states independently of each other. We define an interval of size centered around the potential minima (the gray shaded area in Fig. 7A). If located in one of these regions, an attached motor may become detached () with a probability per unit time . Conversely, a detached motor may attach to the track () with transition rate only if located outside this region of size . However, we also allow another independent route for the detachments of motors, which may take place outside the gray shaded area in Fig.7A (i.e., around the potential maxima) and is characterized by an off rate . The rates , , (see blue arrows in Fig. 7A), represent the probabilities per unit time of a motor to (i) detach after completing a unit step, (ii) attach to the track, or (iii) detach from the track without completing the step.
Generally speaking, the rates of transitions between states depend on many biochemical parameters, most notably the types of motors and tracks, and the concentration of chemical fuel (e.g., ATP). They may also be affected by the forces induced between the motors and the filament, which result in increase in the configurational energy of the attached myosin motors ref21 ; ref22 ; ref23 ; ref24 and in the elastic energy stored in the S2 domains of the mini-filaments, as well as an increase in the stretching energy of the actin filament. The latter contribution can be introduced into the model via a modified detachment rate given by: , where is the change in the elastic energy of the actin track due to the detachment of one motor head. The dependence of on the number of connected motors (out of a total number of motors, ) can be estimated in the following manner: Consider a series of point particles connected by identical springs (representing a series of sections of actin filaments) having a spring constant (see Fig. 7B). Let us assume that random forces act on the particles and denote the force applied on the particle with index i () by . Assume that each of these forces can take three possible values: (representing attached motors locally pulling the track to the left), (attached motors pulling the track to the right), and 0 (detached motors not applying force). Defining the ”excess force” with respect to the mean force acting on the particles: [where ], one can show that the force stretching (or compressing) the -th spring in the chain is given by the sum of excess forces acting on all the particles located on one side of the spring
| (2) |
From Eq. 2 it can be easily verified that . We thus conclude that the excess forces acting on the particles, , represent a series of random quantities with zero mean. Therefore, the size of can be estimated by mapping the chain of springs into the problem of a 1D random polymer ring ref37 , where the elastic energy stored in the -th spring, , plays the role of the squared end-to-end distance between the monomer and the origin. From this mapping we readily conclude that the energy of most of the springs (except for those located close to the ends of the chain) scales linearly with the number of attached motors: . The total elastic energy of the chain scales as
| (3) |
and when a motor detaches from the track (),
| (4) |
where is a dimensionless prefactor.
We simulated the dynamics of an -motor system, choosing parameters corresponding to the myosin II-actin system. The period of the potential nm corresponds to the distance between binding sites along the actin track ref38 ; ref39 ; ref40 , and the amplitude of the symmetric potential is set to . Thus, the force generated by each motor head on the track is pN (first term in square brackets in Eq. 1). The magnitude of the random force that defines the local polarity of the track (second term) is given by pN, so the total force acting on each motor head ranges between about 5 to 15 pN ref38 ; ref39 ; ref41 ; ref42 . The interval around the potential minima from which motors can detach from the track with rate is chosen to be nm. The transitions rates between attached and detached states are ms and ms ref43 ; ref44 ; ref45 ; ref46 . With this choice of parameters, we obtain a system with a low fraction of attached motors (see Fig. 7D). We also set the friction coefficient per attached motor to kg/s, which yields the experimentally measured velocity nm/ms m/min. The rate expresses the probability of a single motor head to detach from the track without advancing to the next unit. The probability of such an event is 1-2 orders of magnitude smaller than the complementary probability to execute the step. We take ref46 , which yields ? ms. Finally, the exponent appearing in Eq. 4 is evaluated by:
| (5) |
where Pa is Young’s modulus for actin and is the cross sectional area of an actin filament ref46 . For the model parameters: pN, nm, we find .
Fig. 7C shows the computationally measured reversal time as a function of for . This range largely overlaps with the estimated range of number of motors in our experiments (see Fig. 6. The experimental data points in this range of are replotted in Fig. 7C and denoted in half-filled circles). For each , the computational results represent the average computed for 40 different realizations of random, overall a-polar, tracks. The error bars represent the standard deviation of between realizations, where for each realization is estimated by fitting the histogram of turning times to an exponential decay function (as in the experimental part - see Fig. 5B). Two sets of computational data are shown in Fig. 7C: one corresponding to (solid circles), and the other to (open circles), i.e., without considering the effect of actin stretching, but when all the other system parameters mentioned above are kept unchanged. The latter case is qualitatively similar to the model presented in ref. ref18 , exhibiting a very strong exponential dependence of on (indicated by the straight dashed-dotted line in Fig. 7C). In contrast, the data corresponding to show much weaker variation in upon changing . The mean reversal times computed for are found in the range sec, which is in a very good quantitative agreement with the corresponding range of experimental results, and certainly does not grow to values of thousands of seconds as predicted for . The validity of our ratchet model is quite remarkable in view of its extreme simplicity; but one must be aware of the following points of disagreement between the experimental and computational results (which illustrate the limitations of the model): (1) The computed reversal times show weak, non-monotonic, dependence on which is not observed experimentally. (2) The largest computed ( sec for ) is slightly larger than the experimentally measured reversal times. (3) The computational results for and cannot be directly compared with experimental results since the corresponding reversal times ( sec) fall below the experimental resolution.
The decrease of the computed reversal times for can be attributed to the “mean field” nature of calculation of , i.e., to our assumption that (for a given ) the detachment of each motor head leads to the same energy gain (see Eq. 4). In reality, the energy change upon detachment of a motor depends, in some complex manner, on a number of factors such as the positions and chemical states of the motors. Motors which release higher energy will detach at higher rates, and the detachment of these “energetic” motors will lead to the release of much of the elastic energy stored in the actin track. We, therefore, conclude that within the mean field approach, the number of disconnecting motors and the frequency of detachment events are probably over-estimated. This systematic error of the mean field calculation increases with , and the result of this is the decrease of in this regime, which is not observed experimentally. For even larger values of (), the model fails because and the effective attachment rate outside the gray shaded area in Fig. 7A, , becomes negative, i.e., motors detach from the track faster than they attach to it. In contrast, for , , and the effective attachment rate barely changes upon changing the model parameter from (ref. ref18 ) to (our model). This seemingly minute change in (which, nevertheless, involves a dramatic increase in ) leads to the following non-trivial outcome: On the one hand, the fraction of attached motors remains unchanged. The data shown in Fig. 7D corresponds to both values of for which the results for are indistinguishable. On the other hand, the reversal times drop by as much as three orders of magnitude (for ) when is modified from 0 to 0.0018. This spectacular decrease in is, therefore, not the result in the change in the number of attached motors (since, for each value of , the same fraction of motors is attached for both values of ), but rather can be related to the less regular manner by which the motors detach from the track. The more frequent stochastic detachments of motors from the actin track increases the probability per unit time of motion reversal.
5 Conclusion
We have investigated the dynamics of myosin II motors on actin tracks composed of small filamentous segments with randomly alternating polarities. The absence of global polarity leads to a bidirectional relative motion between the motors and the tracks. The characteristic reversal time of this motion is of the order of a few seconds and exhibits no particular dependence on the number of acting motors. Bidirectional motion with macroscopic reversal times has been previously observed for NK11 motors on microtubules and has been attributed to the cooperativity of the motors. According to previously proposed models, the signature of such a bidirectional cooperative motion is the strong exponential dependence of on . The contradiction of this prediction with our experimental results can be reconciled by incorporating an additional feature into the model, namely, the effect of actin stretching by the walking motors. To reduce the associated elastic energy, the off rate of motors increases, and many of them detach from the track before completing a unit step. This effect reduces considerably and eliminates its exponential growth with .
Single molecule experiments have led to a dramatic increase in our understanding of the structure and dynamics of individual molecular motors. However, many biological processes such as muscle contraction, cytokinesis, and the motion of axonemal cilia and flagella, involve cooperative action of many motors, which may be affected by the structure of the underlying track. This concept is clearly demonstrated in this work dealing with the bidirectional motion of myosin II motors on actin tracks with randomly alternating local polarities, but without a net preferred directionality at the mesoscopic level. This unique type of motion is induced by the forces of individual motors whose collective effect is manifested in macroscopically large reversal times. At the same time, the cooperativity of these forces also increases the elastic energy of the track, and thereby limits the growth of .
6 Acknowledgment
We thank Nir Gov, Yoav Tsori and Oleg Krichevsky for useful discussions. A.B.G wishes to thank the Joseph and May Winston Foundation Career Development Chair in Chemical Engineering, the Israel Cancer Association (grant No. 20070020B) and the Israel Science Foundation (grant No. 551/04).
References
- (1) R. Vale, Cell, 2003, 112, 467-480.
- (2) H. Higuchi and S. A. Endow, em Curr. Opin. Cell Biol, 2002, 14, 50-57.
- (3) H. B. McDonald, R. J. Stewart and L. S. Goldstein, Cell, 1990, 63, 1159-1165.
- (4) M. Schliwa, Nature, 1999, 401, 431-432.
- (5) M. A. Geeves and K. C. Holmes, Annu. Rev. Biochem., 1999 68, 687-728.
- (6) B. Feierbach and F. Chang, Curr. Opin. Microbiol., 2001 4, 713-719.
- (7) K. E. Machine and J. W. S. Pringle, Proc. R Soc. Lond. B Biol. Sci., 1959,151, 204-225.
- (8) K. Yasuda, Y. Shindo and S. Ishiwata, Biophys. J., 1996, 70, 1823-1829.
- (9) S. Camalet and F. Jülicher New J. Phys., 2000, 2, 1-24.
- (10) C. J. Brokaw, Proc. Natl. Acad. Sci. USA, 1975, 72, 3102-3106.
- (11) S. A. Endow, Nat. Cell Biol., 1999, 1, 163-167.
- (12) .J. Ménétry, A. Bahloul, A. L. Wells, C. M. Yengo, C. A. Morris, S. A. Sweeny and A. Houdusse, Nature, 2005, 435, 779-785.
- (13) D. Riveline, A. Ott, F. J?icher, D. A. Winklemann, O. Cardoso, J. J. Lacap?e, S. Magnúsdóttir, J. L. Viovy, L. Gorre-Talini and J. Prost, Eur. Biophys. J., 1998, 27, 403-408.
- (14) M. G. L. van den Heuvel, M. P. de Graaff and C. Dekker, Science, 2006, 312, 910-914.
- (15) S. A. Endow and H. Higuchi, Nature, 2000, 406, 913-916.
- (16) L. Tao, A. Mogliner, G. Civelekoglu-Scholey, R. Wollman, J. Evans, H. Stahlberg and J. M. Scholey, Curr. Bio., 2006, 16, 2293-2302.
- (17) R. Yokokawa, M. C. Terhan, T. Kon and H. Fujita, Biotechnol. Bioeng., 2008, 101, 1-8.
- (18) F. Jülicher and J. Prost, Phys. Rev. Lett., 2005, 75, 2618-2621.
- (19) F. Jülicher and J. Prost, Phys. Rev. Lett., 1997, 78, 4510-4513.
- (20) M. Badoual, F. Jülicher and J. Prost, Proc. Natl. Acad. Sci. USA, 2002, 99, 6696-6701.
- (21) Y. Shu and H. Shi, Phys. Rev. E., 2004,68, 021912.
- (22) C. J. Brokaw, C. J, Cell Motil. Cytoskeleton, 2005, 60, 35-47.
- (23) D. A. Smith and M. A. Geeves, Biophys. J., 1995, 69, 524-537.
- (24) T. A. J Duke, Proc. Natl. Acad. Sci. USA, 1999, 96, 2770-2775.
- (25) G. Lan and S. X. Sun, Biophys. J., 2005, 88, 4107-4117.
- (26) R. E. L De Ville and E. Venden-Eijnden, Bull. Math. Bio., 2008, 70, 484-516.
- (27) J. A. Spudich and S. Watt, J. Biol. Chem., 1971, 246, 4866-4871.
- (28) S. S Margossian and S. Lowey, Methods Enzymol., 1982, 85, 55-71.
- (29) J. R. Kuhn and T. D. Pollard, Biophys. J., 2005, 88, 1387-1402.
- (30) B. Kaminer and A. L. Bell, J. Mol. Biol., 1966, 20, 391-401.
- (31) E. Grazi, P. Cuneo and A. Cataldi, Biochem J., 1992, 288, 727-732.
- (32) P. A. Janmey, Proc. Natl. Acad. Sci., 2001, 98, 14745-14747.
- (33) G. C. L. Wong, A. Lin, J. X. Tang, P. A. Janmey and C.R. Safinya, Phys. Rev. Lett., 2003, 91, 018103.
- (34) N. A. Medeiros, D. T. Burnette and P. Forscher, Nat. Cell Biol., 2006, 8, 215-226.
- (35) L. Haviv, D. Gillo, F. Backouche and A. Bernheim-Groswasser, J. Mol. Biol., 2008, 375, 325-330.
- (36) S. J. Kron and J.A. Spudich, Proc. Natl. Acad. Sci. USA, 1986, 83, 6272-6276.
- (37) J. L. Ross, K. Wallace, H. Schuman, Y. E. Goldman and E. L. F. Holzbaur, Nat.Cell.Biol., 2006, 8, 562-570.
- (38) P. Reimann, Phys. Rep., 2002, 361, 57-265, and references therein.
- (39) F. Slanina, Europhys. Lett., 2008, 84, 50009.
- (40) P. G. de Gennes, Scaling Concepts in Polymer Physics, 1997 (Cornell Uni. Press, Ithaca).
- (41) J. T. Finer, R. M. Simmons and J. A. Spudich, Nature, 1994, 368, 113-119.
- (42) J. E. Molloy, J. E. Burns, J. Kendrick-Jones, R. T. Tregear and D.C. White, Nature, 1995, 378, 209-212.
- (43) A. D. Mehta, J. T. Finer, and J. A. Spudich, Proc. Natl. Acad. Sci. USA, 1997, 94, 7927-7931.
- (44) C. M. Veigel, M. L. Bartoo, D. C. White, J. C. Sparrow and J. E. Molloy, Biophys. J., 1998, 75, 1424-1438.
- (45) M. J. Tyska, D. E. Dupuis, W. H. Guilford, J. B. Patlak, G. S. Waller, K. M. Trybus, D. M. Warshaw, and S. Lowey, Proc. Natl. Acad. Sci. USA, 1999, 96, 4402-4407.
- (46) M. A. Geeves, Biochem. J. 1991, 5, 1-14
- (47) J. A. Millar and M. A. Geeves, Nature, 1983, 312, 232-237.
- (48) J. W. Cardon and P. D. Boyer, Eur. J. Biochem., 1978, 92, 443-448.
- (49) J. Howard, Mechanics of Motor Proteins and the Cytoskeleton, 2001 (Sinauer Press, Sunderland, Mass.)