Reversible Transport of Interacting Brownian Ratchets
Abstract
The transport of interacting Brownian particles in a periodic asymmetric (ratchet) substrate is studied numerically. In a zero-temperature regime, the system behaves as a reversible step motor, undergoing multiple sign reversals of the particle current as any of the following parameters are varied: the pinning potential parameters, the particle occupation number, and the excitation amplitude. The reversals are induced by successive changes in the symmetry of the effective ratchet potential produced by the substrate and the fraction of particles which are effectively pinned. At high temperatures and low frequencies, thermal noise assists delocalization of the pinned particles, rendering the system to recover net motion along the gentler direction of the substrate potential. The joint effect of high temperature and high frequency, on the other hand, induces an additional current inversion, this time favoring motion along the direction where the ratchet potential is steeper. The dependence of these properties on the ratchet parameters and particle density is analyzed in detail.
pacs:
05.40.-a, 87.16.-bI Introduction
Increasing interest in the manipulation of small objects has attracted much attention to the so called Brownian ratchets Magnasco (1993); Doering et al. (1994); Bartussek et al. (1994); Astumian and Bier (1994); Reimann (2002). These systems are able to promote the directed transport of particles on a periodic substrate lacking reflection symmetry by means of symmetrical, unbiased, non-equilibrium fluctuations. Their applicability can range from understanding the molecular transport of proteins Jülicher et al. (1997); Bader et al (1999) to the controlled transport of flux quanta in superconductors Lee et al. (1999); Vilegas et al. (2003); Van de Vondel et al. (2005); de Souza Silva et al. (2006a, b) and separation of mixtures in nanometric devices Savel’ev et al. (2003). Albeit equilibrium (thermal) fluctuations alone cannot induce such a motion, it plays a key role within transport efficiency when the system is driven out of equilibrium.
Although these systems are designed with a nominal “easy” direction of motion (a gentler slope than that of the ratchet potential), in many cases it is not a trivial task to predict even the real drift direction. In a seminal paper, Doering Doering et al. (1994) illustrated that when the system is driven by a fast non-equilibrium (but stochastic) fluctuating force, the particle current may be reversed towards the “hard” direction, depending upon the noise statistics. Much later, a similar effect was observed for ratchets driven by a high frequency harmonic force Bartussek et al. (1994). In this later case, the reversed motion resulted from the interplay between fast driving and equilibrium white noise, as demonstrated analytically by Fistul Fistul (2002). In both situations described above, the current reversal was induced by stochastic processes.
When several particles are put in a ratchet substrate, their mutual interaction can give rise to a variety of cooperative phenomena Derényi and Vicsek (1995); Jülicher and Prost (1995). Remarkably, even when the substrate potential is perfectly symmetric, directed macroscopic transport of the interacting particles is possible. This can be accomplished, for instance, by spontaneous symmetry breaking when the system is driven out of equilibrium Jülicher and Prost (1995) or by inducing correlated fluctuations in the interparticle bonds Porto et al. (2000). Interparticle interactions can also induce deterministic current reversals. A dramatic example is the recently discovered multiple drift reversals of interacting ratchets de Souza Silva et al. (2006b). Such an effect was observed experimentally in a system of vortices captured by a nanoengineered periodic array of asymmetric pinning sites in a superconducting film. The vortex drift direction was seen to change sign several times as a function of the vortex occupation number. Numerical simulations suggested that such a sequence of reversals is quite general and results from the interplay between particle-particle and particle-substrate interactions. Indeed, other systems of interacting ratchets seem to exhibit similar behavior Shalom and Pastoriza (2005); Lu et al. (2007); Gillijns et al. (2007). This reversed current phenomenon has brought about a high level of controllability over the motion of small particles. Although the necessary ingredients seem to be clearly set, the dynamical mechanism behind this effect is not completely understood. Furthermore, the work carried out so far has not explored the influence of thermal noise and non-adiabatic oscillating forces.
In this paper, we set out to illustrate how the drift of long-range interacting small particles on a ratchet substrate can be manipulated by suitably controlling the interplay between particle-particle and particle-substrate interactions, thermal noise, excitation amplitude, and frequency. As demonstrated in Ref. de Souza Silva et al. (2006b), the drift of repelling particles undergoes multiple sign reversals, from positive (along the easy ratchet direction) to negative (along the hard ratchet direction) as the number of particles per ratchet period () changes from odd to even for low amplitude of the external oscillating force and no thermal noise. In the present work, we show that, at a fixed particle density (), a sequence of reversals emerges as the excitation amplitude is increased above the ratchet threshold. By detailed characterization of the dynamical states, we conclude that such reversals are induced by dynamical transitions of the particle chain. Furthermore, we undertake a detailed analysis of how thermal fluctuations assist the restoration of the positive current and how the combination of thermal noise and a high excitation frequency leads ultimately to the negative ratchet drift.
II System and simulations
We consider interacting particles confined in a one-dimensional asymmetric periodic substrate potential and subjected to a fluctuating driving force. We assumed that the particles evolve in time according to the Langevin equation of motion:
| (1) |
where represents the viscosity coefficient, is the particle mass, is the substrate potential, is the pair potential between particles and , is the fluctuating driving force and is the uncorrelated Gaussian noise, which accounts for the thermal fluctuations at a substrate temperature via the fluctuation-dissipation theorem: .
For the substrate potential, , we assumed the usual asymmetric double-sine function Reimann (2002),
| (2) |
Here and are free parameters controlling the intensity, the asymmetry and the internal structure of the ratchet potential. Some plots of are shown in Fig. 1.

The shape of the potentials can range from one with a single local minimum, for , to one with two local minima per period, for . The interaction potential between particles and is given by a repulsive logarithmic potential,
| (3) |
Such an interaction is relevant for example, for vortices in superconducting thin films. The external driving force is given by , where and are the amplitude and the frequency respectively. Hereafter, we shall adopt the following unit system: , for energy, , for length, , for time, and , for angular frequency.
The simulations were performed on a section of the substrate with size and a total number of particles ranging from 10 to 40 ( and 4) under periodic boundary conditions. The simulations were carried out using a standard finite difference method adapted for stochastic equations. For a given set of parameters, we discarded the first to time steps to allow the system to relax to the dynamical steady state and follow up the same number of time steps for the time averages. To enhance the signal-to-noise ratio, averages were calculated of the physical quantities for several realizations of the thermal noise (up to 50 samples, for low excitation frequencies, and up to 700 samples for high frequencies). The mean particle current, , is calculated by taking the average of the particle center-of-mass (c.m.) velocities, , over time and over the thermal noise realizations. To characterize the dynamical states, the time-averaged density function and the cumulative mass were calculated.
To set a few parameters, we chose and in most simulations. Other values of and a comparison between underdamped and overdamped dynamics is discussed in Sec. III.4.
III Results
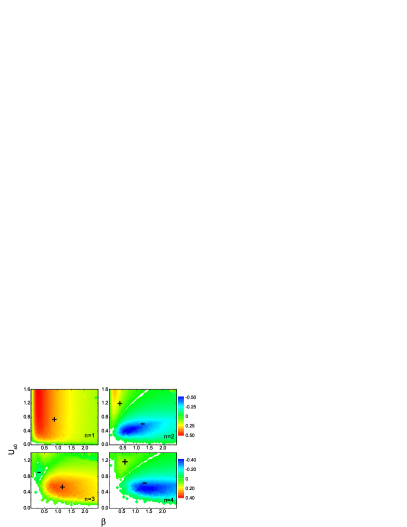
The deterministic (zero temperature) phase diagrams shown in Fig. 2 indicate the preferred direction of the mean particle current for a given occupation number , ranging from to , as a function of and , in the limit where the applied force triggers directed motion, i.e. in the ratchet threshold. This measurement was performed by adiabatically increasing an external force until a collective motion of the particles was observed. The measured threshold forces for motion to the right, , and to the left, , were then used to compute the effective asymmetry parameter , which is positive (negative) for rightward (leftward) motion. The diagrams exhibit the usual sign reversals as a function of and of the ratchet potential parameters and de Souza Silva et al. (2006b).
III.1 The zero-temperature adiabatic regime
Here, the ratchet dynamics is explored when the driving force amplitude is increased within the zero-temperature, low-frequency (adiabatic) regime. Fig. 3
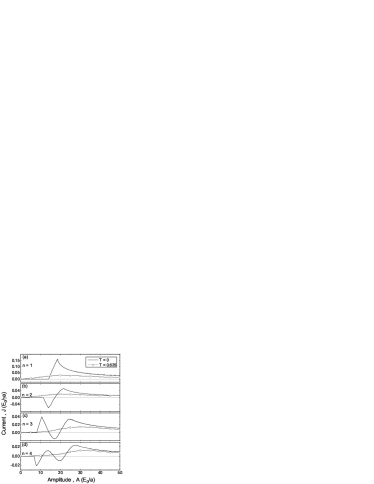
shows the particle current as a function of for , 2, 3, and 4. The calculations were performed for the ratchet potential parameters and (upper curve in Fig. 1) and a frequency of . The deterministic () solutions are given by the solid lines. The noisy adiabatic regime will be discussed further on. For , sign reversals occur with increasing. Such reversals take place well above the ratchet threshold, contrary to those observed in Fig. 2, and therefore are induced by dynamical transitions in the array of particles.
In order to conduct a detailed analysis of the possible dynamical states and dynamical transitions and how they lead to the observed sign reversals, the dynamics of particles driven by constant force values was simulated. The force intensity was slowly ramped up with the force applied to the positive and then to the negative direction. In this case, the net current is given by , with being the mean particle current for the force applied to the right (left). Such dc measurements of the ratchet effect is equivalent to an ac measurement where the oscillating force is an adiabatic square wave Van de Vondel et al. (2005). The advantage of such a strategy is that the dynamical states can be characterized for a constant force during an arbitrary long time interval, thus allowing one to compute statistical quantities for that specific force value.
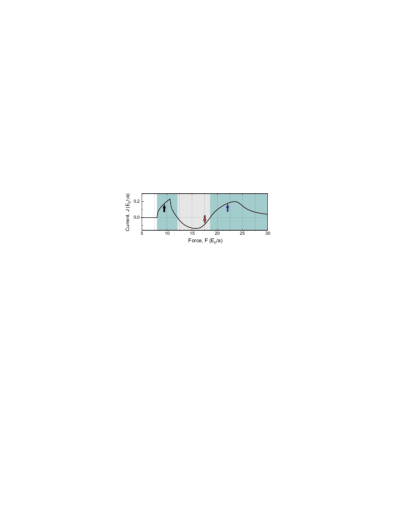
The net current , calculated for the dc measurement described above, as a function of force intensity for , , and , is presented in Fig. 4. The curve qualitatively resembles the curve of Fig. 3-(c), calculated for sinusoidal drives.
Fig. 5 presents plots of the particle density (panel (a)) and of the cumulative mass (panel (b)) for and positive driving forces with intensities , 17.5, and 22. As indicated in Fig. 4, these force intensities correspond to
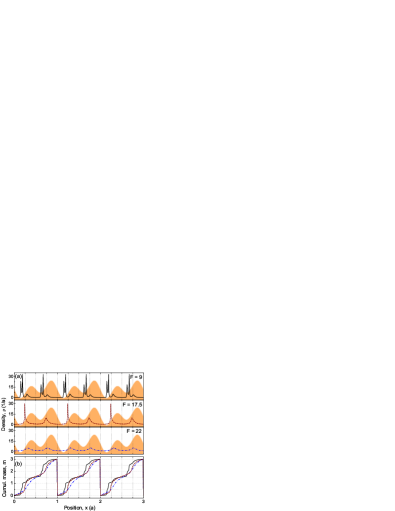
low-amplitude positive current, negative current, and high-amplitude positive current, respectively. The region of low-amplitude positive drift is characterized by a double peak at each local minimum of the substrate potential, which is represented in Fig. 5 as the background area plots. The jumps in , integrated for , is evidence that each double peak observed in corresponds to exactly one particle distributed in the close vicinity of the substrate local minima, i.e. two localized particles per substrate period, while the smoother regions of correspond to a third particle spread out across each substrate period, i.e. one delocalized particle per substrate period. This leads to the conclusion that all minima of the substrate potential are occupied most of the time, except for a very short time interval during which a particle trapped in one minimum is knocked out and replace by another. Therefore, the effective dynamics may be roughly described as (delocalized) particles moving over an effective ratchet potential composed of the bare substrate potential plus the potential due to the other (localized) particles fixed at the local minima of the substrate potential. Clearly, this effective potential preserves the symmetry of the substrate potential, favoring the observed positive current sign. For , however, the peaks at the weaker minima are drastically reduced and the mass distributes broadly near these minima in comparison to the sharp distribution near strong minima. Now, the effective potential comprises particles localized at the stronger minima, rendering an inversion of the effective asymmetry of the system. Finally, at , all peaks are small and there is no point in the substrate potential where is sharply distributed. Hence all particles are now delocalized and the system restores its original symmetry.
For the negative drive direction, a similar sequence of dynamical transitions was observed, but with different critical values of . An overall picture of what happens at positive and negative drive directions and the relevance for the observed ratchet states is given in Fig. 6
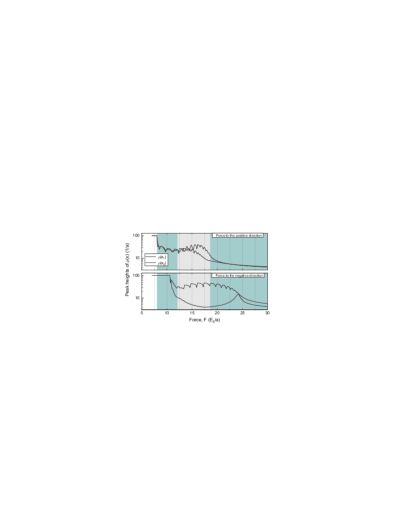
where the main peaks located at the deeper () and the shallower () local minima are plotted against force intensity for different drive orientations. Roughly speaking, the negative current region is characterized most of the time by only one localized particle per substrate period, which tends to invert the system symmetry inducing the negative current, while the positive current regions are mostly characterized by either two (low amplitude) or no (high amplitude) localized particles, which tends to keep the system symmetry. The exact force intensities where the sign inversions take place are a non-trivial result from the competition between the dynamics at positive and negative drive direction.
More generally, at small drive amplitudes, for any , there are particles in a substrate period that can be considered to be localized whereas one particle is delocalized. As the amplitude increases, the localized particles are dynamically delocalized one by one, inducing a total of sign reversals. In other words, the system is sequentially reduced to dynamical states similar to those observed at the small amplitude regime of lower particle density systems.
III.2 Noise-induced sign inversions
To check the effect of thermal fluctuations in the adiabatic limit, detailed simulations of Eq. 1 have been performed for and low frequency (). Fig. 3 presents the mean particle current calculated for (line-dot), which corresponds to the strong noise limit. For this temperature value, the ratchet current is essentially positive for all , particularly in the amplitude ranges where the current direction at is negative, that is, for such amplitude ranges, thermal noise induces a current reversal.
To investigate these noise-induced inversions in greater detail, we calculated the temperature dependence of the net current, , of the particle array for , , and several values of the substrate strength and the drive amplitude . Fig. 7
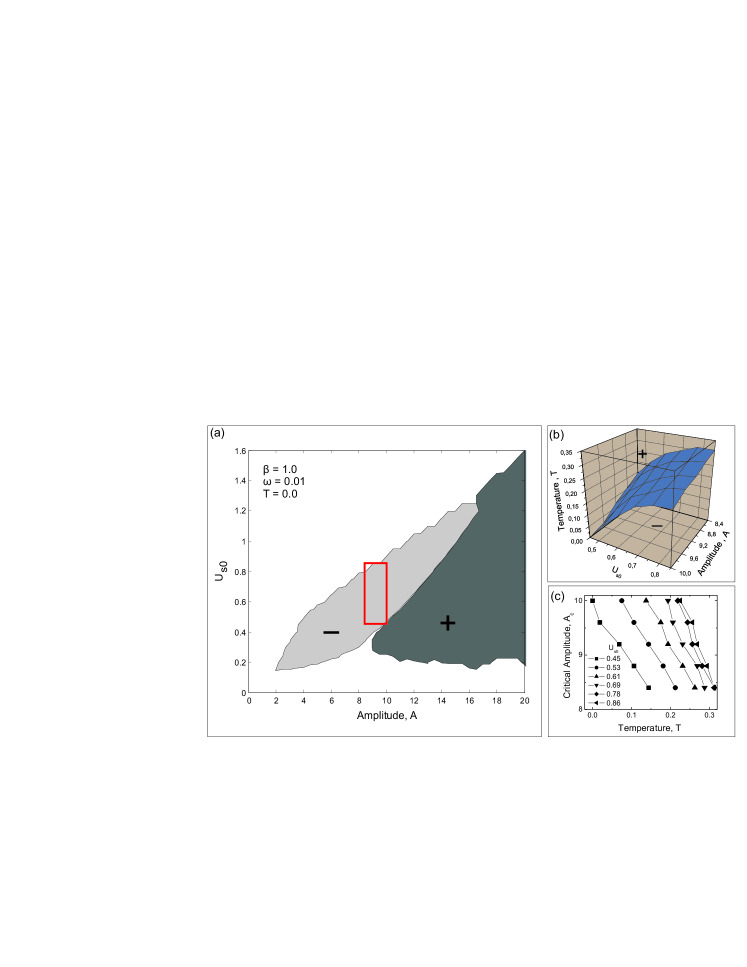
(a) maps the region in the - plane where the drift state is negative. The rectangle depicts the region considered for the simulations. The results of the sweeps were used to build the -- diagram shown in Fig. 7 (b), where the surface represents the transition temperature, , between the negative and the positive drift states.
Interestingly, seems to decrease linearly with the amplitude. In other words, the critical amplitude, , at which the thermally-induced drift inversion occurs, scales as . This becomes evident in Fig. 7-(c) where is plotted for several values of . To understand this behavior, we first recall the results of the previous paragraphs, which show that the inverted ratchet drift observed for a particle array can be described as half of the particles moving over the potential generated by the substrate and the remaining (localized) particles. Therefore, one can roughly associate with the force where such dynamics is destroyed, that is, where the localized particles delocalize, thus restoring the original substrate symmetry. On the other hand, the linear behavior of suggests a transition to a regime of creep motion resulting from thermal activation of the localized particles over the energy barriers of the (tilted) substrate potential. In systems exhibiting similar dynamics, such as flux lines in hard superconductors Kim et al. (1962) and domain walls in ferromagnetic materials Lemerle et al. (1998), the critical force for a detectable creep motion decreases linearly with as long as the relevant energy barrier at zero drive, , has no explicit temperature dependence and Anderson and Kim (1964). In the present case, for , , which is much bigger than near the transition surface, as can easily be inferred from Fig. 7-(b).
III.3 The high frequency regime
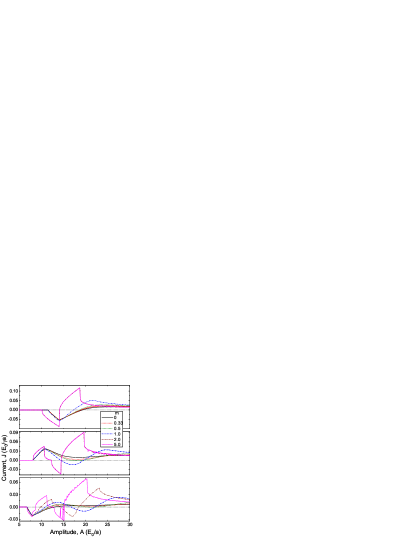
Here we turn our attention to the effects of high frequency drives. To fix some quantities, we set , , and . The amplitude dependence of the mean current for a few frequency and temperature values is shown in Fig. 8.
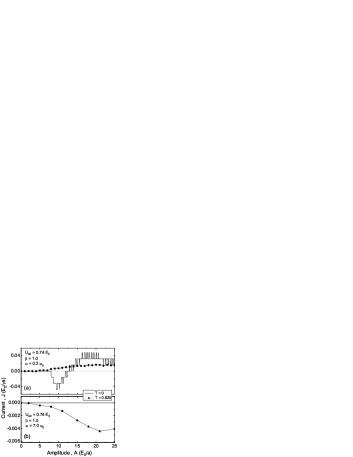
At , is characterized by a series of plateaus and spikes produced by the well-known lock-in effect observed in single-particle rocking ratchets. Notice, however, that the mean particle velocity assumes discretized values at multiples of , which means that each particle moves across an average distance of during a cycle of the external drive. This result is in contrast with that of single-particle ratchets, where the lock-in state corresponds to the particle moving a step forward across a full period of the substrate in one drive cycle, which gives Bartussek et al. (1994). By performing similar simulations for other particle occupation number values, we have observed that, in general, , corresponding to an average particle displacement of per drive cycle. This result provides the opportunity for controlling the particle current accurately, at a given frequency, by changing the particle density.
At non-zero low temperatures the lock-in effect is smeared out by thermal fluctuations. At sufficiently high temperatures, thermally induced current reversals, similar to those observed in the adiabatic regime, are observed in the amplitude range where the zero-temperature drift direction is negative (Fig. 8(a)). However, when the frequency is even higher, the combination of fast rocking () and thermal fluctuations () leads to another reversal, resulting in the negative current sign in the full amplitude range. This result is somewhat expected since, as mentioned above, at a high the particles may be considered independent of one another and, for non-interacting rocking ratchets at high temperatures, a sufficiently high driving frequency induces the negative current Bartussek et al. (1994); Fistul (2002).
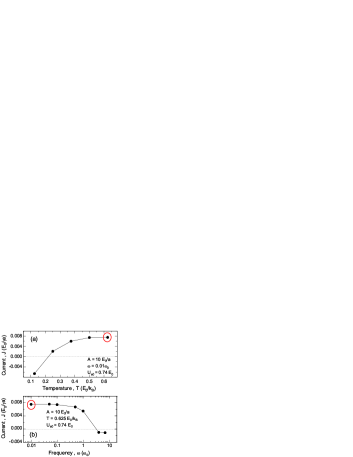
Fig. 9 illustrates the sequence of sign inversions when one first increases the temperature in the adiabatic () regime (a) and then, at a fixed high temperature value (), increases the frequency up to (b). Note that the current induced by high frequencies is approximately one order of magnitude smaller than that induced by temperature. Indeed, the frequency-induced reversed current of non-interacting ratchets is usually small because such inversions occur at frequencies much higher than the natural frequency of the system. The same behavior is observed here because at a high frequency and temperature the system is essentially non-interacting. Interacting ratchets in the adiabatic regime, on the other hand, offer several ways to reverse the sign of the current (by changing either the particle density, the force amplitude or the temperature) while keeping its absolute value at the same order of magnitude.
III.4 Overdamped versus underdamped dynamics
In the previous paragraphs, we explored the dynamical properties of 1D arrays of particles of unity mass moving on a ratchet substrate with friction coefficient . Here, we shall discuss other values of , spanning the overdamped and underdamped regimes. Although the ratchet threshold diagrams calculated for the different values are very similar to those presented in Fig. 2 for , the behavior of the moving phases are qualitatively different for different intervals of values.
As noticed by Borromeo et al. Borromeo et al. (2002), the particle current (for rocking, non-interacting ratchets) behaves qualitatively different from the usual overdamped () limit when the ratio becomes smaller than the libration frequency of the particles at the bottom of the ratchet wells (, with the spring constant of the well). In this moderate underdamped regime, the onset of the ratchet current becomes abrupt and the ratchet tail in decays faster as compared to the of an overdamped ratchet. When , however, the above described behavior is substituted by a scenario dominated by chaotic dynamics.
In our case, with the ratchet potential given by Eq. 2 and choosing , one obtains , so that the critical mass that roughly separates the underdamped and overdamped regimes is . Fig. 10 shows the characteristics for particle densities , 3 and 4, and different mass values, ranging from 0 to 5. Larger values lead to chaotic dynamics, which is out of the scope the present paper (in fact, already for , chaotic trajectories were observed for a few drive amplitude values resulting on the fluctuations exhibited by the curves for and ). As it is clear, for (i.e. and ), the transitions between different ratchet phases are more abrupt than those observed for . Notwithstanding, the oscillations are still present and the behavior of for and is quite revealing with respect to the scenario described in Sec. III.1. For instance, the interval in the curve seems to qualitatively imitate the whole curve, whereas the interval in the curve seems to qualitatively imitate the () curve. This is consistent with the fact that it is the number of localized particles which determines the ratchet direction. The qualitative similarity between curves with different arises from the fact that in the underdamped regime the ratio between the particle current and the force amplitude has a universal shape which does not depend on the details of the potential but rather on its critical forces Borromeo et al. (2002).
For , the curves are much smoother and, for and , the high-amplitude negative drift phase becomes positive for . Notwithstanding, the oscillations, reminiscent of the interplay between localized and delocalized particles, are still present, even in the case.
IV Summary
In summary, the transport properties of interacting particles confined in a 1D ratchet potential has been investigated in detail. It has been shown that, in the low-temperature adiabatic regime, the particle chain of density undergoes a series of current inversions as the oscillating drive amplitude is increased for a range of the investigated parameters. A systematic study of the time-averaged particle density and cumulative mass, calculated at different drive intensities, suggests that these inversions result from the competition between different dynamical states of the chain where a certain fraction of the particles are effectively trapped by the substrate, while the others float over the effective potential generated by the substrate and the localized particles. The number of localized particles determines the symmetry of the effective ratchet potential and, consequently, the preferential drift direction. In the non-zero thermal noise regime, the oscillating behavior of the amplitude-dependent mean current observed at low temperatures gives place to a positive-drift phase in the whole amplitude range at a sufficiently high temperature. In cases where the drift is negative at , the current direction becomes positive at a certain temperature-dependent critical amplitude , which decreases linearly. Such behavior suggests that these noise-induced inversions can be associated with thermal activation of localized particles over the substrate barriers. Finally, the high-frequency regime has been addressed for both weak and strong noises. For weak noise, the steps and spikes reminiscent of the well-known lock-in effect have been observed. But here the size of the steps can be fine-tuned by changing the particle density. In the strong noise case, the interplay between thermal fluctuations and the fast oscillations of the driving force leads to the complete inversion towards the negative drift direction in the whole amplitude range.
References
- Magnasco (1993) M. O. Magnasco, Phys. Rev. Lett. 71, 1477 (1993).
- Doering et al. (1994) C. R. Doering, W. Horsthemke, and J. Riordan, Phys. Rev. Lett. 72, 2984 (1994).
- Bartussek et al. (1994) R. Bartussek, Hänggi, P., and J. G. Kissner, Europhys. Lett. 28, 459 (1994).
- Astumian and Bier (1994) R. D. Astumian and M. Bier, Phys. Rev. Lett. 72, 1766 (1994).
- Reimann (2002) P. Reimann, Phys. Report 361, 57 (2002).
- Jülicher et al. (1997) F. Jülicher, A. Adjari, and J. Prost, Rev. Mod. Phys. 69, 1269 (1997).
- Bader et al (1999) J. S. Bader et al, Proc. Natl. Acad. Sci. USA 96, 13165 (1999).
- Lee et al. (1999) C. S. Lee, B. Jankó, I. Derényi, and A. L. Barabási, Nature 400, 337 (1999).
- Vilegas et al. (2003) J. E. Vilegas, F. Savel’ev S., Nori, E. M. Gonzales, J. V. Anguita, R. Garcia, and J. L. Vicent, Science 302, 1188 (2003).
- Van de Vondel et al. (2005) J. Van de Vondel, C. C. de Souza Silva, B. Y. Zhu, M. Morelle, and V. V. Moshchalkov, Phys. Rev. Lett. 94, 057003 (2005).
- de Souza Silva et al. (2006a) C. C. de Souza Silva, J. Van de Vondel, B. Y. Zhu, M. Morelle, and V. V. Moshchalkov, Phys. Rev. B 73, 014507 (2006a).
- de Souza Silva et al. (2006b) C. C. de Souza Silva, J. Van de Vondel, M. Morelle, and V. V. Moshchalkov, Nature 440, 651 (2006b).
- Savel’ev et al. (2003) S. Savel’ev, F. Marchesoni, and F. Nori, Phys. Rev. Lett. 91, 010601 (2003).
- Fistul (2002) M. V. Fistul, Phys. Rev. E 65, 046621 (2002).
- Derényi and Vicsek (1995) I. Derényi and T. Vicsek, Phys. Rev. Lett. 75, 374 (1995).
- Jülicher and Prost (1995) F. Jülicher and J. Prost, Phys. Rev. Lett. 75, 2618 (1995).
- Porto et al. (2000) M. Porto, M. Urbakh, and J. Klafter, Phys. Rev. Lett. 84, 6058 (2000).
- Shalom and Pastoriza (2005) D. E. Shalom and H. Pastoriza, Phys. Rev. Lett. 94, 177001 (2005).
- Lu et al. (2007) Q. Lu, C. J. O. Reichhardt, and C. Reichhardt, Phys. Rev. B 75, 054502 (2007).
- Gillijns et al. (2007) W. Gillijns, A. V. Silhanek, V. V. Moshchalkov, C. J. O. Reichhardt, and C. Reichhardt, Phys. Rev. Lett. 99, 247002 (2007).
- Kim et al. (1962) Y. B. Kim, C. F. Hempstead, and A. R. Strnad, Phys. Rev. Lett. 9, 306 (1962).
- Lemerle et al. (1998) S. Lemerle, J. Ferre, C. Chappert, V. Mathet, T. Giamarchi, and P. Le Doussal, Phys. Rev. Lett. 80, 849 (1998).
- Anderson and Kim (1964) P. W. Anderson and Y. B. Kim, Rev. Mod. Phys. 36, 39 (1964).
- Borromeo et al. (2002) M. Borromeo, G. Constatini, and F. Marchesoni, Phys. Rev. E 65, 041110 (2002).