Thermal dissociation of dipositronium: path integral Monte Carlo approach
Abstract
Path integral Monte Carlo simulation of the dipositronium "molecule" Ps2 reveals its surprising thermal instability. Although, the binding energy is eV, due to the strong temperature dependence of its free energy Ps2 dissociates, or does not form, above K, except for high densities where a small fraction of molecules are in equilibrium with Ps atoms. This prediction is consistent with the recently reported first observation of stable Ps2 molecules by Cassidy & Mills Jr., Nature 449, 195 (07), and Phys.Rev.Lett. 100, 013401 (08); at temperatures below K. The relatively sharp transition from molecular to atomic equilibrium, that we find, remains to be experimentally verified. To shed light on the origin of the large entropy factor in free energy we analyze the nature of interatomic interactions of these strongly correlated quantum particles. The conventional diatomic potential curve is given by the van der Waals interaction at large distances, but due to the correlations and high delocalization of constituent particles the concept of potential curve becomes ambiguous at short atomic distances.
pacs:
31.15.xk, 36.10.Dr, 31.15.aeDipositronium or positronium molecule, Ps2, is a four-body system consisting of two electrons and two positrons. The dynamical stability of dipositronium was established in 1947 by Hylleraas and Ore Hylleraas and Ore (1947). However, the molecule was not observed experimentally until recently Cassidy and Mills Jr. (2007), even though a lot of knowlegde had been provided by a number of theoretical studies, see Refs. Kinghorn and Poshusta (1993); Poshusta and Kinghorn (1996); Bressanini et al. (1997a); Usukura et al. (1998); Usukura and Suzuki (2002); Schrader (2004); Bailey and Frolov (2005) and references therein. In addition to the fundamental issues of physics, Ps2 is of interest also in astrophysical applications and solid state physics Bubin and Adamowicz (2006); Emami-Razavi (2008).
In laboratory conditions, Ps2 formation has recently been observed resulting from implantation of intense pulses of positrons into porous silica films Cassidy and Mills Jr. (2007, 2008).
The positronium molecule, with all the four particles of the same mass, sets challenges to modeling, since quantum calculations are to be performed fully non-adiabatically Kozlowski and Adamowicz (1993). This, however, can be realized with quantum Monte Carlo (QMC) methods Traynor et al. (1991); Bressanini et al. (1997b); Kylänpää et al. (2007). It should be pointed out that also for other systems, approaches that are not restricted by the Born–Oppenheimer or other adiabatic approximations are gaining more attention Kylänpää et al. (2007); Bhatia and Drachman (1999); Taylor et al. (1999); Korobov (2001); Kreibich and Gross (2001); Ohta et al. (2003); Chakraborty et al. (2008); Kreibich et al. (2008).
Among the QMC methods the path integral Monte Carlo (PIMC) offers a finite temperature approach together with a transparent tool to trace the correlations between the particles involved. Though computationally challenging, with the carefully chosen approximations PIMC is capable of treating low-dimensional systems, such as small molecules or clusters accurately enough for good quantum statistics for a finite temperature mixed state Li and Broughton (1987); Ceperley (1995); Pierce and Manousakis (1999); Kwon and Whaley (1999); Knoll and Marx (2000); Cuervo and Roy (2006).
In this study, using PIMC we evaluate the density matrix of the full four-body quantum statistics in temperature dependent stationary states. Thus, the temperature dependent distributions of structures and energetics of Ps2 are established. The main focus here is to find the preferred configuration of the four-body system at each temperature — Ps2 molecule or two Ps atoms.
According to the Feynman formulation of the statistical quantum mechanics Feynman (1998) the partition function for interacting distinguishable particles is given by the trace of the density matrix ,
where is the action, , and is called the Trotter number (). In present simulations, we use the pair approximation of the action and matrix squaring for evaluation of the Coulomb interactions Storer (1968); Ceperley (1995). Sampling of the paths in the configuration space is carried out using the Metropolis algorithm Metropolis et al. (1953) with the bisection moves Chakravarty et al. (1998). The Coulomb potential energy is obtained as an expectation value from sampling and the kinetic energy is calculated using the virial estimator Herman et al. (1982).
The error estimate for the PIMC scheme is commonly given in powers of the imaginary time time-step Ceperley (1995). Therefore, in order to determine comparable thermal effects on the system we have carried out the simulations with similar sized time-steps regardless of the temperature. This way the temperature dependent properties can be compared avoiding temperature dependent systematic errors. The standard error of the mean (SEM) with two-sigma limits is used to indicate the statistical uncertainty, where relevant. The average of the chosen time-step is , where denotes the atomic unit of energy, Hartree ( eV). The other atomic unit we use here is Bohr radius for the length, ( Å).
The total energy of positronium "atom" Ps is at K and the binding energy of the molecule Ps2 is ( eV) Schrader (2004). We find these values as zero Kelvin extrapolates from our simulations at low temperatures. We point out that with PIMC we evaluate energetics as statistical expectation values from sampling with less accuracy than that from conventional solutions of wavefunctions and the zero Kelvin data we obtain as extrapolates, only.
In Fig. 1 we present the "apparent dissociation energy" of Ps2 at several different temperatures. In each temperature this is the negative total energy of the molecule with respect to two atoms as . At K we find for the average over shown temperatures , which is very close to the dissociation energy at zero Kelvin, . However, at higher temperatures the apparent dissociation energy vanishes, because and become the same. This is because of molecular dissociation, or to be more exact, the two atoms do not bind in our equilibrium state simulation at K and the predominant configuration is that of two separate positronium atoms.
Simulations in a well-defined Ps density are time consuming, and therefore, these kind of studies have been carried out at the transition region around K, only. Using the periodic boundary conditions and the cubic supercells of sizes from to with two Ps atoms we have simulated three densities from to m-1, respectively. We see that with increasing density the equilibrium shifts to the molecular direction making the transition smoother and raising it to higher temperatures compared to the more sharp low density limit.
For completeness we should point out that in equilibrium at any finite temperature the zero density limit consists of Ps atoms, only. Correspondingly, increasing density will eventually smoothen the transition away.
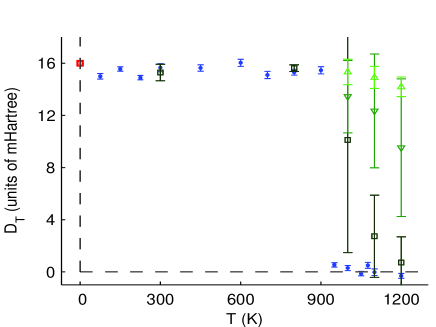
In the recent experiment, cited above Cassidy and Mills Jr. (2007, 2008), formation of Ps2 molecules was observed below K in about two orders of magnitude lower densities than our lowest, above (Fig. 1). Formation was not observed at higher temperatures, however, because the Ps atoms desorbed from the confining porous silica surface with the activation energy eV ( K). Thus, our prediction of thermal dissociation of Ps2 above K in the experimentally achievable densities remains to be verified in forthcoming experiments in higher temperatures.
| Refs. | |||||||
|---|---|---|---|---|---|---|---|
| PIMC |
Next, we compare our finite-temperature Ps2 data to the published zero Klevin results, discuss the details of Ps–Ps interaction, and finally, conclude with the explanation of the higher temperature instability.
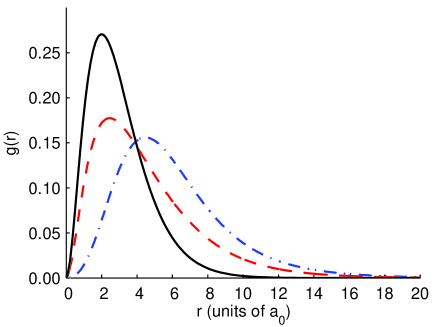
The conventional zero Kelvin like Ps2 state of the system below K is confirmed from the distributions in Fig. 2 and related data in Table 1. The pair correlation functions for like and opposite charged particles are essentially identical with those reported elsewhere Usukura et al. (1998) and the expectation values of various powers of these distributions match with other published reference data. At higher temperatures, where K, the corresponding distributions and data become that of the free Ps atoms.
At K the thermal energy eV, only. Therefore, the obvious question arises: Why the Ps2 molecule with binding energy eV is unstable above K? Is there a temperature dependence hidden in the interactions? What does the potential energy curve of this diatomic molecule look like?
It is the van der Waals interaction or sc. dispersion forces, that are expected to contribute to the potential curve at larger atomic distances. These arise from the "dynamic dipole–dipole correlations", as usually quoted. Now, within our approach we have a transparent way to consider these interactions: the dipoles and their relative orientations. Thus, we monitor the dipole–dipole orientation correlation function
| (1) |
as a function of interatomic distance , where and are the two dipoles. This function assumes values from to , corresponding orientations from perfectly opposite to fully random.
The concept of interatomic distance needs to be defined for evaluation. We should note that at the "equlibrium distance" the centers-of-mass (CM) of all four particles are superimposed on the same location, as evaluated from their one particle distributions (or wavefunctions). However, the particles do have well-defined (correlated) average distances, see Table 1. Thus, the definition is not trivial.
We can define the center-of-mass interatomic distance using the expectation value of the CM of one pair and that of the other pair. An alternative (correlated) definition is the expectation value of the separation of the two dipoles, . At large distances these two coincide, but at the opposite limit, in Ps2 molecule, the former becomes zero whereas the latter remains at about 4 .
Another problem is that in an equilibrium simulation we are not able to choose or fix the interatomic distance ( or ). Therefore, evaluation of dependent quantities presumes that sampling in the chosen temperature includes the relevant with good enough statistics. This kind of data hunting turns out to be computationally challenging.
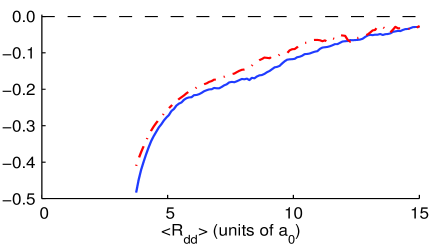
To overcome this, we have used a "close-to-equilibrium" technique by starting from K distribution and rising the temperature to K, and then, applying the reverse change in temperature to obtain another estimate. In the former case we are able to follow the increase in from the molecular region to "dissociation", while the latter follows "recombination".
In Fig. 3 we show the estimates from these two temperatures to the correlation function wrt. the interatomic distances and . We emphasize that these are estimates, only, because at different temperatures the equilibrium sampling regions of are very different. However, we see that the difference between these two estimates is very small and the equilibrium simulation correlation function between these two is easily conceived. Thus, we conclude that the dipole–dipole correlation is not temperature dependent.
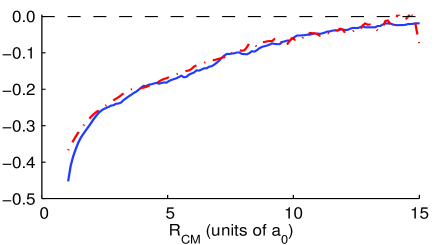
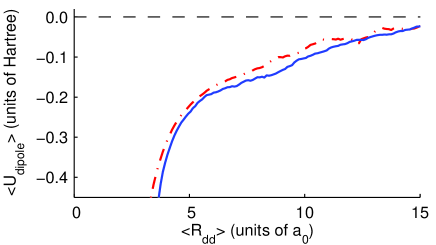
Using the same "close-to-equilibrium" technique we evaluate the van der Waals interaction energy, next. This is shown in Fig. 4. There too, the true equilibrium curve can be estimated as the average of the two shown ones. Simple fit reveals that the large distance limit () shows the asymptotic behavior ( roughly ) as expected.
Sampling all the energy contributions with the same "close-to-equilibrium" technique allows us to evaluate the total energy or the diatomic potential energy curve as a function of interatomic distance , where or . It shows the same temperature independent behavior, though the statistics is not good enough to allow showing the curve, here. As expected, we find that the true dissociation energy is not temperature dependent, as is the "apparent dissociation energy" shown in Fig. 1.
Now, the "thermal dissociation" can be explained by the strong temperature dependence of the Ps2 free energy. With the rising temperature the free energy of the two atoms decreases below that of the molecule, leading to transition from the molecular dominance to the atomic one. This is not a surprise, but the usual behavior of the conventional molecules. From our simulations we find, however, the following surprising features: (i) the low temperature, where the transition takes place, (ii) sharpness of the transition and (ii) almost negligible density dependence at the experimentally relevant densities.
The transition temperature is usually estimated by matching the thermal energy with the dissociation energy. This is where the entropic contribution in free energy becomes comparable with the dissociation energy. In the present case, this gives about K. Conventionally, the transition is smooth following from the equilibrium between molecular dissociation and formation, where the former depends on the temperature, and the latter, on the density, the density being the main factor in the entropy.
The Ps2 molecule lacking in the heavy nuclei is peculiar. All of its constituents are strongly delocalized, barely fitting into the binding regime of the molecular potential curve. This is what they do below K in experimentally relevant densities, but not above K. This is a consequence from the exceptionally large entropy factor originating from the strong quantum delocalization more than the density.
In summary, with path integral Monte Carlo simulations of the dipositronium "molecule" Ps2 we have found and explained its surprising thermal instability. Due to the strong temperature dependence of the free energy of the considered four particle system the molecular form is less stable than two positronium atoms above about K, though the molecular dissociation energy is eV. The transition in equilibrium from molecules to atoms is sharp in temperature and only weekly density dependent. This can be understood by the large entropy factor originating from strong delocalization of all of the molecular constituents. Our prediction remains to be experimentally verified.
We thank David Ceperley for his attention and interest in our work. For financial support we thank the Academy of Finland, and for computational resources the facilities of Finnish IT Center for Science (CSC) and Material Sciences National Grid Infrastructure (M-grid, akaatti).
References
- Hylleraas and Ore (1947) E. A. Hylleraas and A. Ore, Phys. Rev. 71, 493 (1947).
- Cassidy and Mills Jr. (2007) D. B. Cassidy and A. P. Mills Jr., Nature 449, 195 (2007).
- Kinghorn and Poshusta (1993) D. B. Kinghorn and R. D. Poshusta, Phys. Rev. A 47, 3671 (1993).
- Poshusta and Kinghorn (1996) R. D. Poshusta and D. B. Kinghorn, Int. J. Quantum Chem. 60, 213 (1996).
- Bressanini et al. (1997a) D. Bressanini, M. Mella, and G. Morosi, Phys. Rev. A 55, 200 (1997a).
- Usukura et al. (1998) J. Usukura, K. Varga, and Y. Suzuki, Phys. Rev. A 58, 1918 (1998).
- Usukura and Suzuki (2002) J. Usukura and Y. Suzuki, Phys. Rev. A 66, 010502(R) (2002).
- Schrader (2004) D. M. Schrader, Phys. Rev. Lett. 92, 043401 (2004).
- Bailey and Frolov (2005) D. H. Bailey and A. M. Frolov, Phys. Rev. A 72, 014501 (2005).
- Bubin and Adamowicz (2006) S. Bubin and L. Adamowicz, Phys. Rev. A 74, 052502 (2006).
- Emami-Razavi (2008) M. Emami-Razavi, Phys. Rev. A 77, 042104 (2008).
- Cassidy and Mills Jr. (2008) D. B. Cassidy and A. P. Mills Jr., Phys. Rev. Lett. 100, 013401 (2008).
- Kozlowski and Adamowicz (1993) P. M. Kozlowski and L. Adamowicz, Phys. Rev. A 48, 1903 (1993).
- Traynor et al. (1991) C. A. Traynor, J. B. Anderson, and B. M. Boghosian, J. Chem. Phys. 94, 3657 (1991).
- Bressanini et al. (1997b) D. Bressanini, M. Mella, and G. Morosi, Chem. Phys. Lett. 272, 370 (1997b).
- Kylänpää et al. (2007) I. Kylänpää, M. Leino, and T. T. Rantala, Phys. Rev. A 76, 052508(7) (2007).
- Bhatia and Drachman (1999) A. K. Bhatia and R. J. Drachman, Phys. Rev. A 59, 205 (1999).
- Taylor et al. (1999) J. M. Taylor, A. Dalgarno, and J. F. Babb, Phys. Rev. A 60, R2630 (1999).
- Korobov (2001) V. I. Korobov, Phys. Rev. A 63, 044501 (2001).
- Kreibich and Gross (2001) T. Kreibich and E. K. U. Gross, Phys. Rev. Lett. 86, 2984 (2001).
- Ohta et al. (2003) Y. Ohta, J. Maki, H. Nagao, H. Kono, and Y. Fujimura, Int. J. Quantum Chem. 91, 105 (2003).
- Chakraborty et al. (2008) A. Chakraborty, M. V. Pak, and S. Hammes-Schiffer, Phys. Rev. Lett. 101, 153001 (2008).
- Kreibich et al. (2008) T. Kreibich, R. van Leeuwen, and E. K. U. Gross, Phys. Rev. A 78, 022501 (2008).
- Li and Broughton (1987) X.-P. Li and J. Q. Broughton, J. Chem. Phys 86, 5094 (1987).
- Ceperley (1995) D. M. Ceperley, Rev. Mod. Phys 67, 279 (1995).
- Pierce and Manousakis (1999) M. Pierce and E. Manousakis, Phys. Rev. B 59, 3802 (1999).
- Kwon and Whaley (1999) Y. Kwon and K. B. Whaley, Phys. Rev. Lett. 83, 4108(4) (1999).
- Knoll and Marx (2000) L. Knoll and D. Marx, Europ. Phys J. D 10, 353 (2000).
- Cuervo and Roy (2006) J. E. Cuervo and P.-N. Roy, J. Chem. Phys. 125, 124314 (2006).
- Feynman (1998) R. P. Feynman, Statistical Mechanics (Perseus Books, Reading, Massachusetts, 1998).
- Storer (1968) R. G. Storer, J. Math. Phys. 9, 964 (1968).
- Metropolis et al. (1953) N. Metropolis, A. W. Rosenbluth, M. N. Rosenbluth, A. H. Teller, and E. Teller, J. Chem. Phys. 21, 1087 (1953).
- Chakravarty et al. (1998) C. Chakravarty, M. C. Gordillo, and D. M. Ceperley, J. Chem. Phys. 109, 2123 (1998).
- Herman et al. (1982) M. F. Herman, E. J. Bruskin, and B. J. Berne, J. Chem. Phys. 76, 5150 (1982).