TOTAL AND NUCLEAR PHOTOABRORPTION CROSS SECTIONS OF IN THE ENERGY RANGE OF 8-70 MEV
Abstract
Total (atomic+nuclear) photoabsorption cross section of was for the first time measured in the energy range of 8-70 MeV. Experimental data was produced with small statistic and systematic errors. The results deviate from calculations of atomic cross section at photon energies above 40 MeV. Photonuclear cross section in the region of the E1 giant dipole resonance (GDR) clearly exhibits three peaks at 18.9, 20.9 and 23.1 MeV. At higher energies, the measured cross section hints a dip-peak structure at 40-48 MeV.
, , , , .
1 Introduction
Detailed study of photonuclear interaction in the region of E1 and E2 resonances provides meaningful information regarding fundamental properties of nuclear matter. Since electromagnetic interaction is well known, the interpretation of such experiments is less complicate in respect to hadron- and meson-nuclear interaction. Several problems are of special interest in this physics domain: i) the evolution of the giant dipole E1 resonance (GDR) properties with the mass number ; ii) the relative role of the isospin and congigurational GDR splittings; iii) contributions of resonances others than E1, in particular, the isoscalar E2 resonance.
Given these points, the study of medium nuclei with mass number is of particular interest. The GDR in these nuclei is concentrated in a rather narrow energy range while the expected position of the resonance is on the growing part of the E1 dipole cross section. Both factors favor the discrimination of one resonance from the other in this mass region. In heavy nuclei, the E2 isoscalar resonance is located just near the threshold (6-8 MeV), and its study is more difficult through the small cross section. For light nuclei, the complicated fine structure of the GDR requires high resolution detectors, and, in addition, the interpretation of many overlapping peaks in photonuclear cross section is rather sophisticated.
Similar consideration can be applied to the study of the isospin splitting of giant resonances. Observation of this effect is more difficult in case of heavy nuclei since decays of resonances are suppressed in the photoproton channel by Coulomb forces, while in the photoneutron channel they are forbidden by the isospin conservation.
The experimental investigation of the configurational splitting of the GDR is the most important task for the understanding of the GDR excitation. The GDR configurational splittings was first predicted for light nuclei in Ref. [1] and then proved in Ref. [2]. Up to now it was observed only in the region of nuclei with with [3, 4]. An open question is whether it can play a role at higher A.
Reliable experimental data for medium nuclei are essential to determine the limit of validity of theoretical models describing nuclear excitations. Microscopic calculations are difficult for such many-nucleon systems, while collective models, well describing heavy nuclei, have not been yet extended to medium region because of lack of experimental data.
Measurements of total photonuclear cross section () is quite attractive for the interpretation of experimental results since it doesn’t require any assumptions on the nuclear de-excitation. Therefore the experimental data on for medium nuclei may provide a challenge for the further development of theoretical models. At present the available data base for total and nuclear photoabsorption cross sections comprises only data points for light and heavy nuclei. Light nuclei () have been intensively studied in pioneer experiment [5] that aimed to establish a fine structure of the GDR. Later, experimental efforts have been extended to the heavy-nuclei region () [6, 7]. The goal of those measurements was to observe the evolution of GDR parameters with the mass number A. There is a lack of data for medium nuclei.
2 Attenuation method
There are two main methods to obtain :
1. Summing of cross sections of main partial channels. This method was
widely used in studies of heavy nuclei. For these nuclei
the emission of a single neutron is a dominating channel. However,
for light nuclei the contribution of the reaction
becomes more essential, and, for some nuclei, exceeds the one.
The efficient detection of the final state
in not easy in experiment because of the internal absorption of emitted
protons inside the target.
2. Attenuation method. This method implies on a measurement
of the attenuation of a photon beam by a sample of material under study.
Attenuation coefficients at different photon energies are obtained as
a ratio of two spectra: a spectrum of a beam attenuated by a sample of material
and a spectrum of an unattenuated beam. Total (atomic-plus-nuclear)
photoabsorption cross section is derived from the attenuation coefficients.
Further photonuclear cross section can be derived as a difference between
the measured total cross section and the calculated atomic one.
This method, being more accurate, requires some specific experimental
efforts: a high-resolution and stable photon spectrometer, a complicate
data analysis, and high-statistics and low-systematics data collection.
The latter requirement is rather important since photonuclear
cross section is small and at its maximum is of only few percents of
total cross section.
The attenuation method has been initially developed to investigate
the region of light nuclei where only few final states contribute to
photonuclear cross section. In that region the photonuclear absorption
is relatively strong (5-10% of total cross section). This method
can also be applied to medium nuclei because of following reasons:
i) In medium and heavy nuclei the main strength of the GDR is concentrated
in a narrow energy range. This leads to the relative increase of the
ratio in the region of the dipole maximum.
ii) For these nuclei, the contribution of Compton scattering to atomic
photoabsorption becomes more essential in respect to
pair production. Compton cross section linearly increases with
the nuclear charge Z. Therefore atomic cross section for these nuclei
raises up slowly than nuclear one which is proportional to .
As it was already mentioned, the main difficulty of the attenuation method is the small value of photonuclear cross section. Since the quantity measured in experiment is total cross section, any uncertainties in both experimental data and calculated atomic cross section may affect final results. The precision of atomic photoabsorption calculations depends on used corrections, such as Coulomb and radiative corrections, screening of nuclear field etc., and varies for different nuclei [8]. Such calculations are more accurate (1%) for light nuclei where less corrections are needed while available experimental data provide good testing ground for theoretical approaches. The uncertainties raise up for medium and heavy nuclei and reach 2-3%.
To eliminate such uncertainties from final photonuclear cross section data points, a phenomenological correction of calculated atomic cross section can be introduced. This correction is to be based on obtained total cross section data. It is known that the nuclear photoabsorption is small (about 0.1% of the total cross section) near () threshold and at energies essentially higher the GDR. The evaluation of in these regions can be obtained from theoretical calculations and available data on partial channels. Further the evaluation of atomic cross section is also possible at the same energies. The energy dependence of atomic cross section is flat and any irregular behavior is not expected. This makes it possible to “re-normalize” the calculated atomic cross section to the measured total photoabsorption cross section.
Another criterion for the correction of atomic cross section is the value of integrated photonuclear cross section. The sum rule for the dominating dipole E1 nuclear photoabsorption is
| (1) |
In reality this sum rule is saturated at MeV. Real integrated cross section is slightly larger because of the contribution of processes others that E1. However the deviation from (1) is small and can be estimated with reasonable accuracy.
3 Experiment
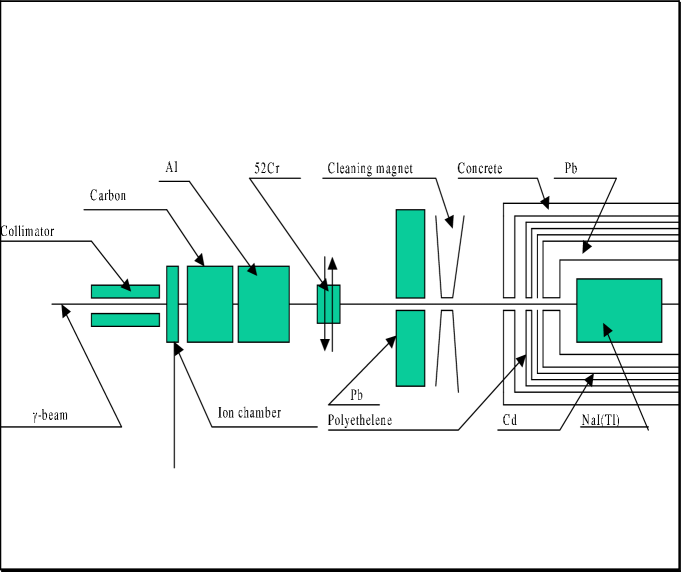
The bremsstrahlung beam, produced in the thin internal tungsten target of the C-25 synchrotron of the Institute for Nuclear Research, passed a first conical 15 cm thick collimator with the 3 mm diameter output window, an ionization chamber, a sample of under study, a main collimator with a cleaning magnet, and then reached a photon spectrometer (Fig.1). The ionization chamber made it possible the precise (0.2%) measurement of a beam dose. However, the only ratio of doses of direct and attenuated spectra was needed in this experiment thus reducing the related systematic uncertainty. Since the number of photons per second in the primary beam was very high, the beam intensity was reduced by implanting a 54.2+60 cm thick aluminum-plus-carbon absorber. The total photoabsorption cross sections in aluminum and carbon have their minimum near 20 MeV and strongly raise up below 10 MeV [8]. Therefore the absorber reduced the number of photons at low energies keeping this number at the appropriate count rate at higher energies.
A sample was inserted into a computer-controlled trolley. The trolley could be moved in/out the beam on-line during the data taking. In order to reduce systematic uncertainties, the alternate data collections of the direct and attenuated spectra each lasted 3 and 8 minutes respectively, were carried out. The full measurement included hundreds of such cycles resulting in total beam time of about 500 hours. Thanks to alternate data collection, any apparatus and accelerator instabilities affected both spectra in the same way. Consequently the ratio of those spectra remained much less affected.
One important problem of such an experiment is the detection of secondary particles originating from the shower production in a sample, collimators, air etc. Such particles, after being re-scattered, could reach the detector. To reject this background the 50 cm long collimator of 3 mm diameter was installed at 6 m far from the sample of . This collimator limited the detector acceptance to only of str. The collimator was accurately aligned along the beam axis by using a laser. The cleaning magnet located just behind the collimator was used to eliminate the remaining pairs.
The photon spectrometer was surrounded by a shield made of concrete blocks, polyethylene, cadmium foil and lead. The main component of the spectrometer was a large 30.5 cm long and 25.4 diameter NAI(TL) crystal manufactured by Nuclear Enterprises Ltd. The crystal was viewed by six EMI9758B phototubes. Signals from the output of the spectrometer were amplified, formed and then encoded by a charge-to-digit converter (QDC). Measured spectra were accumulated in a CAMAC buffer memory and recorded on-line.
The gains of the phototubes were stabilized by using light pulses from thermostabilized light emitting diodes (LEDs). The light pulses were generated in time between synchrotron bunches in order to avoid their overlapping with photons. The recorded spectrum of light pulses contained two narrow peaks corresponding to two different amplitudes of current pulses triggering LEDs . Calculated mean positions of these peaks were used to correct the gain and the pedestal of QDC. This operation was activated on-line each 30 seconds. As byproduct, the additional illumination of the phototubes has strongly reduced jumping gain instabilities related to the difference in count rates (about 7 times) in the direct and attenuated spectra. In addition, the spectrometer was calibrated each 2-3 hours using radioactive source (two -lines of 0.511 and 1.275 MeV). The resulting short- and long-term instabilities never exceeded 0.2%.
The duration of a scintillation in the NAI(TL) crystal is 0.8 sec. If two photons were detected within a time interval shorter than the duration of a scintillation, such events could be accepted as one event of larger amplitude. We have developed a special “pile-up inspector” NIM unit which analyzed the shape of phototube signals. If the time difference between two scintillations was less than 0.8 sec and more than 0.4 sec, the first signal was recovered and passed to the input of QDC while the second was rejected. If the time difference was less than 0.4 sec and more than 0.1sec, both events were rejected. Events with time difference shorter than 0.1 sec were considered as one events. The total number of rejected events was recorded. Rejected events and remaining pile ups were recovered in an off-line analysis (see below).
A response function of the photon spectrometer and its energy resolution were determined by comparing measured and calculated bremsstrahlung spectra [9]. A spectrum measured by a photon spectrometer is folded with its response function
| (2) |
and denote measured and real incident spectra, is the spectrometer response to a photon of energy E. In preliminary calibration tests we have accumulated 60 bremsstrahlung spectra with different maximum energies varied from 20 to 80 MeV. The shape of incoming spectra was calculated taking into account the photon absorption in the aluminum-carbon absorber. We have developed an analytical expression describing the response function of our spectrometer. This expression included 10 parameters each being a function of energy of incoming photons. These parameters were determined from the minimization of between measured and calculated spectra. It was found that the spectrometer provides the energy resolution of 3.5% (Full Width at a Half of Maximum) at photon energies near 20 MeV. At lower and higher energies the resolution is slightly worse (5% and 4% FWHM at 10 and 40 MeV respectively).
———————————————————-

4 Data analysis
Two measured spectra are shown in Fig.2 These spectra are different from the spectrum incident on the sample of and from the attenuated spectrum because of cosmic background, unrejected pile ups, and response function of the spectrometer.
4.1 Subtraction of cosmic background
The average count rate of cosmic particles is much lower than the count rate of incoming photons. However in the high energy part of the attenuated spectrum its contribution reached 1% . The spectrum of cosmic background was measured keeping the accelerator beam off. It was subtracted from the measured spectra after normalization on the duration of data collection for each spectrum.
4.2 Pile ups correction
If two photons were detected within time interval less than 0.1sec, such events were recognized by electronics as one event of larger amplitude. In the spectrum without attenuation the number of unrejected pile up events could reach 1-2% depending on the beam intensity. As a result, some false events appeared in the high energy part of the spectrum simultaneously with the reduction of its low energy part. The correction of the spectra shape was based on the assumption that the amplitude of a pile-up event is equal to the sum of amplitudes of overlapping signals while the probability of pile ups is proportional the total count rate. The latter was monitored and recorded during data taking.
4.3 Correction on the response function
The measured spectra are folded with the response function the photon spectrometer. The main measurement was different from the calibration test: accelerator bunches were stretched in time in order to decrease the number of rejected events and pile ups and to reduce significantly the requested beam time. This mode of operation was achieved by keeping constant the magnetic field in the accelerator volume after it reaches certain level during the acceleration cycle. Once the magnetic field was fixed, the radius of the electron trajectory inside the accelerator chamber is defined by the electron kinetic energy and slowly increases because of acceleration. The passage of the electron beam through the internal target of the accelerator slowed down in respect to the usual accelerator operation resulting in much longer accelerator bunches. The photon spectrum emitted in this operation mode was different from the bremsstrahlung and its shape cannot be calculated as in case of described above calibration measurements.

To recover the distortion of the spectra, we used the so-called reduction method [10]. Since in reality measured spectra are arrays of counts in the QDC channels, the expression (2) can be transformed to its discrete form
| (3) |
where indexes i,j denote QDC channels each corresponding to certain energy, denotes a spectrum at the output of the spectrometer, denotes an incident spectrum, denotes the matrix of the response function. One may define a matrix operator which allows to re-calculate to another response function
| (4) |
In this expression the “new” spectrum corresponds to the “new” response function
| (5) |
By choosing the operator one may reconstruct the initial spectrum . In practice, however, the transformation to an ideal -type response function leads to the strong increase of statistic errors. It would be more reasonable to adjust the operator such that the resulting response function would be symmetric and would provide the energy resolution enough to retrieve an expected structure in cross sections. In Fig.3 the real response function for 55 MeV photons and the “new” response function used in data analysis are shown. Accordingly Fig.4 demonstrates the measured and the reconstructed spectra corresponding to the real and “new” response functions shown in Fig.3.

5 Getting the cross section
A photon flux after passing a sample of material is attenuated in K times
| (6) |
where is the sample length in at/cm2, is the total photoabsorption cross section. can be easily calculated from the linear length and the density of a sample. In our experiment the attenuation coefficients were obtained as a ratio of two spectra
| (7) |
where is the photon beam spectrum without attenuation, is the spectrum attenuated by the sample, is the ratio of beam doses. The total cross section is derived as
| (8) |

The obtained total photoabsorption cross section is shown in Fig.5. Data points cover the energy range from 8 to 70 MeV. These data have been produced with low statistic errors of 0.2% at energies of 10-20 MeV and slightly larger, up to 0.6% at higher energies. The systematic uncertainty in our data is estimated as 1%. Its main sources are the accuracy of the pile up and response function corrections and some of apparatus instabilities.
In Fig.5 the atomic cross section calculated by Hubbell, H.A.Gimm, and I.Overbo [8] is compared with our data. This model was quite successful in reproducing experimental data for light () and heavy () nuclei. If at lower energies there is a good agreement between our data and this model, at higher energies the discrepancy becomes more pronounced and is out of statistic and systematic errors.

It is well known that nuclear photoabsorption reaches its maximum in the region of giant dipole resonances (15-30 MeV) while at lower energies near thresholds and essentially higher ( 60 MeV) its value doesn’t exceed few mbarn. In order to evaluate the photonuclear cross section, we have introduced a small phenomenological correction of the calculated atomic cross section.
| (9) |
The atomic cross section thus corrected well fits experimental data (Fig.5). The photonuclear cross section was taken as a difference between the total and corrected atomic cross sections.
It is worth noting that the introduced correction is a flat function of energy and cannot affect any structure in the photonuclear cross section. In the region of 15-30 MeV, the interaction of photons with nuclei is governed by the excitation of the E1 giant dipole resonance (Fig.6). The dipole bump in the photonuclear cross section clearly reveals three peaks at 18.9, 20.9, and 23.1 MeV. At higher energies there is an indication on a dip-peak structure at 42 - 48 MeV.
6 Summary and Conclusions
For the first time the total photoabsorption cross section of nucleus was measured from 8 to 70 MeV of photon energy using an attenuation technique. The result deviates from that expected on the base of the calculated atomic cross section summed with the current estimates for the photonuclear cross section. This indicates a need to correct the presently available calculations of atomic cross sections. Further the reported technique to measure total photoabsorption cross sections could be employed for systematic measurements with various nuclei. Such measurements may be useful for many practical applications.
The derived photonuclear cross section in the region of the giant dipole resonance exhibits three peaks at 18.9, 20.9, and 23.1 MeV. This correlates with the results obtained in the study of reactions in this nuclei domain. The peaks might be a manifestation of either the configurational GDR splitting, or the isospin splitting, or the combination of both them. If confirmed, this would be a first observation of the GDR configurational splitting in the domain of medium nuclei. The concise explanation of the observed structure still remains a challenge for theoretical interpretation.
The observed dip-peak structure at 42-48 MEV may signal the photoexcitation of higher-lying nuclear resonances. This observation is at the limit of statistical confidence and require further experimental confirmation.
It’s a pleasure to thank the staff of the C-250 Synchrotron of the Institute for Nuclear Research and personally A.M.Gromov for their assistance during data taking and the stable beam operation. This work was supported in part by the Russian Basic Research Foundation grant 01-02-16478.
References
- [1] V.G.Neudachin and V.G.Shevchenko, Phys. Lett. 12, 18, 1964.
- [2] R.A.Eramzhian, B.S.Ishkhanov, I.M.Kapitonov, V.G.Neudachin, Phys. Rept. 136, 229, 1986.
- [3] A.S.Gabelko, K.M.Ignashev, B.S.Ishkhanov, I.M.Kapitonov, V.I.Mokeev, Sov. Nucl. Phys. 30, 1185, 1979.
- [4] B.S.Ishkhanov, I.M. Kapitonov, P.Pozmej, and K.V.Shitikova, GSI Preprint 89-16.
- [5] Burgov N.A., Daniljan G.V., Dolbilkin B.S., Lazareva L.E., Nikolaev F.A. In: Proc. of the Conf. on direct Interactions and nuclear reactions mechanism. Padjva, Sept. 3-8 1962. New-York-London, 1963 v.1, p.848.
- [6] G.Gurevich et al., Nucl. Phys. A 273(1976) 326.
- [7] P.Carlos et al., Nucl. Phys. A 258C(1976) 365.
- [8] J.H.Hubbell. H.A.Gimm, and I.Overbo, J.Phys. Chem. Data 9, 1023 (1980).
- [9] V.Kouznetsov et al., Pribory i Technika Eksperimenta 1, 35(1996).
- [10] Yu.Pyt’ev, “Analysis and interpretation of experimental data” Eds Moscow State University, Moscow, 1990.
- [11] Gorjachev A.M., Zalesny G.N., Tulupov B.A. Izvestija AN SSSR ser. phys., 1975, v.39, p.134-138. (in Russian)